
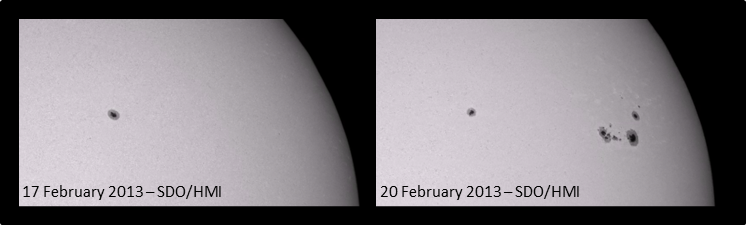
On 18 February, a sunspot group quickly developed to the southeast (bottom left) of NOAA 1671. According to the daily NOAA reports, fresh NOAA 1678 already reached its maximum sunspot area on 21 February, being nearly three times as large as the total area of the planet Earth.
This movie and picture underneath show the fast development of the sunspot group. Notice the merge of several sunspots, in particular in the leading portion of the group. Only in the trailing part there was some clustering of spots with opposite magnetic polarity, but they were quite small and resulted only in some small flares, the strongest a C8 on 20 February.
It's always nice to have some material to compare a "fast" developing group to. Therefore, using NOAA-data, about 20 sunspot groups "born" on disk in 2011 or 2012 and reaching an area between 300 and 750MH were selected. Note that 1000 MH ("millionths of a solar hemisphere") correspond to about 3000 million square kilometers, or roughly 6 times the entire surface of the Earth.
The graphs underneath show the average evolution of the sunspot areas (grey) for each day following the first appearance of the sunspot group (= day 1). As can be seen, such sunspot groups reach their maximum area of about 300MH on day 6-7. The dashed lines indicate margins with respect to this average evolution, as some of the selected sunspot groups reach different maximum areas at different days.
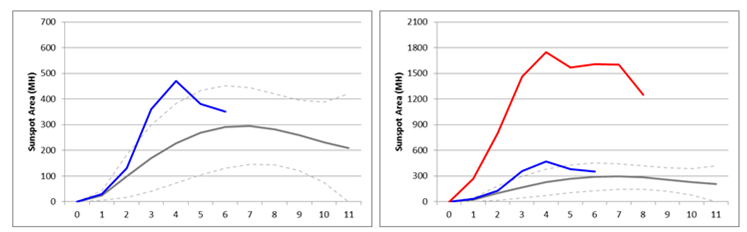
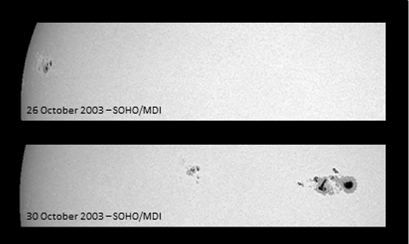
Compared to this average evolution, the rise of NOAA 1678 (blue) was indeed a bit faster than usual. However, there have been much faster rising sunspot groups in the past. A notorious case was NOAA 0488 (red in figure above), one of the Halloween groups that appeared late October 2003. As the images underneath show, it rose out of nothingness to a sunspot area 10 times that of the Earth in only 4 days. That's a really fast rise!
 |
 |
