
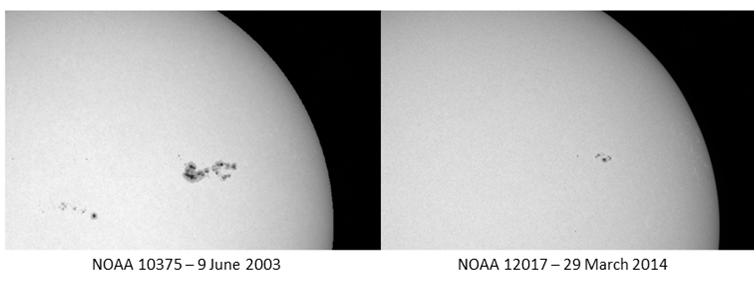
Usually, strong solar flares (X-class) are associated to big and complex sunspot groups, reaching maximum areas equivalent to 15 times the surface area of the Earth. That's why it was interesting to see that two recent X-class flares were produced in regions which were much smaller. Indeed, the X-class flares on 25 February and in particular on 29 March this year took place in sunspot regions that hardly reached an area similar to that of the Earth's surface (about 170MH, see Note 1).
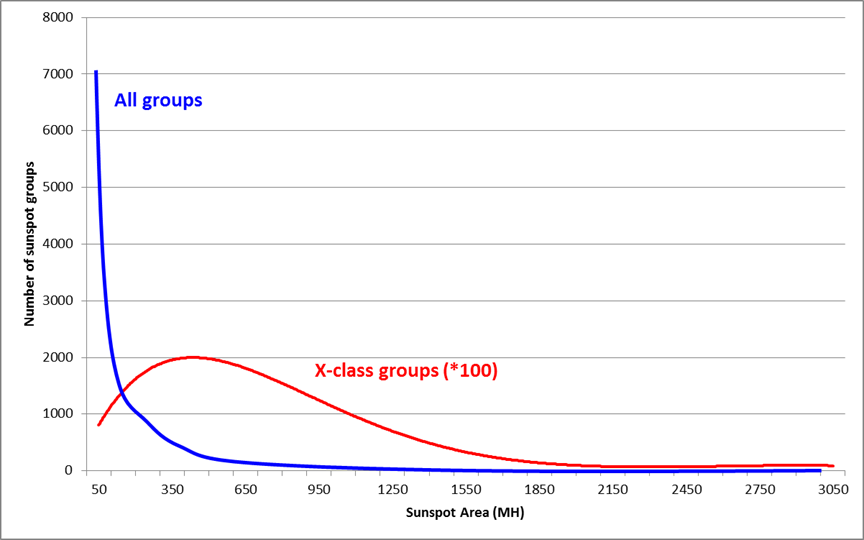
Since systematic GOES x-ray measurements began in 1976, more than 450 X-class flares have been recorded. These were produced by a bit more than 200 individual sunspot groups. According to the NOAA numbering, almost 11.000 sunspot groups were observed over those 38 years, so it is quite impressive that only 2% of the sunspot groups are responsible for all the eXtreme solar flares. Graph underneath shows per area bin (per 100MH) the smoothed number of sunspot groups (blue curve) as well as the smoothed number of groups producing an X-class flare (*100 for display purposes; red curve). Clearly, most of the X-class groups have a sunspot area several times that of the Earth.
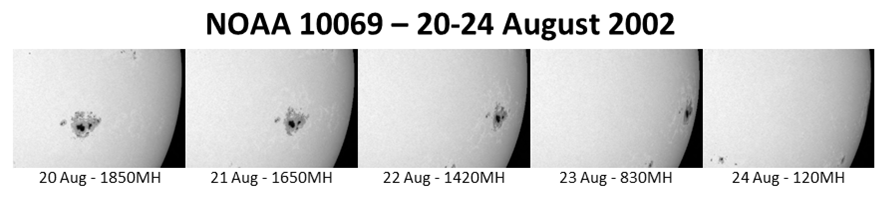
Nonetheless, about 10% of the X-class flares were produced in sunspot groups that had a surface area of 200MH or less. A quick review reveals that half of these are not really small, but have a sunspot area that actually does not reflect the true area. Indeed, when a large sunspot group is near the solar limb, it may take a day or more before it rotates completely in or out of view. If such a group happens to produce an X-class flare at that time, the associated sunspot area may seem very low. An example is big NOAA 10069 (imagery underneath), which produced an X3 flare while having nearly rounded the west limb early on 24 August 2002.
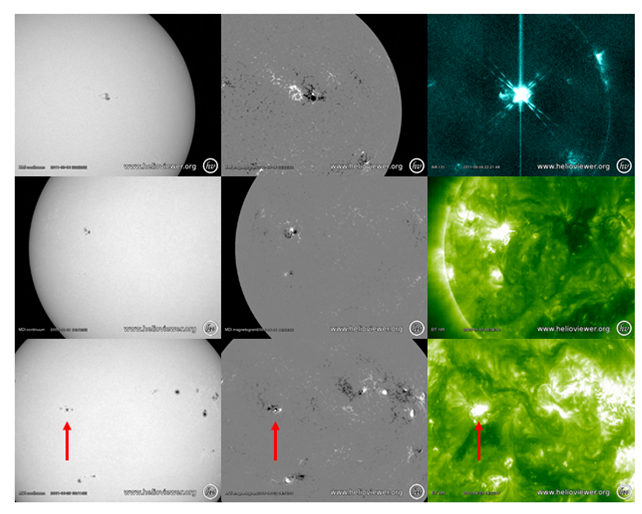
So, what’s so special about the remaining two dozen of X-class flare producing groups that have a small size but are located relatively far (more than 10 degrees) from the solar limb? As usual, taking a look at the magnetogram of the sunspot group reveals already a lot. Often, within the small group, spots of opposite magnetic polarity (black and white) can be seen very close to each other, often within the same penumbra. These "delta" spots (see this Newsletter) are known to be the source of strong flaring activity, so space weather forecasters keep an eye on them. A few examples from this and previous solar cycle can be found underneath: NOAA 11283 (6 September 2011; 200MH; top row), NOAA 10715 (1 January 2005; 180MH; middle) and NOAA 9511 (23 June 2001; 110 MH; bottom row).
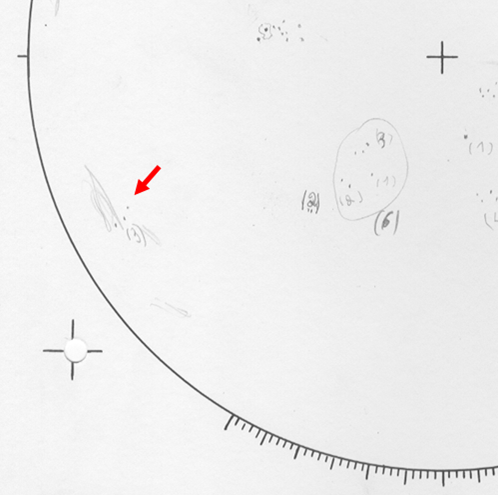
Note that delta spots do not explain all of the aberrant cases. Interaction with nearby sunspot groups, or when a group is in the growing/decaying phase of its life are just a few of the other possible reasons. One of the smallest groups that produced an X-class flare was NOAA 7012 on 26 January 1992. This isolated group measured hardly 10MH (ten!), consisting only of a few small sunspots (see annotated part of USET drawing underneath), and was visible for barely two days. Yet, it produced an X1-flare that was observed by the telescopes onboard the Yohkoh satellite in both x-ray and white light. In such flare events, there may be other physical processes at play.
Note 1 - The area of sunspot groups is expressed in "millionths of a solar hemisphere" (MH), with 1000MH corresponding to 3.043,7 million km2. The total area of the Earth corresponds to almost 170MH.
Credits - Images were taken from SDO, SOHO, USET, and (J)Helioviewer. USAF/NOAA sunspot data are available at NASA/MSFC, and x-ray flare data at NOAA/NGDC.
 |
 |
