- Table of Content
- 1.USET observes ...
- 2.Planes and spa...
- 3.Review of spac...
- 4.International ...
- 5.PROBA2 Observa...
- 6.Noticeable Sol...
- 7.Geomagnetic Ob...
- 8.The SIDC Space...
- 9.Events and Tra...
2. Planes and space weather
3. Review of space weather
4. International Sunspot Number by SILSO
5. PROBA2 Observations (11 May 2026 - 17 May 2026)
6. Noticeable Solar Events
7. Geomagnetic Observations in Belgium
8. The SIDC Space Weather Briefing
9. Events and Training courses
USET observes an X-class flare
An earlier STCE newsitem (https://www.stce.be/news/815/welcome.html ) reported on the two X-class flares on 24 April. As it turns out, the second one, an X2.5 flare peaking at 08:13 UTC, was observed with the H-alpha telescope of USET, the Uccle Solar Equatorial Table (https://www.sidc.be/uset/ ) of the Royal Observatory of Belgium. H-alpha is a prominent, dark absorption line in the red portion of the solar spectrum at a wavelength of 656.28 nm. It occurs because the cooler gas in the solar atmosphere (the chromosphere) absorbs light coming from the hotter layers below. The chromosphere is a thin, dynamic layer located just above the Sun's visible "surface" (the photosphere, or "sphere of light") but below the Sun's hot outer atmosphere, the corona. The word "chromosphere" has a Greek origin and basically translates as "sphere of colour". It was coined in 1868 by the English astronomer Lockyer to describe the distinctive, pinkish-red glowing ring that becomes briefly visible around the edge of the Sun during a total solar eclipse, when the Moon completely occults the Sun.
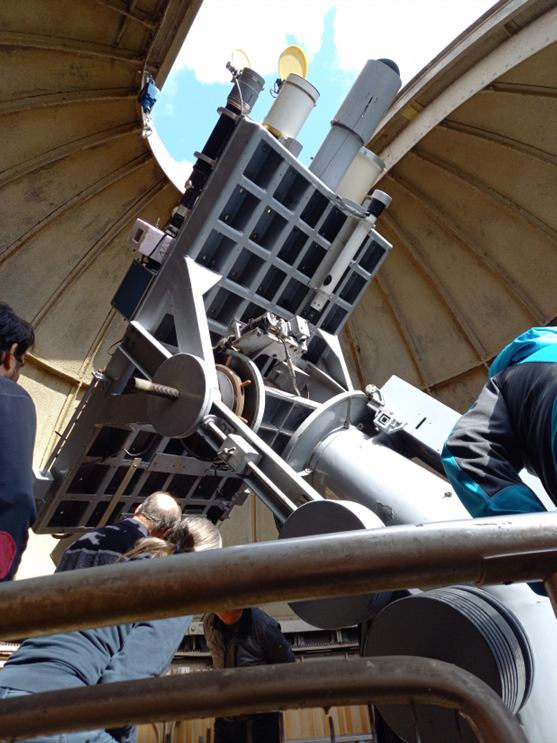
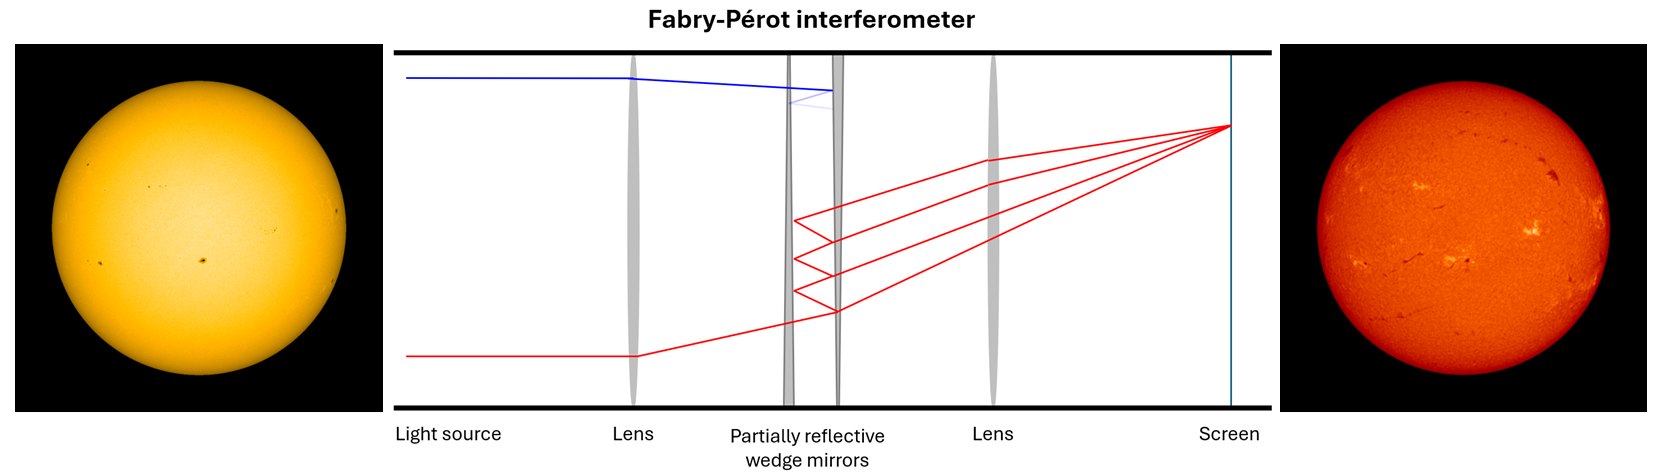
So, the chromosphere is usually not visible because it is outshone by the much brigher photosphere. As a result, special filters are required to observe the chromospheric features, such as prominences, filaments and solar flares. Indeed, the standard solar filters only reduce the total amount of light. To see the Sun in the narrow H-alpha line, astronomers use specialized "narrowband" filters (often with a bandpass of less than 0.1 nm) attached to the telescope to isolate this specific crimson glow. The USET H-alpha telescope has a diameter of 80 mm and is equipped with a Fabry-Pérot filter. This is an optical device consisting of two parallel, partially reflective mirrors separated by a tiny, specific distance - thus creating a kind of cavity. When light enters the cavity, it bounces back and forth between the mirrors. Through the process of constructive and destructive interference, only specific wavelengths of light (in this case the H-alpha line at 656.28 nm) will align perfectly to reinforce each other allowing them to pass through the filter. All other wavelengths will not get through. The USET H-alpha telescope has a bandpass of less than 0.05 nm, allowing the instrument to observe features both at the limb (prominences) and on the solar disk (filaments, solar flares). The image above shows the equatorial table with the H-alpha telescope on the left (black tube). The sketch beneath provides an idea what happens in a Fabry-Pérot etalon.
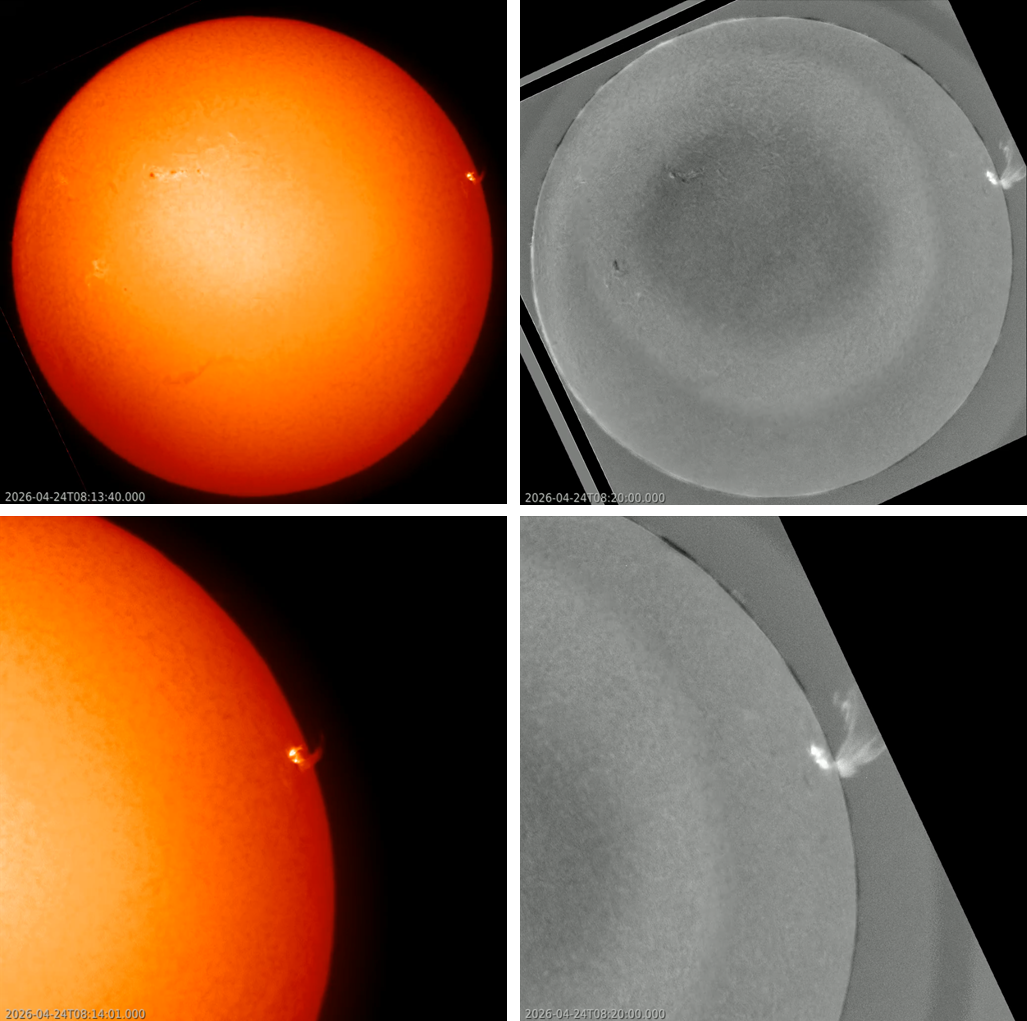
The imagery underneath shows the X2.5 flare in H-alpha as recorded by the dedicated USET telescope. The H-alpha instrument was recording in flare patrol mode, i.e. at a cadence of 4 images per second, of which only a portion has been selected (3 images per minute). Unfortunately, the seeing was particularly bad during the entire observation period (08:00 - 08:30 UTC), hence the images are not as crisp as they usually are. Nonetheless, the flare (on disk) and other eruption details (over the solar limb) are very well visible. The images to the right are difference images, where one image is subtracted from the next, to highlight more subtle details. In the difference movies, a faint wave can be seen moving to the north and east ("left") of the flare zone. This is called a Moreton wave. Moreton waves are large-scale disturbances observed in the solar chromosphere propagating with a typical speed ranging from approximately 500 to more than 1500 km/s. They can travel distances of up to one solar radius across the solar surface. These chromospheric Moreton waves correspond to the sweeping skirt of a fast shock propagating in the solar corona, thus representing the footprints of these coronal disturbances (or "coronal waves" - see this STCE newsitem at https://www.stce.be/news/241/welcome.html ). Otherwise said: the Moreton waves are the chromospheric counterpart of the coronal waves. These coronal waves correspond to the shock waves excited by coronal mass ejections (CMEs) rather than being generated directly by solar flares (Zhai et al. 2026 - https://doi.org/10.3847/2041-8213/ae5b9c ; Huang et al. 2025 - https://doi.org/10.3847/2041-8213/adf6ac ; Warmuth et al. 2004 - https://doi.org/10.1051/0004-6361:20034332). A clip of the associated coronal wave in extreme ultraviolet (SDO/AIA 193) as well as all other clips related to this newsitem can be found in the online version at https://www.stce.be/news/818/welcome.html
This newsitem was written with the kind collaboration of Dr Sabrina Bechet (ROB/SIDC/USET and SILSO).
Planes and space weather
May 15, 2024. The Earth is still in the violent aftermath of the Mother's day storm. Operators doing an HF radio exercise between Belgium and Canada can't get any signal through. What happened? Two types of solar storms raged on at the moment in the ionised top layer of the Earth's atmosphere and intercepted the radio waves.
Although the sun is some 150 million km away, these storms do sweep across the planet where we live, where more than ten thousand satellites orbit, planes fly from one side to the other side, where navigation systems show the way.
Eurocontrol, a pan-European, civil-military organisation dedicated to supporting European aviation, is well aware that space weather is a natural hazard impacting flight operations. Eurocontrol organised a workshop for airlines at the space pole in Belgium with the STCE as a partner to guide all participants through the extra-ordinary space weather landscape of science and services.

S. Green, an operational expert at Eurocontrol: 'It was a very intense - but equally very productive - couple of days with a steep learning curve.'
Yana Maneva, an STCE colleague continues: 'The space weather exercise was a very good way to get to know which of the warnings and info is meaningful for the people in aviation operations that have to work with the space weather data.'
This definitely will be continued.
Review of space weather
Solar Active Regions (ARs) and flares
Solar flaring activity was low to moderate, with forty-three C-class flares and five M-class flares observed. The strongest flare was an M5.7 flare (SIDC Flare 7671), peaking at 13:39 UTC on May 10, which was associated with the returning SIDC Sunspot Group 825 (NOAA Active Region 4436, magnetic type beta). There was a total of twelve active regions on the visible disk during the week. SIDC Sunspot Group 860 (NOAA Active Region 4432) was the most complex active region early in the week, with magnetic type beta-gamma, before rotating across the west limb. The remaining active regions were classified as magnetic type beta or alpha. No X-class flares were recorded during the week.
Coronal mass ejections
Several Coronal Mass Ejections (CMEs) were observed during the week. A partial halo Coronal Mass Ejection (SIDC CME 650) was observed in LASCO/C2 and C3 coronagraph imagery starting from around 13:48 UTC on May 10. The CME was associated with the M5.7 flare from the returning SIDC Sunspot Group 825 (NOAA Active Region 4436). While the bulk of the ejecta appeared to be directed eastward, analysis indicated a possible glancing blow arrival at Earth around May 13. A wide and fast Coronal Mass Ejection (SIDC CME 656) was observed in LASCO/C2 and C3 coronagraph imagery starting from around 16:36 UTC on May 16, directed mainly northwestward. The CME was associated with an M1.9 flare from SIDC Sunspot Group 825 (NOAA Active Region 4436). Although the bulk of the ejecta appeared to be directed mainly northwestward, Although the bulk of the ejecta appeared to be directed mainly northwestward, analysis indicated a glancing blow arrival at Earth around May 19. The other observed CMEs were mostly events near the west limb, or backsided events, and were not expected to impact Earth.
Coronal Holes
A small, positive-polarity coronal hole (SIDC Coronal Hole 159) crossed the central meridian early in the week. A high-speed stream may have arrived at Earth around May 13, possibly combined with the glancing blow arrival of SIDC CME 650. A large, negative-polarity transequatorial coronal hole (returning SIDC Coronal Hole 147) crossed the central meridian around May 13. The associated high-speed stream arrived at Earth late on May 15 and was responsible for enhanced solar wind conditions and increased geomagnetic activity during the second half of the week.
Proton flux levels
The greater than 10 MeV proton flux was below the 10 pfu threshold throughout the week.
Electron fluxes at GEO
The greater than 2 MeV electron flux as measured by GOES 18 and GOES 19 was mostly below the 1000 pfu threshold during the first part of the week and rose above the threshold from May 16 onward, following the arrival of the high-speed stream. The 24-hour electron fluence was initially at normal levels and reached moderate levels during the second part of the week.
Solar wind
The solar wind parameters (ACE) reflected mostly slow solar wind conditions at the beginning of the week. A first enhancement was observed around May 13, most likely associated with the glancing blow arrival of the Coronal Mass Ejection (SIDC CME 650) observed at 13:48 UTC on May 10, possibly combined with a high-speed stream influence from the small positive polarity coronal hole (SIDC Coronal Hole 159). A stronger enhancement followed later in the week due to the arrival of the high-speed stream from the large, negative polarity transequatorial coronal hole (returning SIDC Coronal Hole 147). Speed values increased up to around 810 km/s. The interplanetary magnetic field reached values up to about 17 nT, while the Bz component reached values down to about -14 nT. During the final part of the week, solar wind conditions remained enhanced but gradually started returning towards a slower solar wind regime under the waning influence of the high-speed stream.
Geomagnetism
Geomagnetic conditions globally were mostly at quiet to unsettled levels during the first part of the week. An interval of unsettled conditions was observed around May 13, likely related to the glancing blow arrival of SIDC CME 650, possibly combined with a high-speed stream influence from SIDC Coronal Hole 159. A stronger geomagnetic response was observed later in the week, following the arrival of the high-speed stream from the large, negative polarity transequatorial coronal hole (returning SIDC Coronal Hole 147). Global geomagnetic conditions reached moderate storm levels between 21:00 UTC on May 15 and 00:00 UTC on May 16, with NOAA Kp reaching 6+. Locally, several intervals of minor storm conditions were observed, with K BEL reaching 5. During the final part of the week, geomagnetic conditions gradually returned to mostly quiet levels globally and locally.
International Sunspot Number by SILSO

The daily Estimated International Sunspot Number (EISN, red curve with shaded error) derived by a simplified method from real-time data from the worldwide SILSO network. It extends the official Sunspot Number from the full processing of the preceding month (green line), a few days more than one solar rotation. The horizontal blue line shows the current monthly average. The yellow dots give the number of stations that provided valid data. Valid data are used to calculate the EISN. The triangle gives the number of stations providing data. When a triangle and a yellow dot coincide, it means that all the data is used to calculate the EISN of that day.
PROBA2 Observations (11 May 2026 - 17 May 2026)
Solar Activity
Solar flare activity fluctuated from low to moderate during the week.
In order to view the activity of this week in more detail, we suggest to go to the following website from which all the daily (normal and difference) movies can be accessed: https://proba2.oma.be/ssa
This page also lists the recorded flaring events.
A weekly overview movie (SWAP week 842) can be found here: https://proba2.sidc.be/swap/data/mpg/movies/weekly_movies/weekly_movie_2026_05_11.mp4.
Details about some of this week's events can be found further below.
If any of the linked movies are unavailable they can be found in the P2SC movie repository here: https://proba2.oma.be/swap/data/mpg/movies/.
Saturday May 16
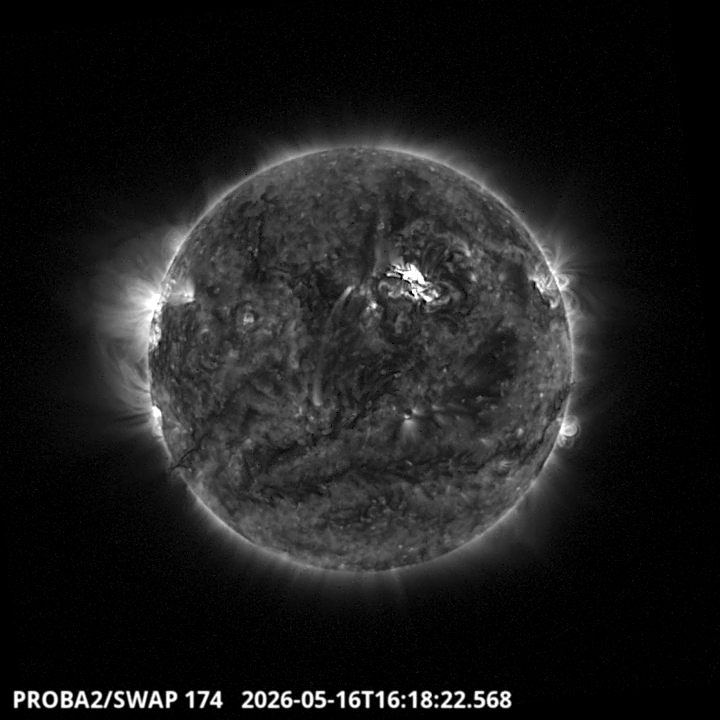
The largest flares of this week were two M1.9 on 2026-May-16, and they were observed by LYRA (top panel) and SWAP (bottom panel). The first M1.9 flare peaked at 16:12 UT (SWAP image) and occurred close to the central meridian in the northern hemisphere, originating from active region NOAA4436 (SIDC 825). The second one was much shorter and occurred from NOAA4435, which was just rotating behind the western limb.
Find a SWAP movie of the event here: https://proba2.sidc.be/swap/movies/20260516_swap_movie.mp4.
Noticeable Solar Events
| DAY | BEGIN | MAX | END | LOC | XRAY | OP | 10CM | TYPE | Cat | NOAA |
| 16 | 1550 | 1612 | 1622 | N20W16 | M1.9 | 2 | IV/2III/2 | 7 | 4436 | |
| 16 | 1622 | 1629 | 1634 | N20W16 | M1.3 | 2N | VI/1 | 7 | 4436 | |
| 16 | 1739 | 1742 | 1744 | N21W67 | M1.9 | S | 2 | 4435 | ||
| 17 | 0329 | 0339 | 0342 | M1.4 | 2 | 4435 |
| LOC: approximate heliographic location | TYPE: radio burst type |
| XRAY: X-ray flare class | Cat: Catania sunspot group number |
| OP: optical flare class | NOAA: NOAA active region number |
| 10CM: peak 10 cm radio flux |
Geomagnetic Observations in Belgium
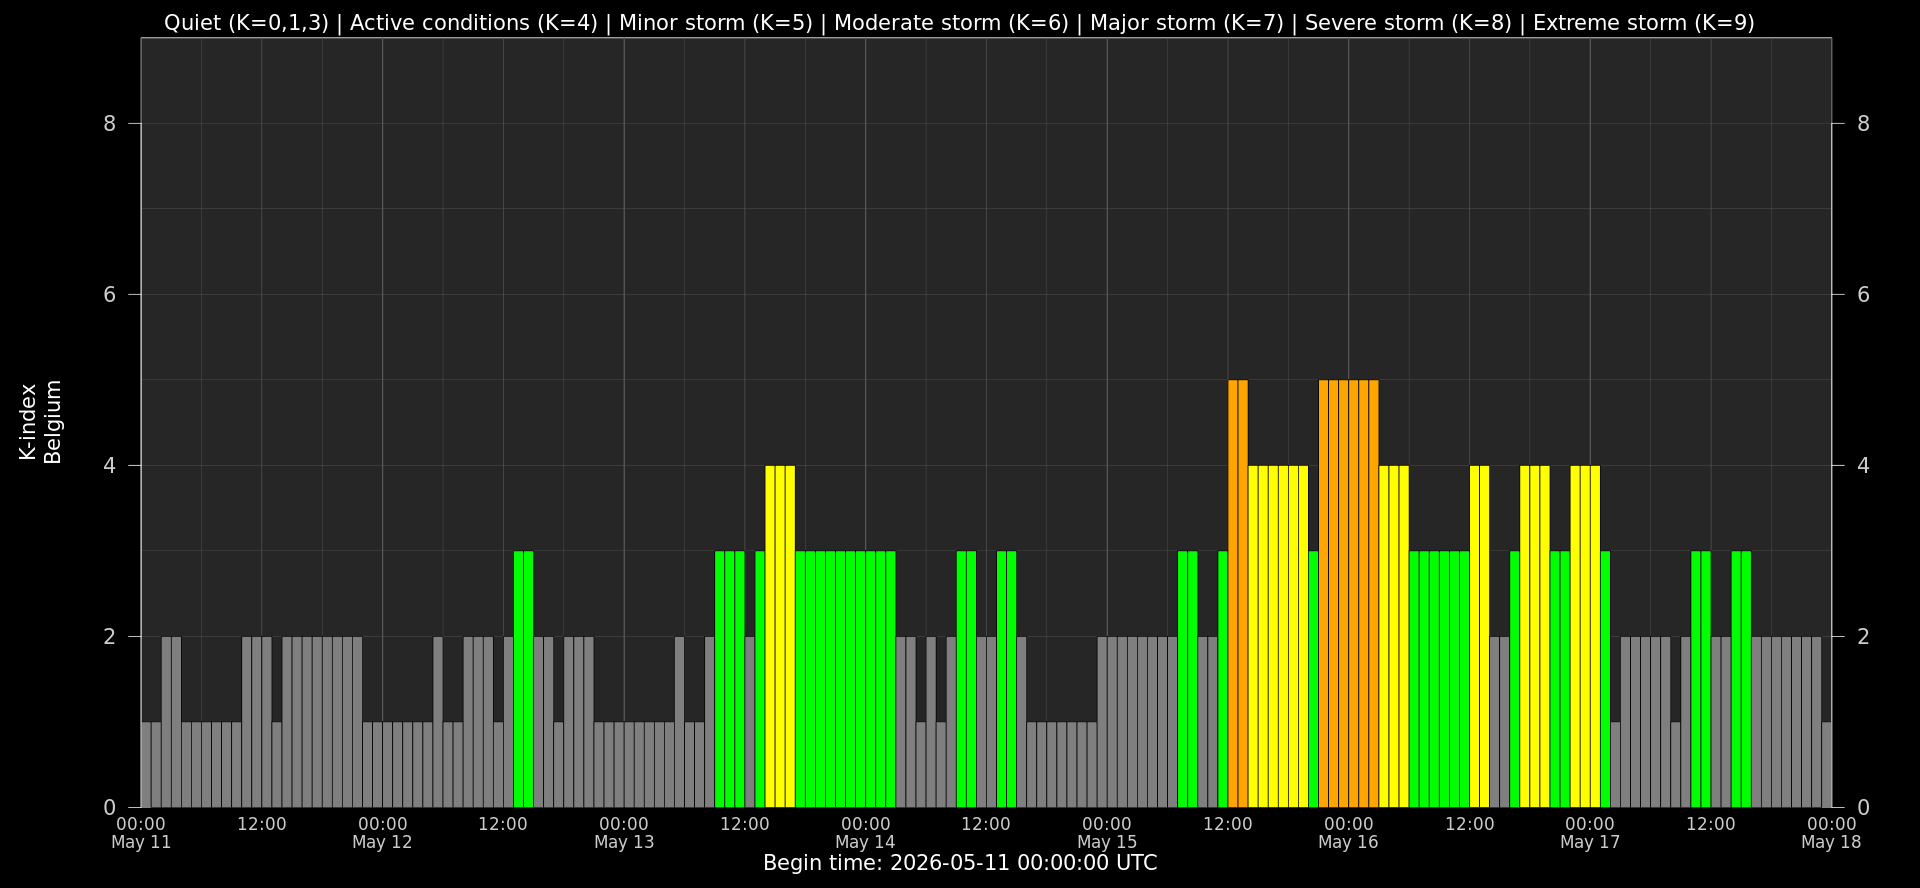
Local K-type magnetic activity index for Belgium based on data from Dourbes (DOU) and Manhay (MAB). Comparing the data from both measurement stations allows to reliably remove outliers from the magnetic data. At the same time the operational service availability is improved: whenever data from one observatory is not available, the single-station index obtained from the other can be used as a fallback system.
Both the two-station index and the single station indices are available here: http://ionosphere.meteo.be/geomagnetism/K_BEL/
The SIDC Space Weather Briefing
The forecaster on duty presented the SIDC briefing that gives an overview of space weather from May 11 to 17.
The pdf of the presentation: https://stce.be/briefings/20260518_SWbriefing.pdf
Events and Training courses
Courses, seminars and events with the Sun-Space-Earth system and Space Weather as the main theme. We provide occasions to get submerged in our world through educational, informative and instructive activities.
* May 22-25, 2026, STCE show at Nerdland- In the eye of a solar storm (Dutch)
* Jun 15-17, 2026, STCE Space Weather Introductory Course, Brussels, Belgium - register: https://events.spacepole.be/event/256/ - Fully booked
* Oct 12-14, 2026, STCE Space Weather Introductory Course, Brussels, Belgium - register: https://events.spacepole.be/event/257/ - Reserved
* Oct 29- Nov 1, 2026, Prior to ESWW2026 - Space Weather Training Course in Firenze, Italy - Apply: https://events.spacepole.be/event/278/
* Nov 2-6, 2026, European Space Weather Week, Florence, Italy, https://esww2026.eswan.eu/
* Nov 23-25, 2026, STCE course: Role of the ionosphere and space weather in military communications, Brussels, Belgium - register: https://events.spacepole.be/event/259/
* Dec 7-9, 2026, STCE Space Weather Introductory Course for Aviation, Brussels, Belgium - register: https://events.spacepole.be/event/262/
To register for a course and check the seminar details, navigate to the STCE Space Weather Education Center: https://www.stce.be/SWEC
If you want your event in the STCE newsletter, contact us: stce_coordination at stce.be
Website: https://www.stce.be/SWEC