
The Solar-Terrestrial Centre of Excellence (STCE) is a collaborative network of the Belgian Institute for Space Aeronomy, the Royal Observatory of Belgium and the Royal Meteorological Institute of Belgium.
|
Published by the STCE - this issue : 13 Dec 2013. The Solar-Terrestrial Centre of Excellence (STCE) is a collaborative network of the Belgian Institute for Space Aeronomy, the Royal Observatory of Belgium and the Royal Meteorological Institute of Belgium. |
| Archive of the newsletters | Subscribe to this newsletter by mail |
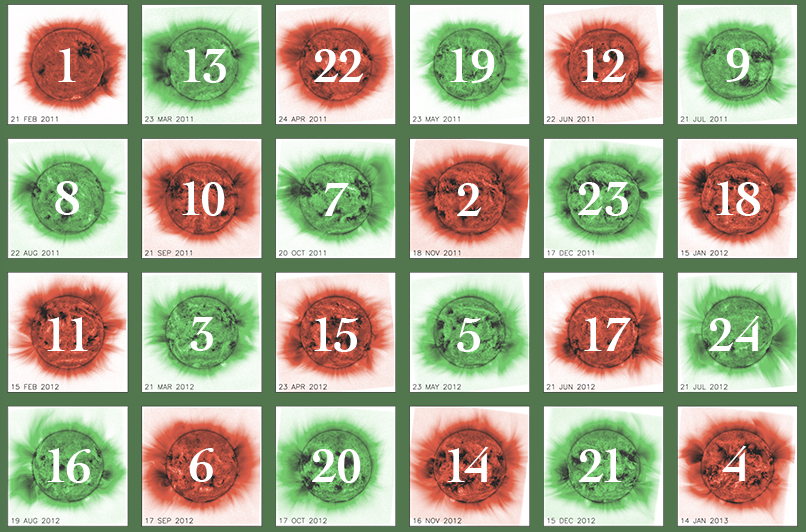
The PROBA2 team is proud to present the PROBA2 Holiday Countdown Calendar! One day at a time you will discover highlights of the PROBA2 satellite and the Sun!
The X-ray radiation increased gradually from December 2 to 5. On December 6, 7 and 8 the curve stayed at the bottom of the C-level with a M1.2-peak on December 7. C-flares were common practise during the whole week.
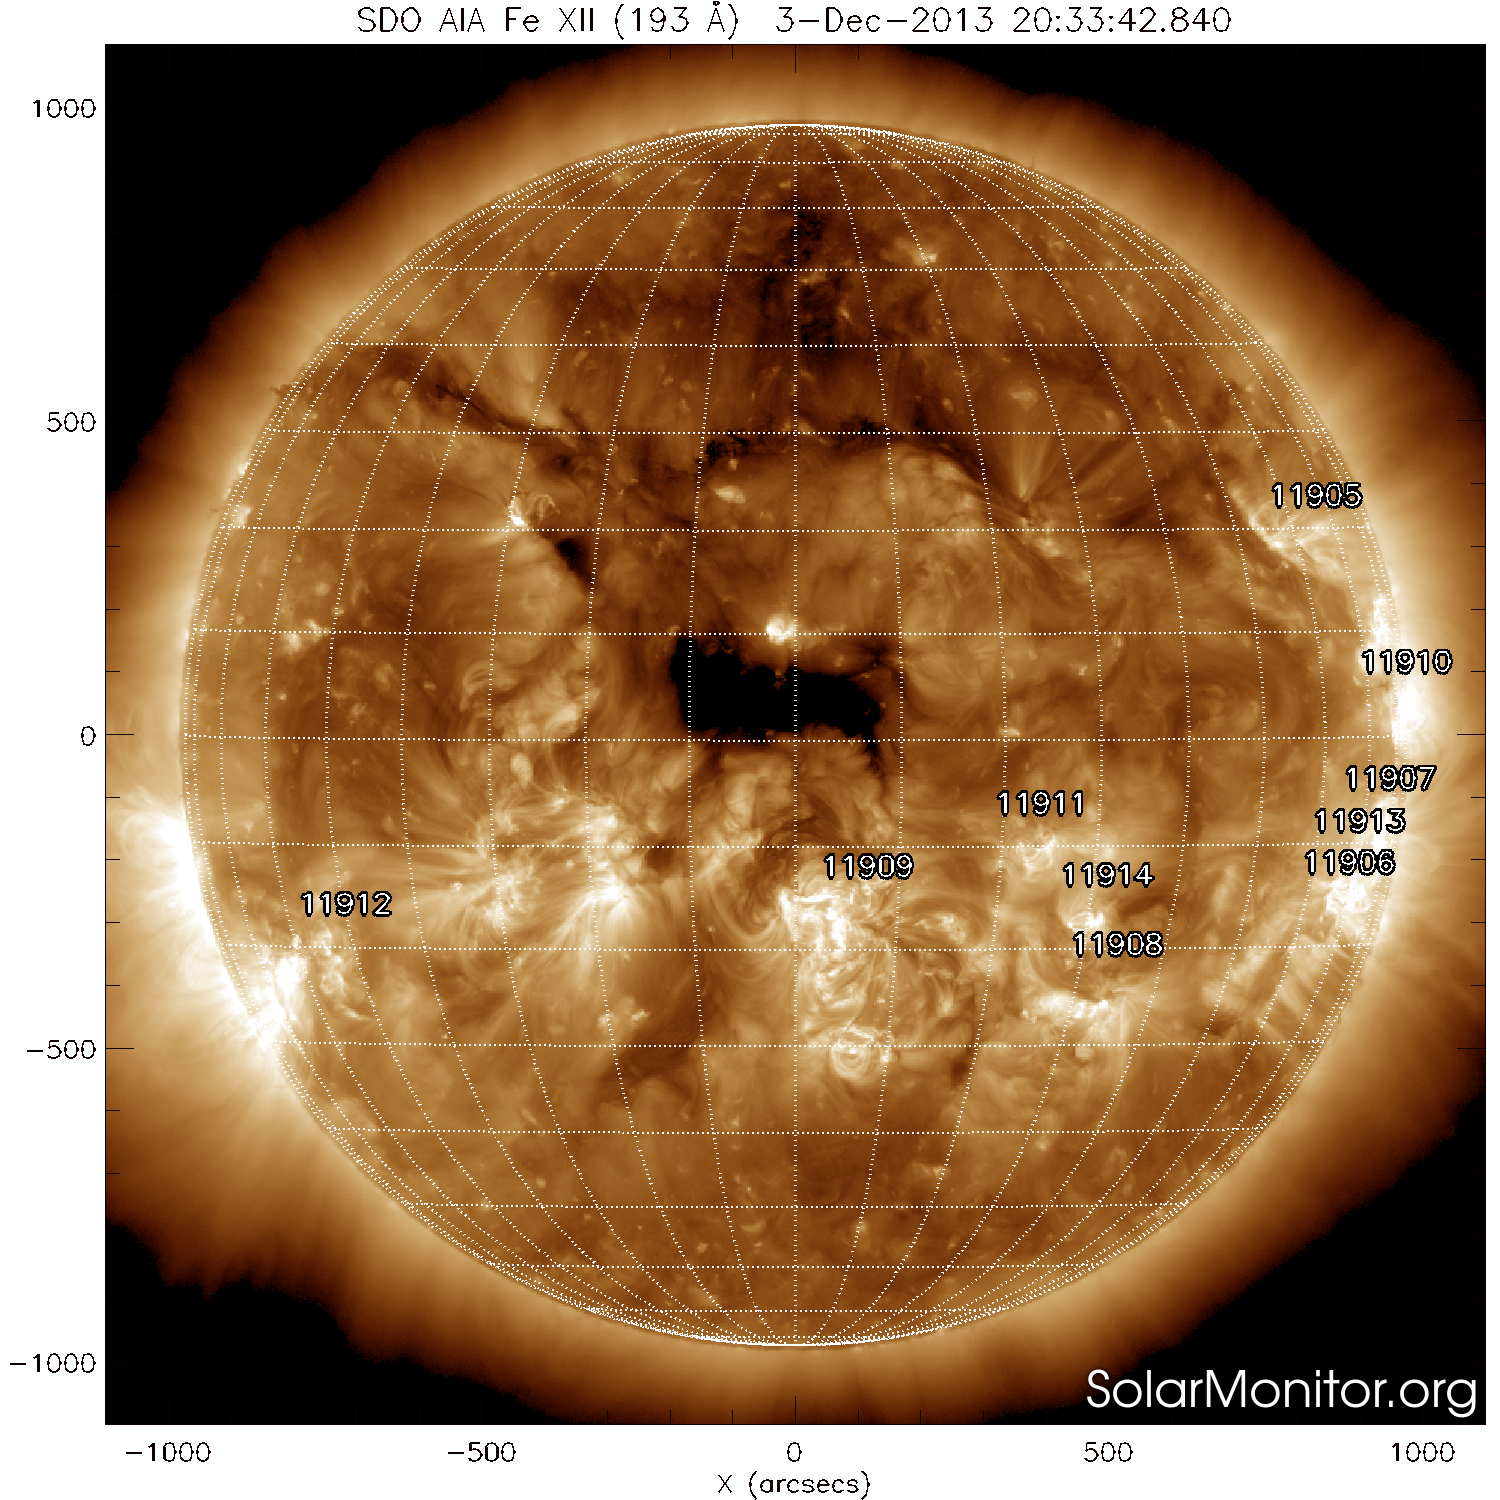
A filament in the neighbourhood of NOAA AR 1909 (S17W32) erupted on December 5 around 21 UT. LASCO/C2 data were not available and STEREO A/B were scarce.
The M-flare peaking at 7:29UT on December 7 was associated with a partial halo CME. The bulk of the plasma was ejected under the ecliptic plane.
A coronal hole just above the solar equator reached the central meridian on December 3. The coronal hole had a width of around 20°.
So much for the most violent eruptions or on disk structures which could have a space weather impact.
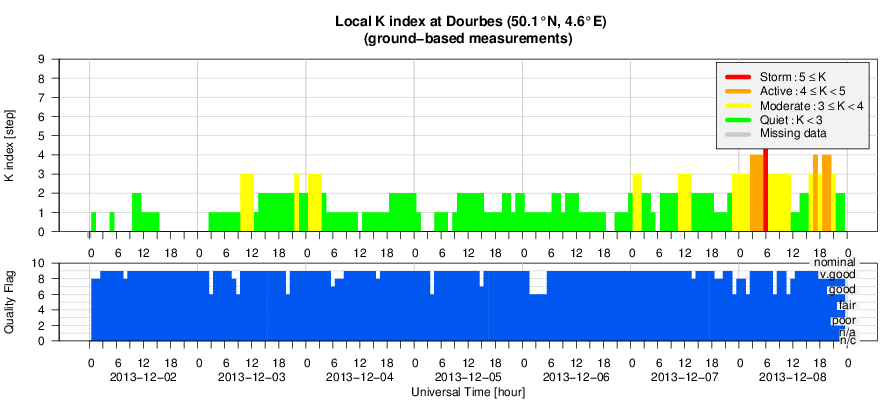
Late December 7, a co-rotating interaction region (CIR) arrived. The density and magnetic field strength increased gradually. The z-component of the magnetic field fluctuated strongly, even to -25nT which resulted in a planetary K of 6-5 and a local K Dourbes of 5-4 early December 8. As soon as the density decrease was set, the solar wind speed increased gradually. The CIR and fast solar wind were possibly linked with the coronal hole which reached the central meridian on December 3.
A shock was visible on ACE data on December 8, 7:30UT: the solar wind speed increased from 500 km/s to around 650 km/s, the temperature, density and magnetic field dropped as indicated with the red dotted line.
For the remaining days of the week, there was nothing special - geomagnetically speaking - to report. There was also no sign of the December 5 and 7 CME's in ACE data.
| DAY | BEGIN | MAX | END | LOC | XRAY | OP | 10CM | TYPE | Cat | NOAA |
| 07 | 0717 | 0729 | 0749 | S16W49 | M1.2 | 1N | 220 | III/2II/1 | 66 | 1909 |
| LOC: approximate heliographic location | TYPE: radio burst type |
| XRAY: X-ray flare class | Cat: Catania sunspot group number |
| OP: optical flare class | NOAA: NOAA active region number |
| 10CM: peak 10 cm radio flux |
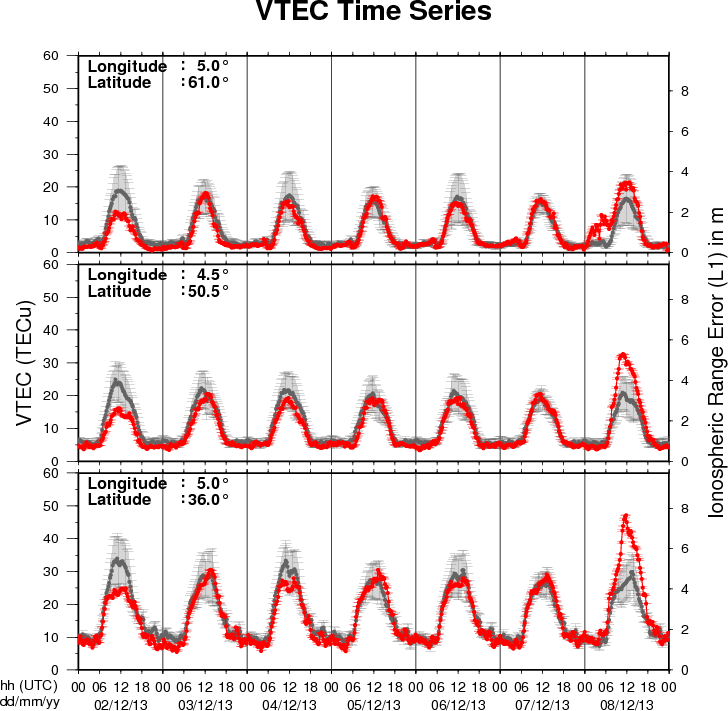
The figure shows the time evolution of the Vertical Total Electron Content (VTEC) (in red) during the last week at three locations:
a) in the northern part of Europe(N61°, 5°E)
b) above Brussels(N50.5°, 4.5°E)
c) in the southern part of Europe(N36°, 5°E)
This figure also shows (in grey) the normal ionospheric behaviour expected based on the median VTEC from the 15 previous days.
The VTEC is expressed in TECu (with TECu=10^16 electrons per square meter) and is directly related to the signal propagation delay due to the ionosphere (in figure: delay on GPS L1 frequency).
The Sun's radiation ionizes the Earth's upper atmosphere, the ionosphere, located from about 60km to 1000km above the Earth's surface.The ionization process in the ionosphere produces ions and free electrons. These electrons perturb the propagation of the GNSS (Global Navigation Satellite System) signals by inducing a so-called ionospheric delay.
See http://stce.be/newsletter/GNSS_final.pdf for some more explanations ; for detailed information, see http://gnss.be/ionosphere_tutorial.php
Solar flare activity fluctuated between low and moderate during the week.
In order to view the activity of this week in more detail, we suggest going to the following website from which all the daily (normal and difference) movies can be accessed: http://proba2.oma.be/ssa
This page also lists the recorded flaring events.
A weekly overview movie can be found here (SWAP week 193).
http://proba2.oma.be/swap/data/mpg/movies/WeeklyReportMovies/WR193_Dec02_Dec08/weekly_movie_2013_12_02.mp4
Details about some of this week’s events, can be found further below.
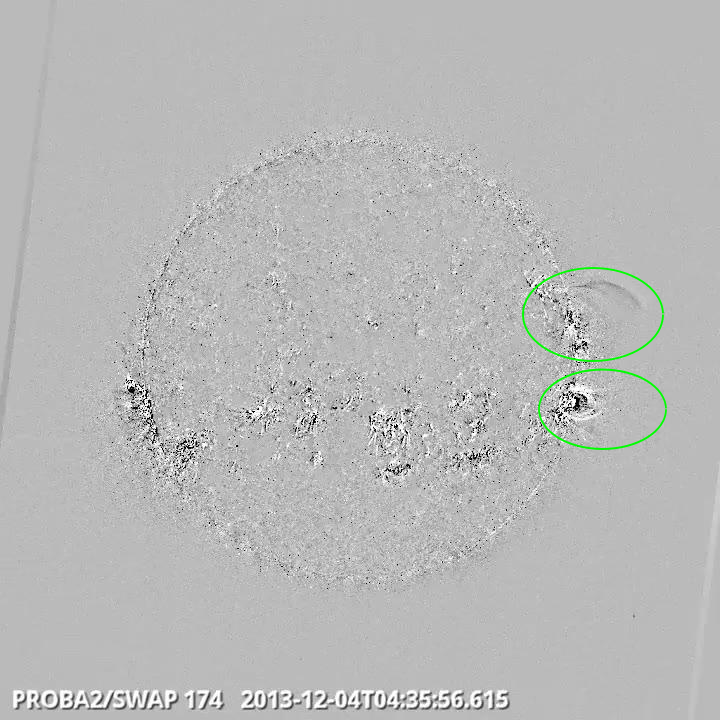
Pair of sympathetic eruptions on West Limb @ 04:35 - SWAP difference image
Find a movie of the events here (SWAP difference movie)
http://proba2.oma.be/swap/data/mpg/movies/WeeklyReportMovies/WR193_Dec02_Dec08/Events/20131204_Eruptions_WestLimb_0435_swap_diff.mp4
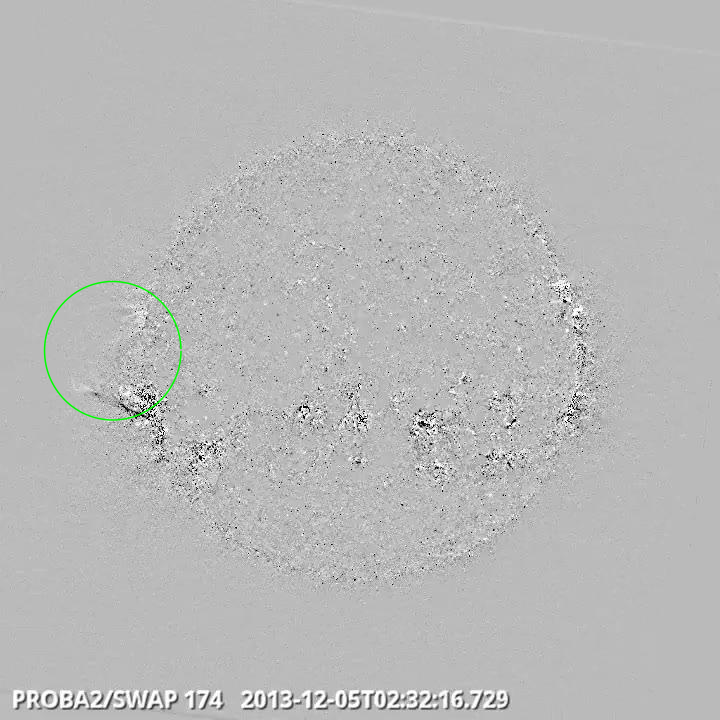
Eruption on the East Limb @ 02:32 - SWAP difference image
Find a movie of the event here (SWAP difference movie)
http://proba2.oma.be/swap/data/mpg/movies/WeeklyReportMovies/WR193_Dec02_Dec08/Events/20131205_Eruption_EastLimb_0232_swap_diff.mp4
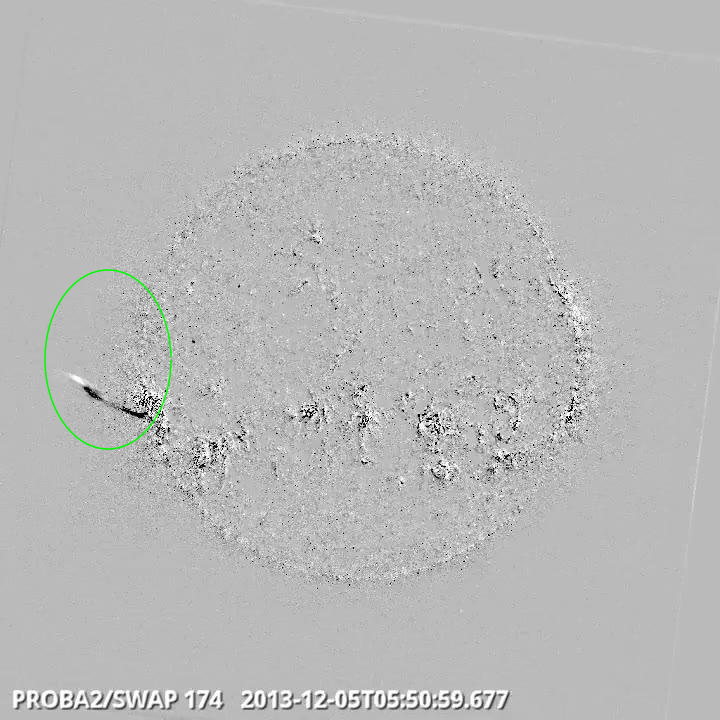
Jets on the East Limb @ 05:50 - SWAP difference image
Find a movie of the event here (SWAP difference movie)
http://proba2.oma.be/swap/data/mpg/movies/WeeklyReportMovies/WR193_Dec02_Dec08/Events/20131205_Jets_EastLimb_0550_swap_diff.mp4
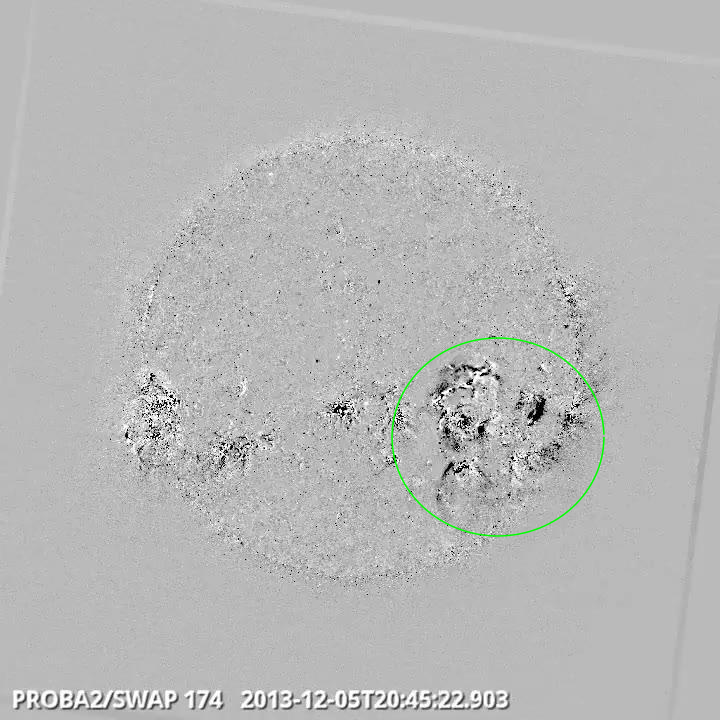
Eruption in the South-East Quadrant @ 20:45 - SWAP difference image
Find a movie of the event here (SWAP difference movie)
http://proba2.oma.be/swap/data/mpg/movies/WeeklyReportMovies/WR193_Dec02_Dec08/Events/20131205_Eruption_SouthWestQuad_2045_swap_diff.mp4
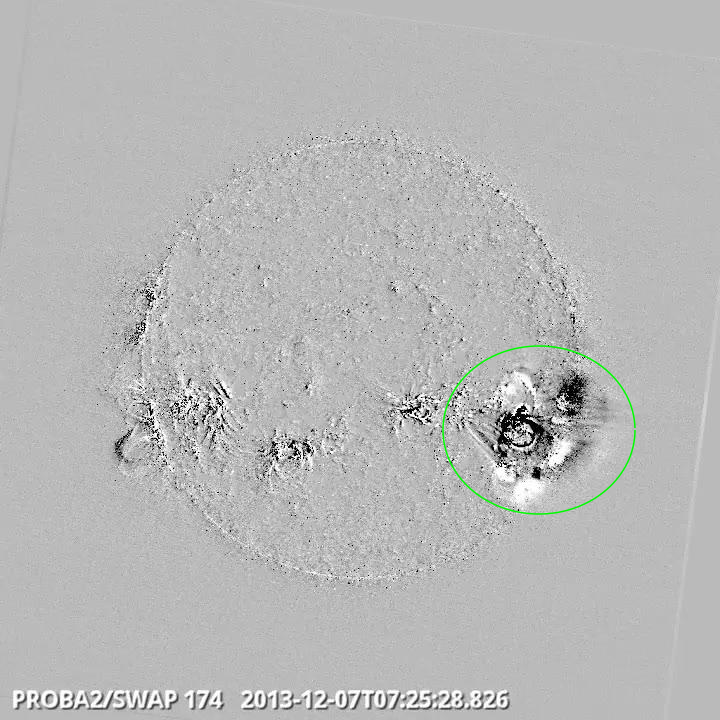
Eruption on the South East Quad @ 07:25 - SWAP difference image
Find a movie of the event here (SWAP difference movie)
http://proba2.oma.be/swap/data/mpg/movies/WeeklyReportMovies/WR193_Dec02_Dec08/Events/20131207_Eruption_SouthWestQuad_0725_swap_diff.mp4
Slides presented during the ESWW10 Splinter "Next Generation SPENVIS" on Tuesday November 19th, 2013, by Kruglanski Michel
The Space Environment Information System (SPENVIS, http://www.spenvis.oma.be/) is a ESA web-based interface for assessing the space environment and its effects on spacecraft systems and crews under continual development since 1996 and used by a worldwide community. This ESWW10 splinter meeting offered the opportunity to SPENVIS users and model developers to meet the SPENVIS development team and share their feedback and questions. Latest updates on the development of the new system (Next Generation SPENVIS) were reported.
http://www.spaceweather.eu/en/repository/show?id=484
http://www.spaceweather.eu/en/repository/show?id=485
CMEs and flares are transient phenomena with huge energy releases originating from the solar corona. We investigate and analyze the evolution of the X1.4-class flare/CME event of 22 September 2011 that produced a distinct system of flare loops. Viewed from Earth, the event was observed on the solar limb, enabling us to derive height-time curves of the evolving loops. For a continuous tracking of the loop system in high-temporal resolution EUV data using SDO/AIA data, we developed a method that automatically detects the height of the loop tops over a given reference point by analyzing the intensity profile perpendicular to the solar limb. With this method, we measure the height-time profiles of the loop system in the different wavelength channels over a time period of 12 hours after the flare onset. We identify characteristic features in the height-time curves which stem from a non-uniform growth of the flare loop system related to the ongoing magnetic reconnection process. We put special focus on the early phase of the event for which we compare the growth of the loop system with the kinematics of the associated CME and aim to connect the physics behind the rapid growth of the loop system with changes in the kinematical behavior of the CME or enhanced soft X-ray flux.
http://www.spaceweather.eu/en/repository/show?id=486
Start : 2014-04-27 - End : 2014-05-02
The EGU General Assembly 2014 will bring together geoscientists
from all over the world to one meeting covering all disciplines of
the Earth, planetary and space sciences. The EGU aims to provide a
forum where scientists, especially early career researchers, can
present their work and discuss their ideas with experts in all
fields of geosciences.