
The Solar-Terrestrial Centre of Excellence (STCE) is a collaborative network of the Belgian Institute for Space Aeronomy, the Royal Observatory of Belgium and the Royal Meteorological Institute of Belgium.
|
Published by the STCE - this issue : 19 Dec 2013. The Solar-Terrestrial Centre of Excellence (STCE) is a collaborative network of the Belgian Institute for Space Aeronomy, the Royal Observatory of Belgium and the Royal Meteorological Institute of Belgium. |
| Archive of the newsletters | Subscribe to this newsletter by mail |
On December 8 and 13, something particularly interesting happened in the solar wind: ACE in situ solar wind data showed a shock and both times the shock was driven by a coronal hole. Shocks driven by a coronal mass ejection are common. But this was shocking news.
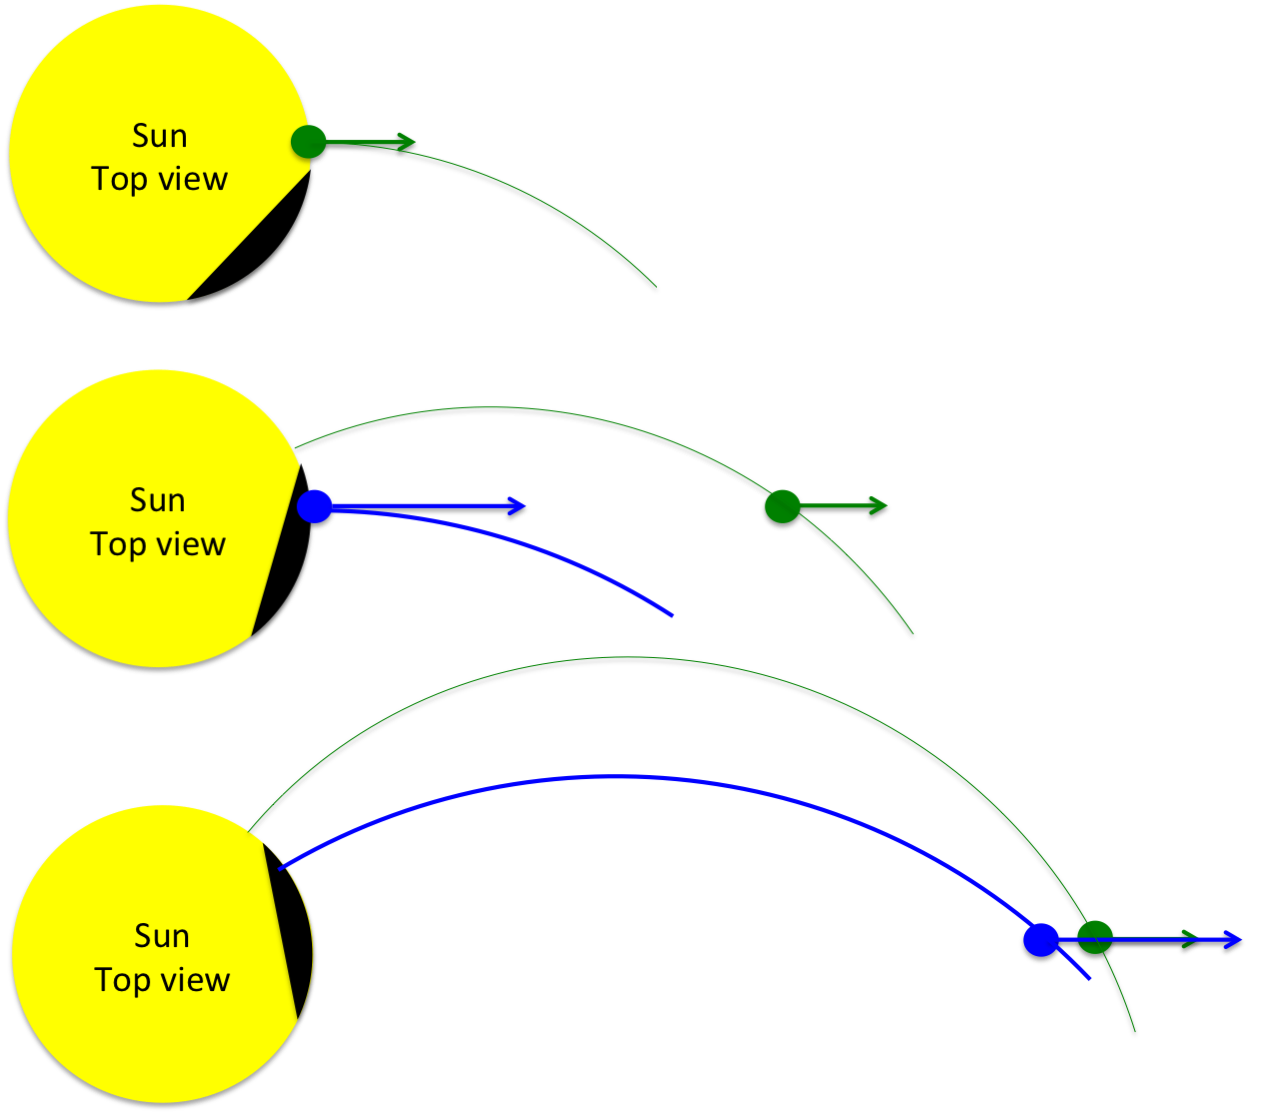
The solar wind flowing from a coronal hole is boosted in speed. In the cartoon you see a fast blue solar plasma particle from a coronal hole (black structure) catching up with the slow green solar plasma particles that left the Sun earlier. The Sun rotates and as such the coronal hole turns with the Sun. The green and blue line represent the magnetic tentacles of the Sun that even reach the boundary of the heliosphere. The green line is more curved because it is linked with a slower solar wind, while the blue line is slightly more radial because of a faster solar wind.
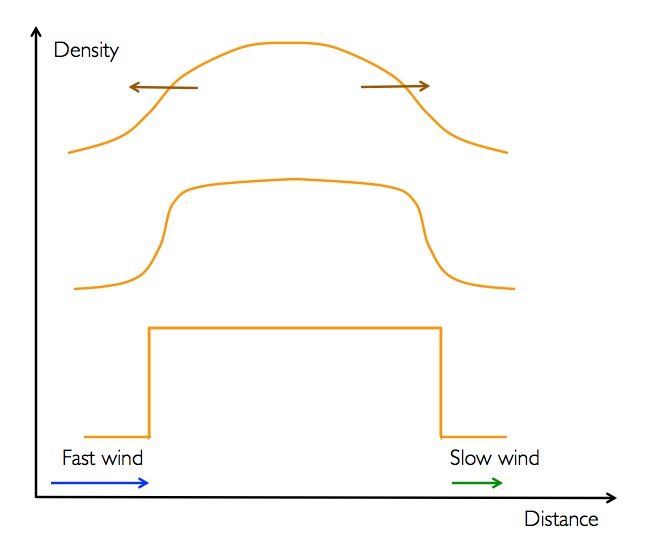
The density profile of the interaction region (co-rotating interaction region, CIR) looks like a hill that moves away from the Sun. In front of the hill, you have a slow wind while a fast wind is trailing. Nature tries to expand the dense structure to get rid of the density hill and put a flat landscape in place. By moving the front flank to the right and the behind flank to the left, the density curve is stretched and flattened; and both flanks will be steepened to finally result in a crude passage from low/high to high/low density which mathematicians like to call a step function and solar physicians have a mouth full of a shock.
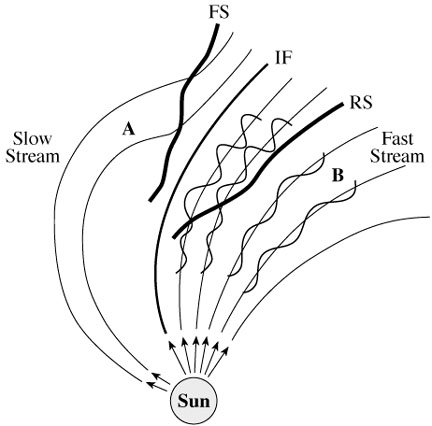
Forward and Reversed Shocks are usually formed well behind Earth which is at 1AU. So, the reversed shock on December 8 and the forward shock on December13 recorded by ACE were exceptional.

Solar flare activity stayed low during the week.
In order to view the activity of this week in more detail, we suggest to go to the following website from which all the daily (normal and difference) movies can be accessed: http://proba2.oma.be/ssa
This page also lists the recorded flaring events.
A weekly overview movie can be found here (SWAP week 194).
http://proba2.oma.be/swap/data/mpg/movies/WeeklyReportMovies/WR194_Dec09_Dec15/weekly_movie_2013_12_09.mp4
Details about some of this week's events, can be found further below.
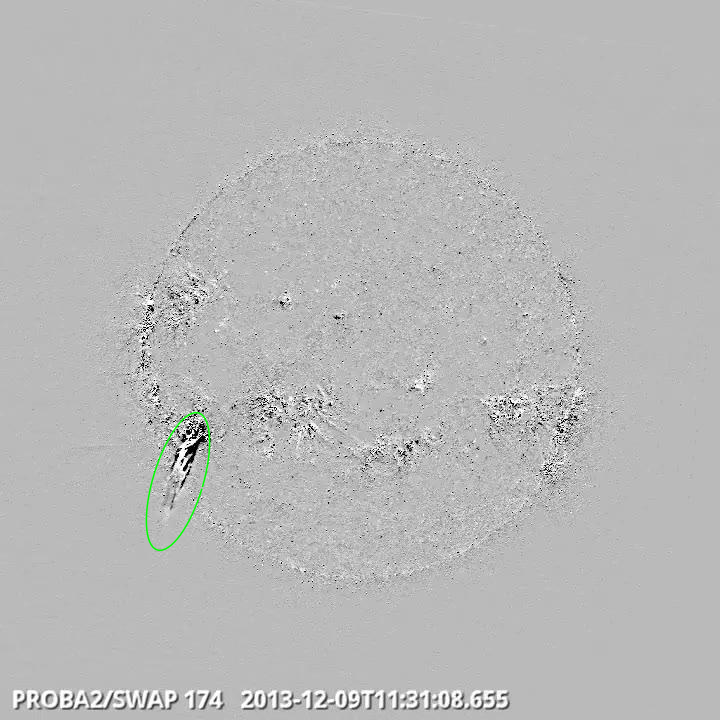
Outflow in South East Quadrant @ 11:31 - SWAP difference image
Find a movie of the events here (SWAP difference movie)
http://proba2.oma.be/swap/data/mpg/movies/WeeklyReportMovies/WR194_Dec09_Dec15/Events/20131209_Eruption_SoutEastQuad_1131_swap_diff.mp4
Find a movie of the events here (SWAP movie)
http://proba2.oma.be/swap/data/mpg/movies/WeeklyReportMovies/WR194_Dec09_Dec15/Events/20131209_Eruption_SoutEastQuad_1131_swap_movie.mp4
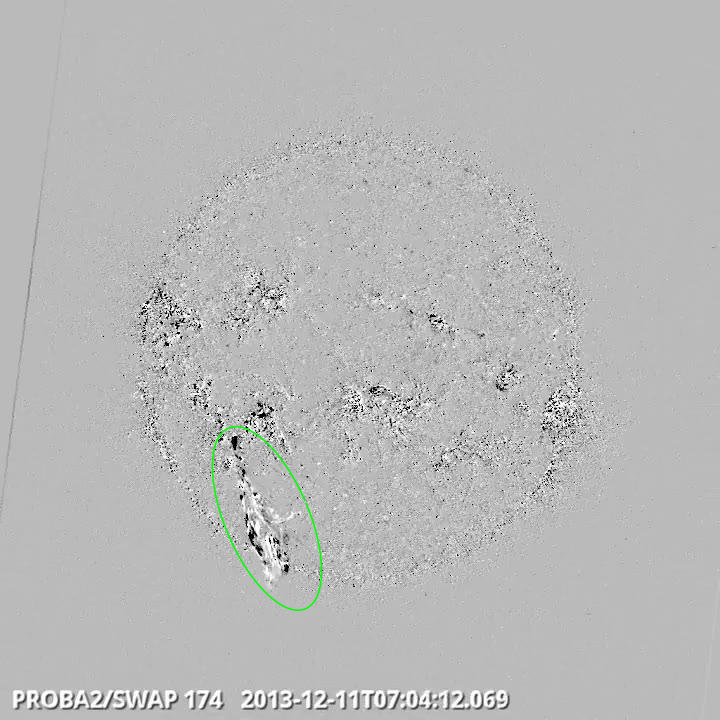
Eruption on South East Quad @ 07:04 - SWAP difference image
Find a movie of the event here (SWAP difference movie)
http://proba2.oma.be/swap/data/mpg/movies/WeeklyReportMovies/WR194_Dec09_Dec15/Events/20131211_Eruption_SouthEastQuad_0704_swap_diff.mp4
Find a movie of the event here (SWAP movie)
http://proba2.oma.be/swap/data/mpg/movies/WeeklyReportMovies/WR194_Dec09_Dec15/Events/20131211_Eruption_SouthEastQuad_0704_swap_movie.mp4
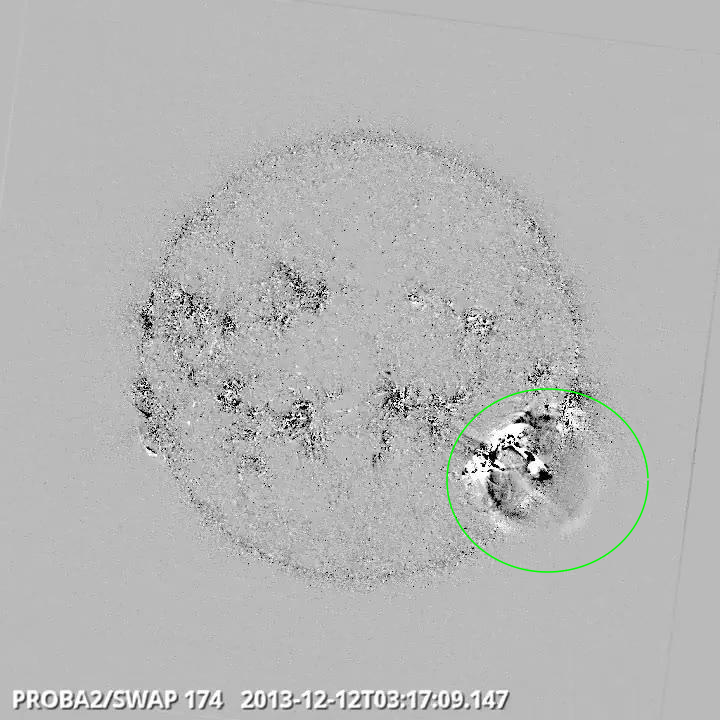
Eruption on South West Quad @ 03:17 - SWAP difference image
Find a movie of the event here (SWAP difference movie)
http://proba2.oma.be/swap/data/mpg/movies/WeeklyReportMovies/WR194_Dec09_Dec15/Events/20131212_Eruption_SouthWestQuad_0317_swap_diff.mp4
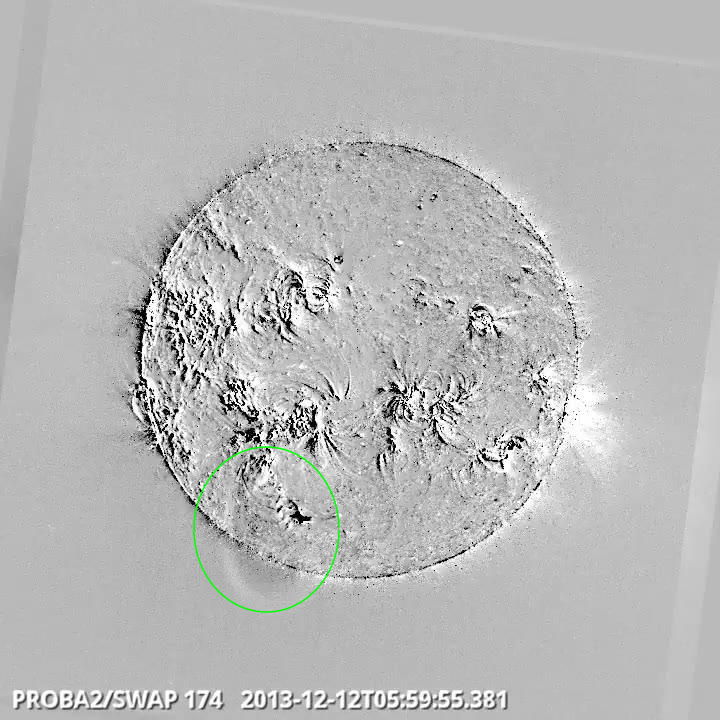
Eruption on South East Quad @ 05:59 - SWAP difference image
Find a movie of the event here (SWAP difference movie)
http://proba2.oma.be/swap/data/mpg/movies/WeeklyReportMovies/WR194_Dec09_Dec15/Events/20131212_Eruption_SouthEastQuad_0559_swap_diff.jpg.png
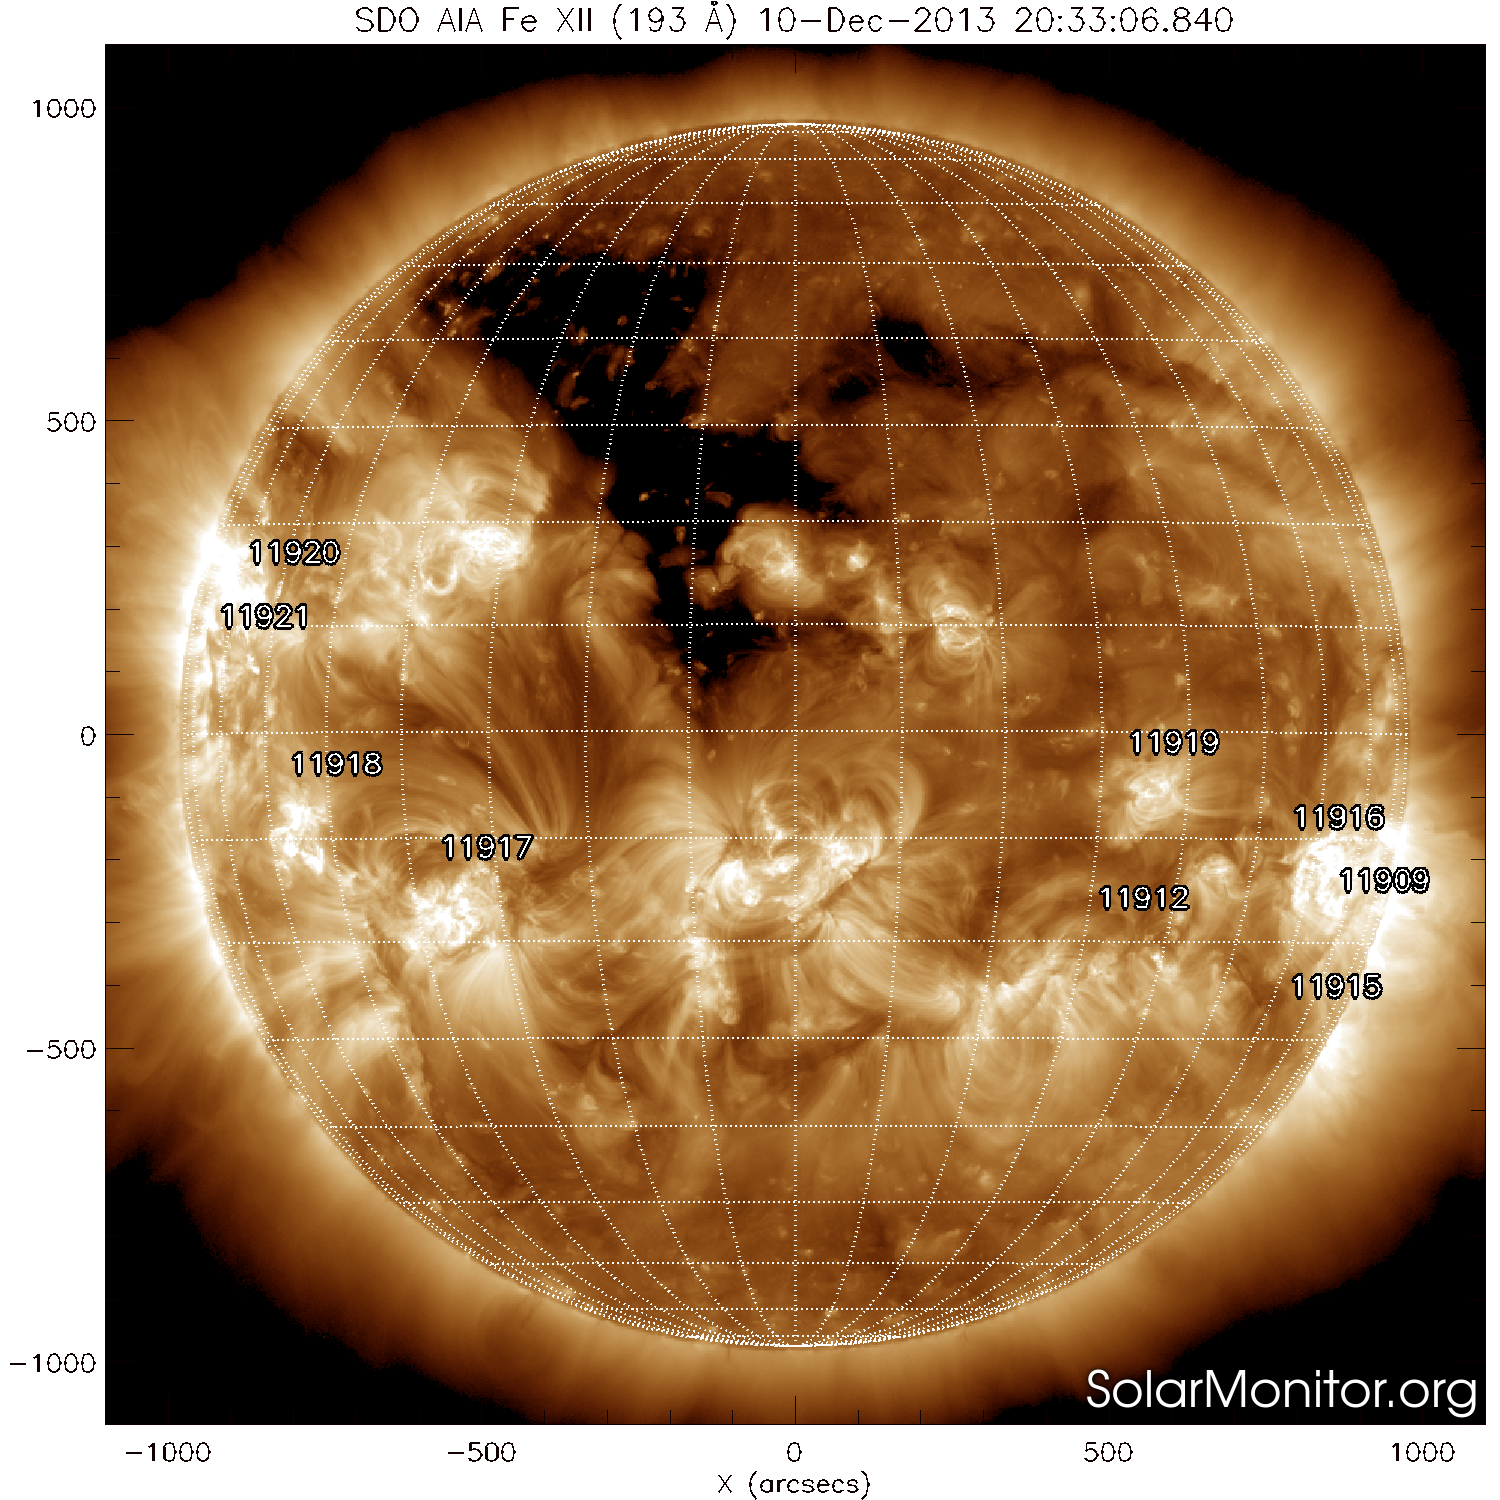
We had a variety of active regions that pushed the X-ray background radiation to the upper B level. It was NOAA AR 1917 that dominated the C-flaring scenery by being present the whole week.
December 12, late 13 and 14 were CME top days.
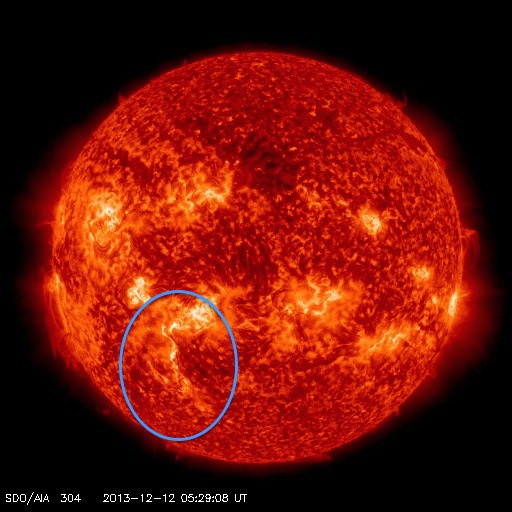
NOAA AR 1912 released a long duration C4.6 flare peaking at 03:36UT on December 12. The filament in its neighbourhood became unstable and erupted. The south-west directed CME came into the LASCO/C2 field of view at 3:36UT. The speed was estimated to be around 1000 km/s by the soho-halo-alerts.
There was a slight proton flux increase on December 14 and 15. The cause of this increase is unclear. It might be an eastern hemisphere event produced by an eruption in a far side active region linked with a plasma eruption early December 14. It might be linked with the co-rotating interaction region induced shock - see tab geomagnetic activity.
On December 10, a recurrent northern coronal hole dominating the solar SDO/AIA images reached the central meridian. It was very likely to become geoeffective and it did (see tab geomagnetic activity).
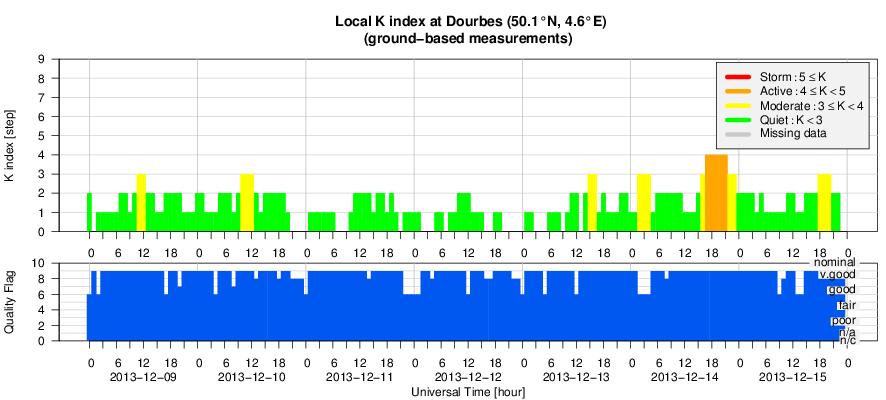
If there was something happening in the geomagnetic field of the Earth, it was on December 13, 14 and 15: a shock driven by a co-rotating interaction region (CIR) and an ICME without a preceding shock. Shocking, isn't it?
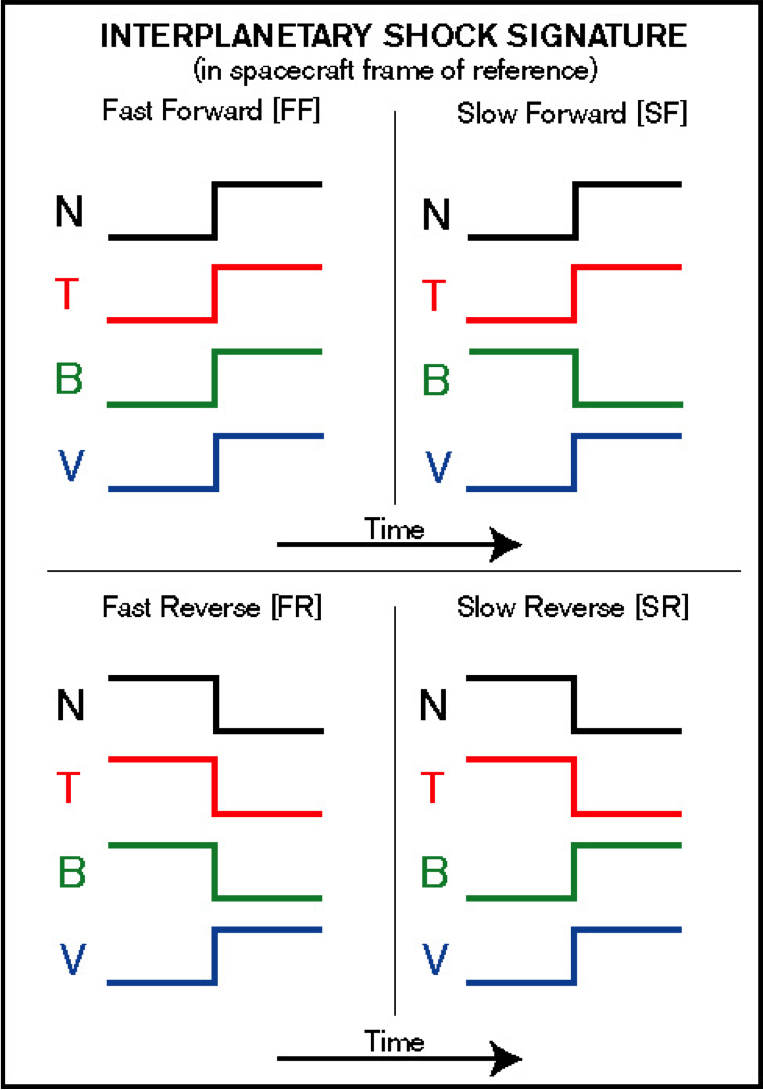
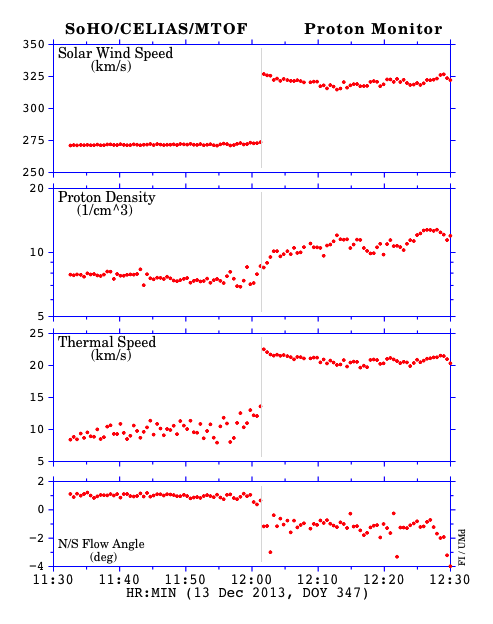
A forward shock was seen in ACE solar wind data on December 13 around 12UT: temperature, density and magnetic field increased, the speed increased from around 270 km/s to 330 km/s.
On December 15, between 16UT and 17UT, a few solar wind parameters suddenly jumped to a lower/higher value: the magnetic field increased, while the temperature and density dropped. The magnetic field strength had a smooth profile indicating that ACE passed through a flank of an interplanetary CME (ICME).
As the CME travels further in space, ACE located at 1AU (Astronomical Unit) 'sees' that part of the CME along the path of the red line in the cartoon.
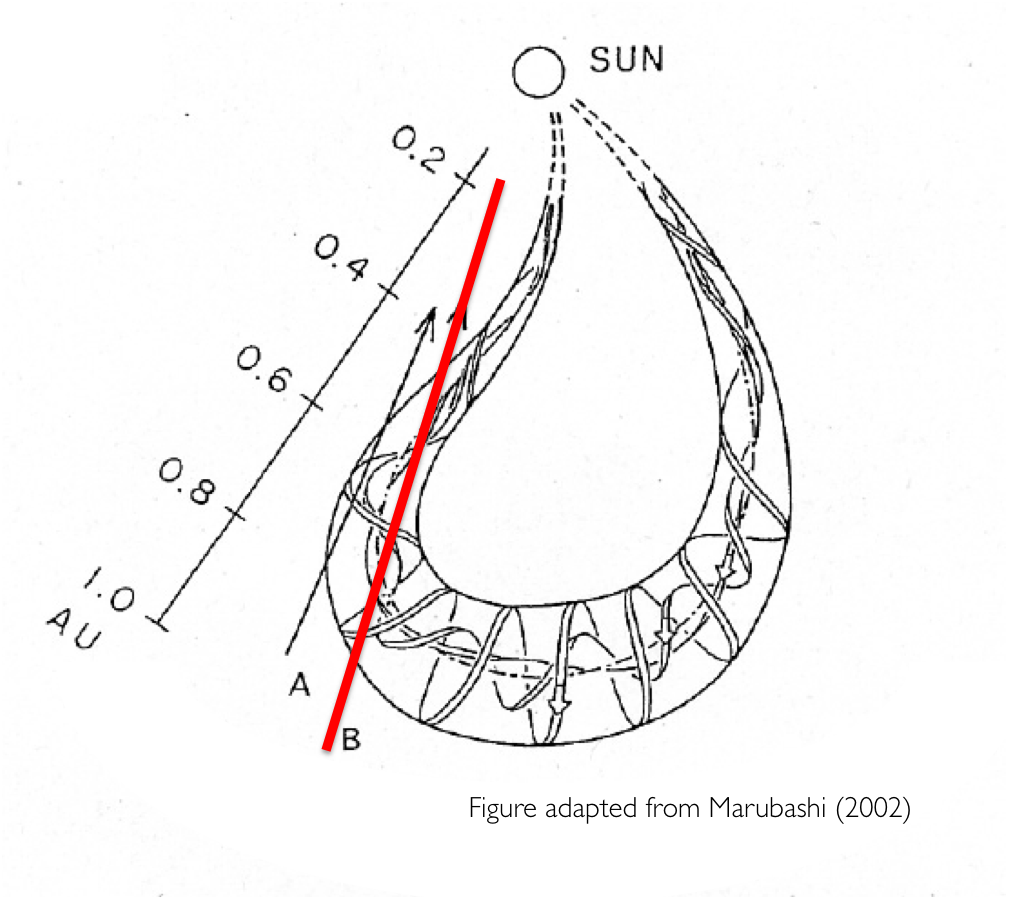
It is a speed difference between plasmas that causes shocks to be formed. In this case, there was no preceding shock formed because the solar wind and the CME had comparable speeds of around 500 km/s.
It takes plasma travelling at a speed of 500 km/s a little more than 3 days to bridge the distance between the Sun and the Earth. Counting back 3 days, we arrive at December 12: the day that 2 partial halo CME's left the Sun's surface. The time of occurrence is an argument to link the ICME with the first CME (3:36UT), the position of the filament on the solar disk is an argument to link the ICME with the south-west CME of 6:24UT.

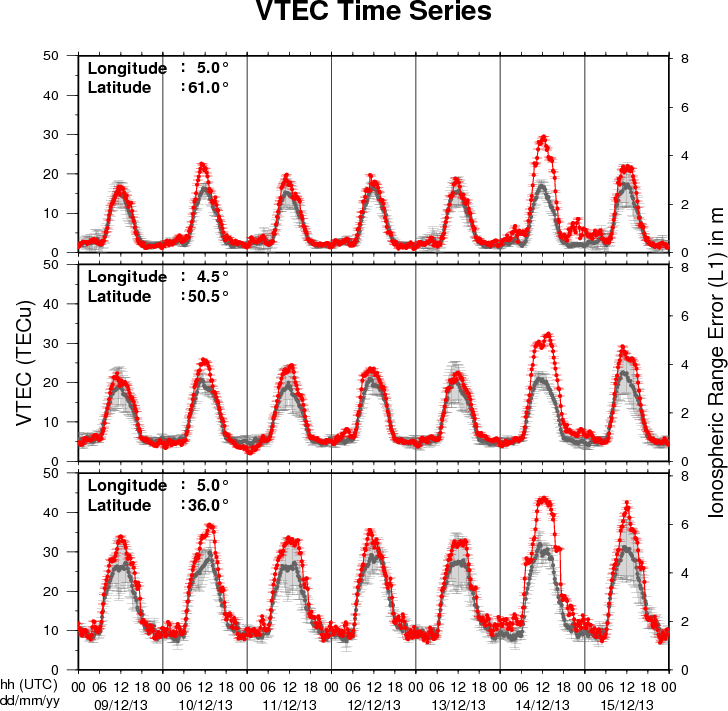
The figure shows the time evolution of the Vertical Total Electron Content (VTEC) (in red) during the last week at three locations:
a) in the northern part of Europe(N61°, 5°E)
b) above Brussels(N50.5°, 4.5°E)
c) in the southern part of Europe(N36°, 5°E)
This figure also shows (in grey) the normal ionospheric behaviour expected based on the median VTEC from the 15 previous days.
The VTEC is expressed in TECu (with TECu=10^16 electrons per square meter) and is directly related to the signal propagation delay due to the ionosphere (in figure: delay on GPS L1 frequency).
The Sun's radiation ionizes the Earth's upper atmosphere, the ionosphere, located from about 60km to 1000km above the Earth's surface.The ionization process in the ionosphere produces ions and free electrons. These electrons perturb the propagation of the GNSS (Global Navigation Satellite System) signals by inducing a so-called ionospheric delay.
See http://stce.be/newsletter/GNSS_final.pdf for some more explanations ; for detailed information, see http://gnss.be/ionosphere_tutorial.php
Start : 2014-04-27 - End : 2014-05-02
The EGU General Assembly 2014 will bring together geoscientists
from all over the world to one meeting covering all disciplines of
the Earth, planetary and space sciences. The EGU aims to provide a
forum where scientists, especially early career researchers, can
present their work and discuss their ideas with experts in all
fields of geosciences.
Slides presented during the ESWW10 Splinter "Next Generation SPENVIS" on Tuesday November 19th, 2013, by Kruglanski Michel
The Space Environment Information System (SPENVIS, http://www.spenvis.oma.be/) is a ESA web-based interface for assessing the space environment and its effects on spacecraft systems and crews under continual development since 1996 and used by a worldwide community. This ESWW10 splinter meeting offered the opportunity to SPENVIS users and model developers to meet the SPENVIS development team and share their feedback and questions. Latest updates on the development of the new system (Next Generation SPENVIS) were reported.
http://www.spaceweather.eu/en/repository/show?id=484
http://www.spaceweather.eu/en/repository/show?id=485
CMEs and flares are transient phenomena with huge energy releases originating from the solar corona. We investigate and analyze the evolution of the X1.4-class flare/CME event of 22 September 2011 that produced a distinct system of flare loops. Viewed from Earth, the event was observed on the solar limb, enabling us to derive height-time curves of the evolving loops. For a continuous tracking of the loop system in high-temporal resolution EUV data using SDO/AIA data, we developed a method that automatically detects the height of the loop tops over a given reference point by analyzing the intensity profile perpendicular to the solar limb. With this method, we measure the height-time profiles of the loop system in the different wavelength channels over a time period of 12 hours after the flare onset. We identify characteristic features in the height-time curves which stem from a non-uniform growth of the flare loop system related to the ongoing magnetic reconnection process. We put special focus on the early phase of the event for which we compare the growth of the loop system with the kinematics of the associated CME and aim to connect the physics behind the rapid growth of the loop system with changes in the kinematical behavior of the CME or enhanced soft X-ray flux.
http://www.spaceweather.eu/en/repository/show?id=486