
The Solar-Terrestrial Centre of Excellence (STCE) is a collaborative network of the Belgian Institute for Space Aeronomy, the Royal Observatory of Belgium and the Royal Meteorological Institute of Belgium.
|
Published by the STCE - this issue : 2 Jan 2014. The Solar-Terrestrial Centre of Excellence (STCE) is a collaborative network of the Belgian Institute for Space Aeronomy, the Royal Observatory of Belgium and the Royal Meteorological Institute of Belgium. |
| Archive of the newsletters | Subscribe to this newsletter by mail |
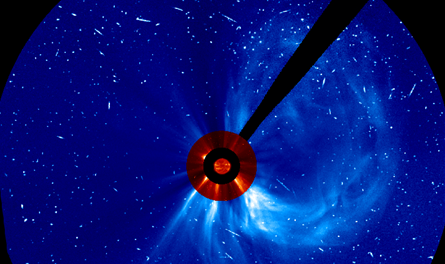
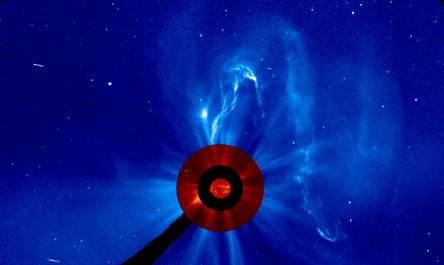
During 2013, long stretches of solar inactivity alternated with brief spurts of high flaring activity levels. The periods of solar calm featured numerous filament and prominence eruptions, with so many spectacular events they could easily fill this review. There were 12 X-class solar flares, almost as many as 2011 and 2012 combined. Yet, only 5 sunspot regions were responsible for these extreme explosions on the Sun, and most of them took place during the latter part of 2013.
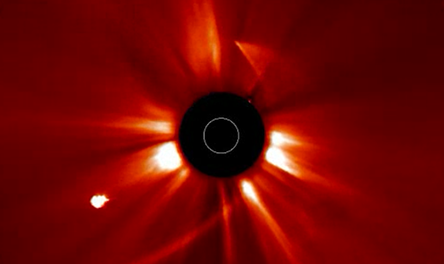
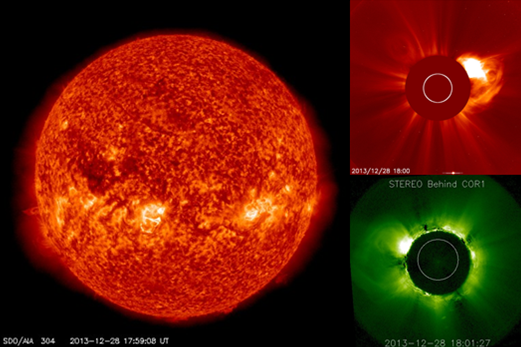
Underneath a selection of the most impressive solar events that spiced up the past year. Using Helioviewer (http://www.helioviewer.org/ ) and JHelioviewer, a movie at http://www.youtube.com/watch?v=nsoRNeeHVL8 was created containing one or more clips of each event. Usually, SDO-images (http://sdo.gsfc.nasa.gov/ ) were used, occasionally supplemented with imagery from STEREO (http://stereo.gsfc.nasa.gov/ ), PROBA2 (http://proba2.oma.be/ssa ), SOHO (http://sohowww.nascom.nasa.gov/ ), GOES/SXI (http://www.swpc.noaa.gov/sxi/ ), and the GONG H-alpha Network (http://halpha.nso.edu/ ).
Well aware this selection gives only a glimpse on what 2013 had to offer, we do hope this review provides a good idea of the evolving activity of ongoing solar cycle 24. More details on the discussed highlights can be found in the archive of news items on the STCE website (http://www.stce.be/ ).
Happy reading, and the best wishes for a spectacular New Year!
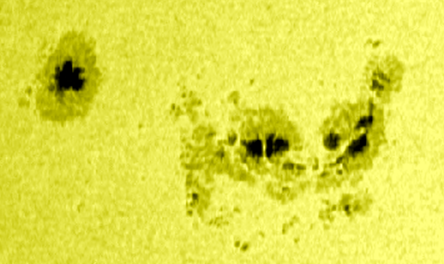
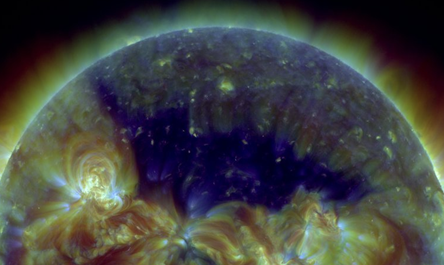
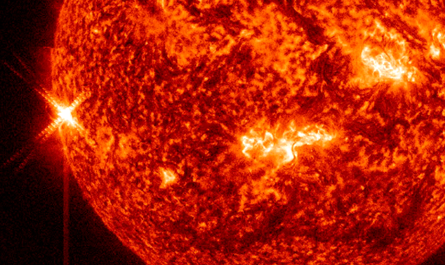
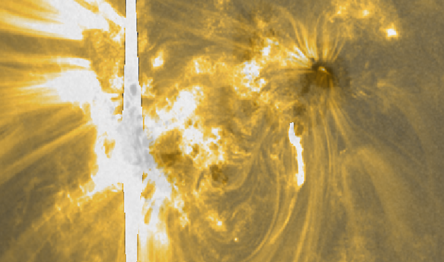
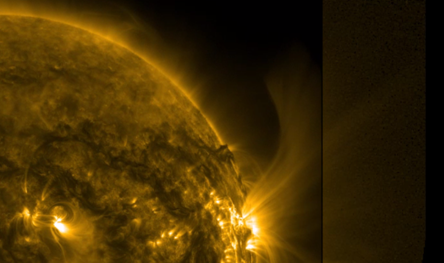
Solar activity was high during the week of December 23 to 29, 2013. In total, 2 M flares and 51 C flares were observed. On December 23 and 24, the large majority of the flares (including the first M-flare) were produced by beta-gamma active region (AR) NOAA 11928 near the west limb. Beta-gamma regions NOAA 11934 and 11936 started releasing several C flares as well from December 25 onwards.
Following substantial flux emergence in AR NOAA 11934 and especially NOAA 11936, the daily number of flares increased in the days afterwards, with NOAA 11936 producing an M3 flare on December 29.
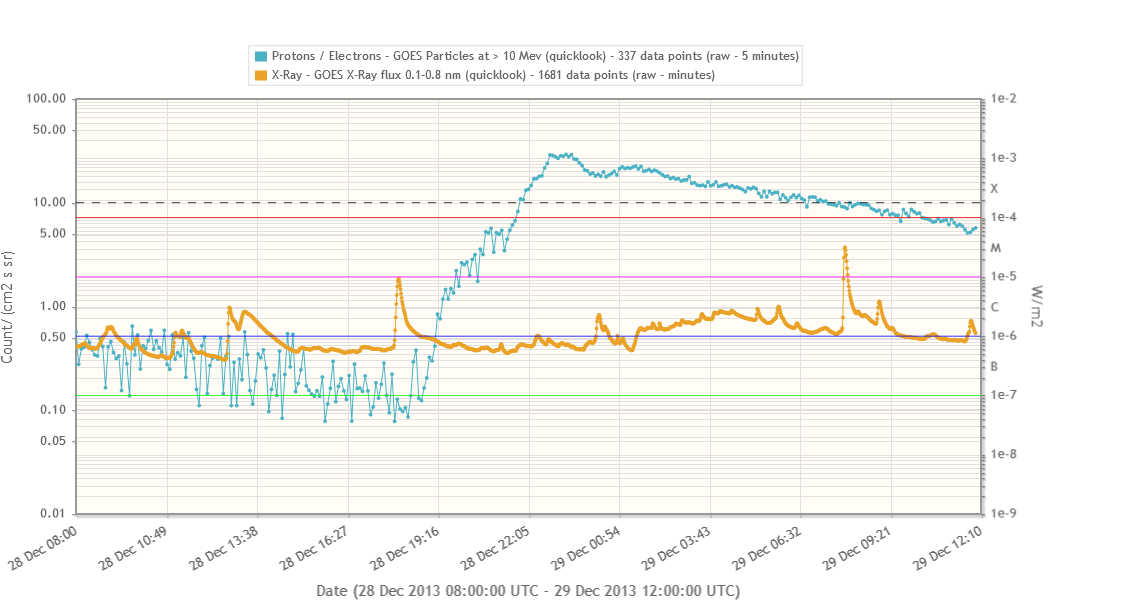
| DAY | BEGIN | MAX | END | LOC | XRAY | OP | 10CM | TYPE | Cat | NOAA |
| 23 | 0859 | 0906 | 0909 | S18W64 | M1.6 | 1N | 87 | 1928 | ||
| 29 | 0749 | 0756 | 0800 | S18E1 | M3.1 | 1N | 110 | V/2III/2 | 1936 |
| LOC: approximate heliographic location | TYPE: radio burst type |
| XRAY: X-ray flare class | Cat: Catania sunspot group number |
| OP: optical flare class | NOAA: NOAA active region number |
| 10CM: peak 10 cm radio flux |
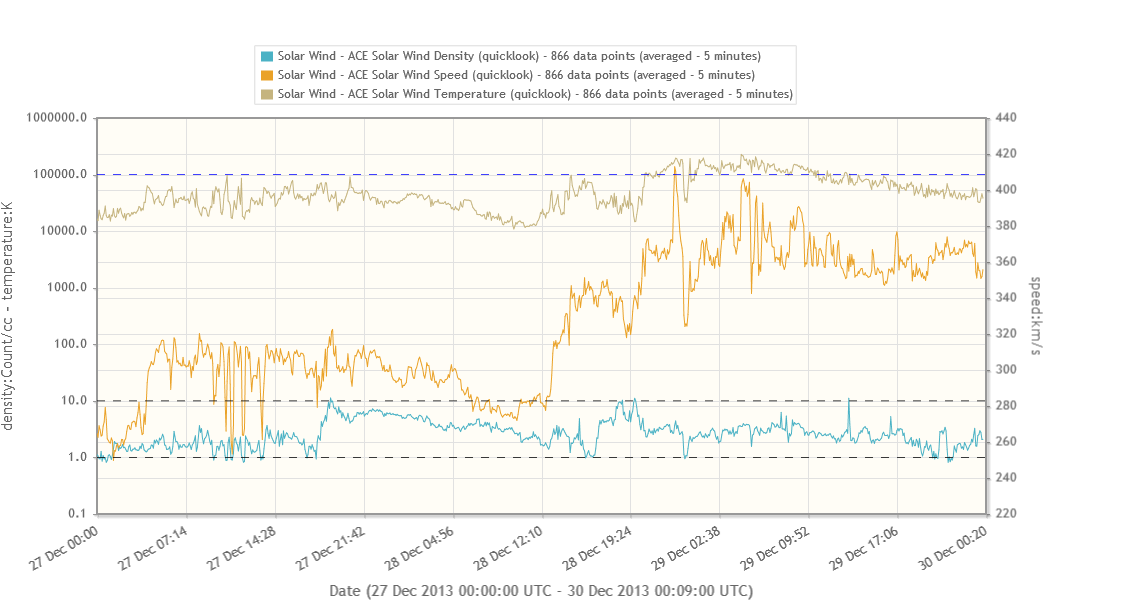
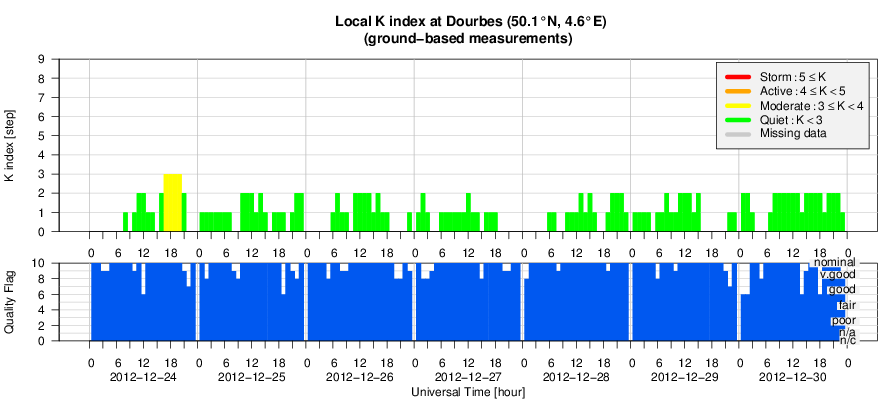
Solar wind speed as observed by ACE was nominal throughout the week, with values ranging between 240 and 390 km/s. The magnitude of the Interplanetary Magnetic Field varied between 1 and 12 nT. Around 3h UT on December 27, the solar wind speed increased quickly from about 265 to about 310 km/s. Around 13h UT on December 28, the solar wind speed increased further from its plateau of around 300 km/s to a plateau of around 370 km/s. These observations may have been the effect of a predicted weak coronal hole high speed stream arriving at Earth. Geomagnetic activity has been quiet (K Dourbes and NOAA Kp smaller than 4) throughout the whole week.
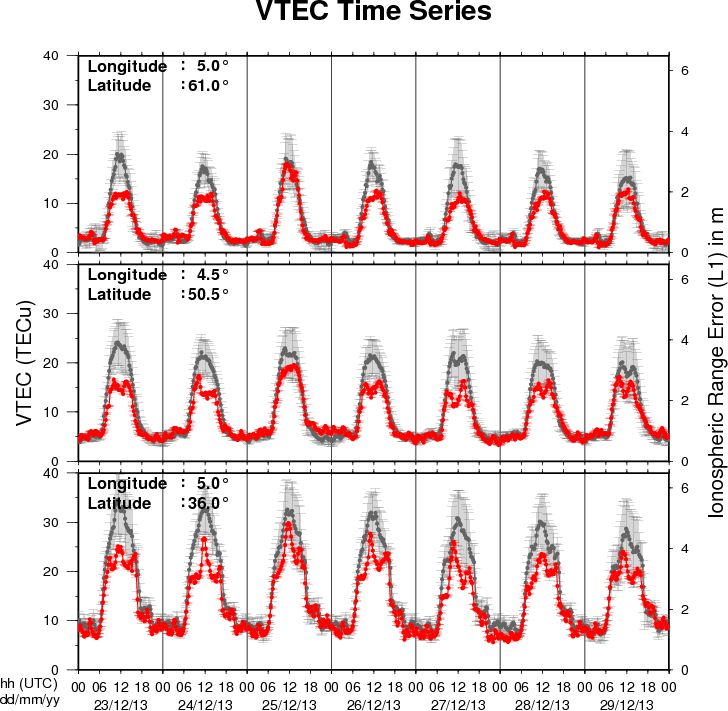
The figure shows the time evolution of the Vertical Total Electron Content (VTEC) (in red) during the last week at three locations:
a) in the northern part of Europe(N61°, 5°E)
b) above Brussels(N50.5°, 4.5°E)
c) in the southern part of Europe(N36°, 5°E)
This figure also shows (in grey) the normal ionospheric behaviour expected based on the median VTEC from the 15 previous days.
The VTEC is expressed in TECu (with TECu=10^16 electrons per square meter) and is directly related to the signal propagation delay due to the ionosphere (in figure: delay on GPS L1 frequency).
The Sun's radiation ionizes the Earth's upper atmosphere, the ionosphere, located from about 60km to 1000km above the Earth's surface.The ionization process in the ionosphere produces ions and free electrons. These electrons perturb the propagation of the GNSS (Global Navigation Satellite System) signals by inducing a so-called ionospheric delay.
See http://stce.be/newsletter/GNSS_final.pdf for some more explanations ; for detailed information, see http://gnss.be/ionosphere_tutorial.php
Start : 2014-04-27 - End : 2014-05-02
The EGU General Assembly 2014 will bring together geoscientists
from all over the world to one meeting covering all disciplines of
the Earth, planetary and space sciences. The EGU aims to provide a
forum where scientists, especially early career researchers, can
present their work and discuss their ideas with experts in all
fields of geosciences.
http://www.spaceweather.eu/en/repository/show?id=485
CMEs and flares are transient phenomena with huge energy releases originating from the solar corona. We investigate and analyze the evolution of the X1.4-class flare/CME event of 22 September 2011 that produced a distinct system of flare loops. Viewed from Earth, the event was observed on the solar limb, enabling us to derive height-time curves of the evolving loops. For a continuous tracking of the loop system in high-temporal resolution EUV data using SDO/AIA data, we developed a method that automatically detects the height of the loop tops over a given reference point by analyzing the intensity profile perpendicular to the solar limb. With this method, we measure the height-time profiles of the loop system in the different wavelength channels over a time period of 12 hours after the flare onset. We identify characteristic features in the height-time curves which stem from a non-uniform growth of the flare loop system related to the ongoing magnetic reconnection process. We put special focus on the early phase of the event for which we compare the growth of the loop system with the kinematics of the associated CME and aim to connect the physics behind the rapid growth of the loop system with changes in the kinematical behavior of the CME or enhanced soft X-ray flux.
http://www.spaceweather.eu/en/repository/show?id=486