
The Solar-Terrestrial Centre of Excellence (STCE) is a collaborative network of the Belgian Institute for Space Aeronomy, the Royal Observatory of Belgium and the Royal Meteorological Institute of Belgium.
|
Published by the STCE - this issue : 14 Mar 2014. The Solar-Terrestrial Centre of Excellence (STCE) is a collaborative network of the Belgian Institute for Space Aeronomy, the Royal Observatory of Belgium and the Royal Meteorological Institute of Belgium. |
| Archive of the newsletters | Subscribe to this newsletter by mail |
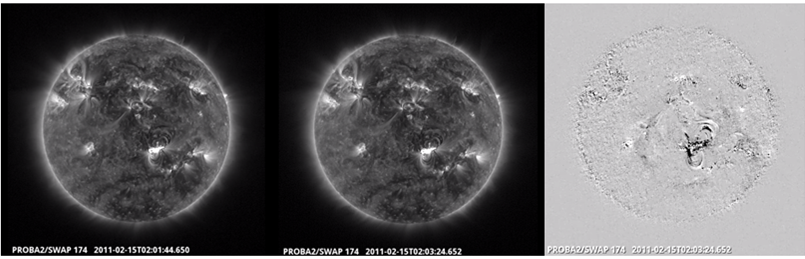
EIT-waves are named after the Extreme-ultraviolet Imaging Telescope (EIT) onboard SOHO, with which this phenomenon was discovered in 1996-1997. They are large-scale bright fronts observed in extreme ultraviolet (EUV) and propagating over a significant portion of the solar surface. An example is given underneath, from the 15 February 2011 event (X2-flare in the active region NOAA 1158). As these fronts are not so easily visible, scientists often use difference images, i.e. the difference between two subsequent images is shown. The image to the right shows the difference between the two PROBA2/SWAP images to the left.
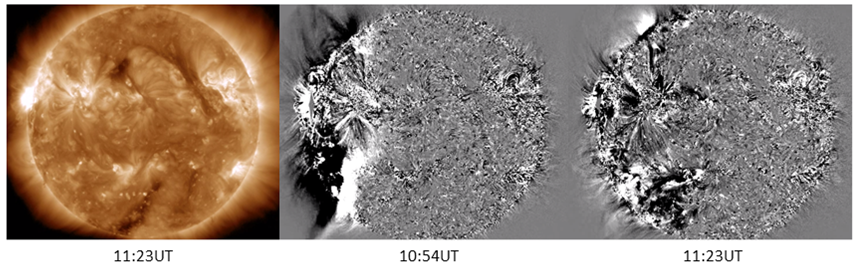
17 years later, the true nature of these waves remains under debate, though there is a gradual convergence towards it being primarily a fast magnetosonic wave (directly related to the presence of a coronal mass ejection, CME, rather than a flare), but often also with a contribution from the CME expansion (see Note 1). Other typical characteristics are its relatively low average speed of 200-600km/s, and that these fronts can be stopped at the boundary of coronal holes or near active regions. An example is given underneath, with the EIT-wave propagating from an X1.4 flare (22 September 2011, NOAA 1302) at the east limb, part of which was stopped by a coronal hole in the southern solar hemisphere.
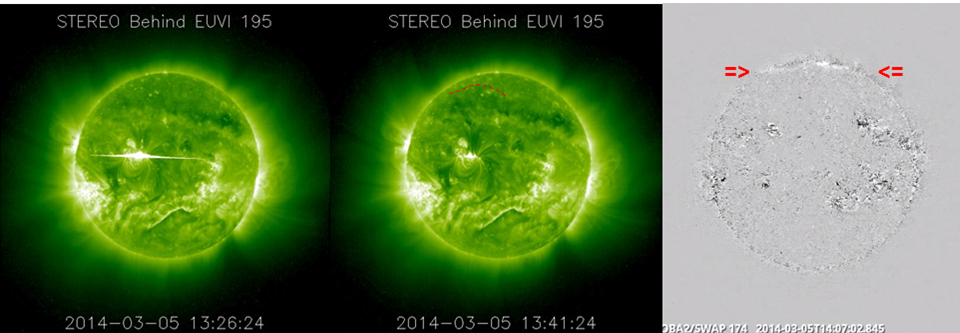
Last week on 5 March around 14:00UT, scientists of the PROBA2 Science Centre noticed something strange near the Sun's north pole. There was some brightening wave quickly fading as it was progressing further onto the solar disk, as a sea wave extinguishing when it reaches a beach. As there were no notable events on the solar disk facing Earth, this wave must have come from the Sun's backside. EUV imagery from STEREO-B quickly revealed that a strong eruptive flare had taken place at around 13:26UT, and that a bright front had been propagating away from the eruption site and to the north pole, where it arrived just over 30 minutes later.
The estimated average speed corresponds to about 500 km/s. No obvious front signature was found towards the south, as a number of active regions and filaments prevented its propagation. This may also explain the outlook of the associated (backside) halo CME, which was clearly more pronounced towards the north than to the south.
A movie with clips from the three events discussed above can be found at http://youtu.be/O5Lr8-ZgC_c More movies on EIT-waves as observed by SDO/AIA can be found at http://aia.lmsal.com/AIA_Waves/index.html
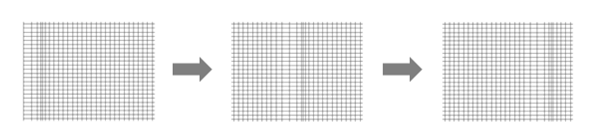
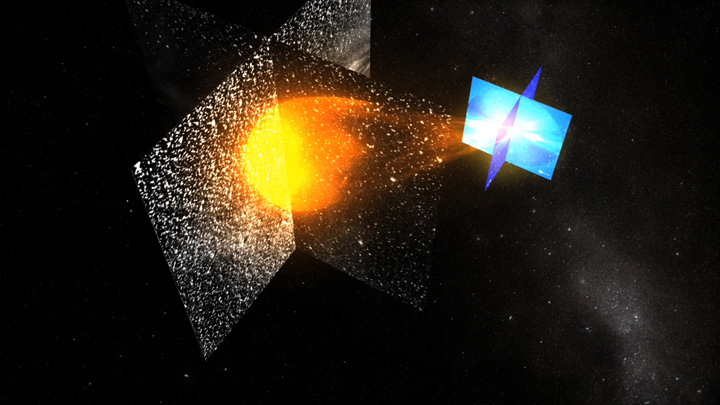
Note 1 - A fast magnetosonic wave is a longitudinal wave of charged particles in a magnetized plasma propagating in all directions, including perpendicularly and parallel to the magnetic field. See image underneath (Source: Wikipedia: http://en.wikipedia.org/wiki/Longitudinal_wave ).
Credits - Data and imagery were taken from PROBA2/SWAP (http://proba2.oma.be/ssa ), SDO (http://sdo.gsfc.nasa.gov/data/ ), STEREO (http://stereo.gsfc.nasa.gov/ ), and SOHO (http://sohowww.nascom.nasa.gov/ ).
We have two moments of Science and Food in the near future.
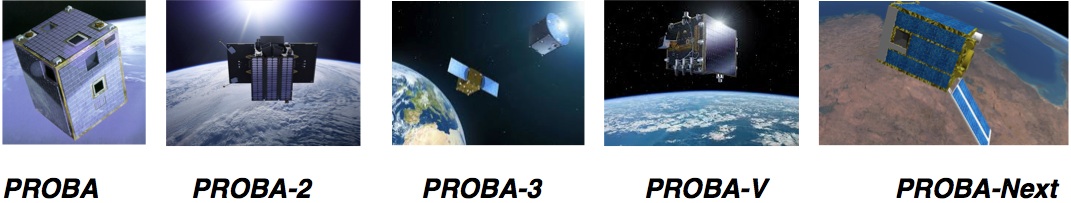
The workshop 'Science and science operations of the PROBA2 satellite fleet' will take place on March 31, 2014 and will give an expert insight in the micro satellite serie, with PROBA, PROBA-V and PROBA-2 already up and running and PROBA-3 in the preparatory phase. All are a state of the art, but PROBA-3 is really a special case: two separate satellites will fly in formation. One of the satellites will be the occulter to make coronographic images. This will be literally rocket science.
More : http://www.stce.be/annualmeeting/2014/PROBA.php
More : http://www.stce.be/annualmeeting/2014/tomography.php
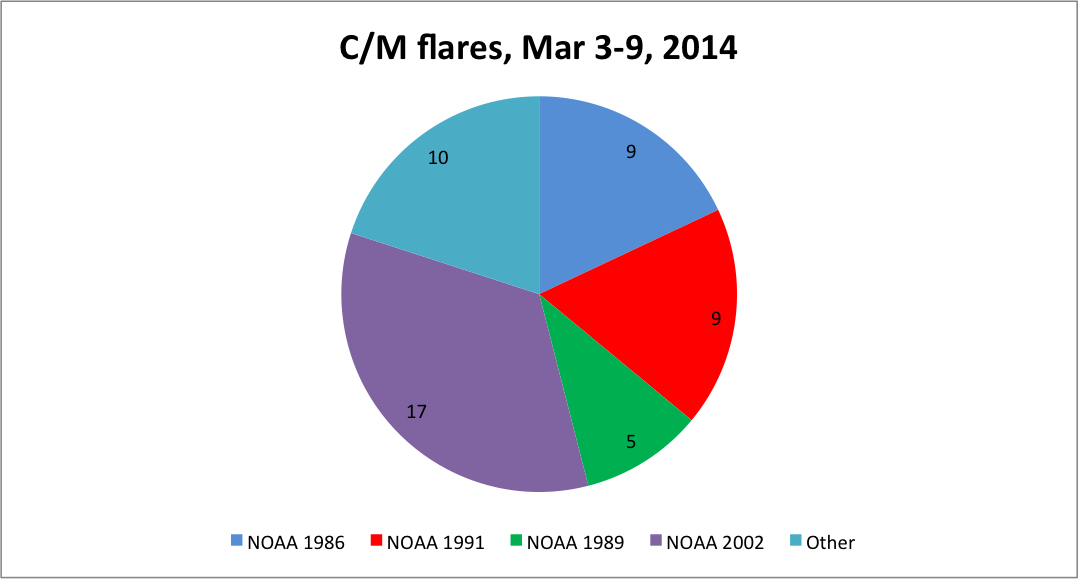
Solar activity varied between eruptive and active levels this week. Two impulsive M1-flares were observed from active regions NOAA 1989 and 1991 on resp. 3 March (15:58UT) and 5 March (02:10UT). For the next two days, only C-class flares were observed. GOES picked up C-flaring activity of NOAA 1986 from the far-side from the Sun. Then on 8 March, small but compact active region NOAA 2002 rounded the southeast limb. It produced numerous C-class flares, as well as three M1-flares: one late on 8 March (23:41UT), and two on 9 March (13:58UT and 20:28UT).
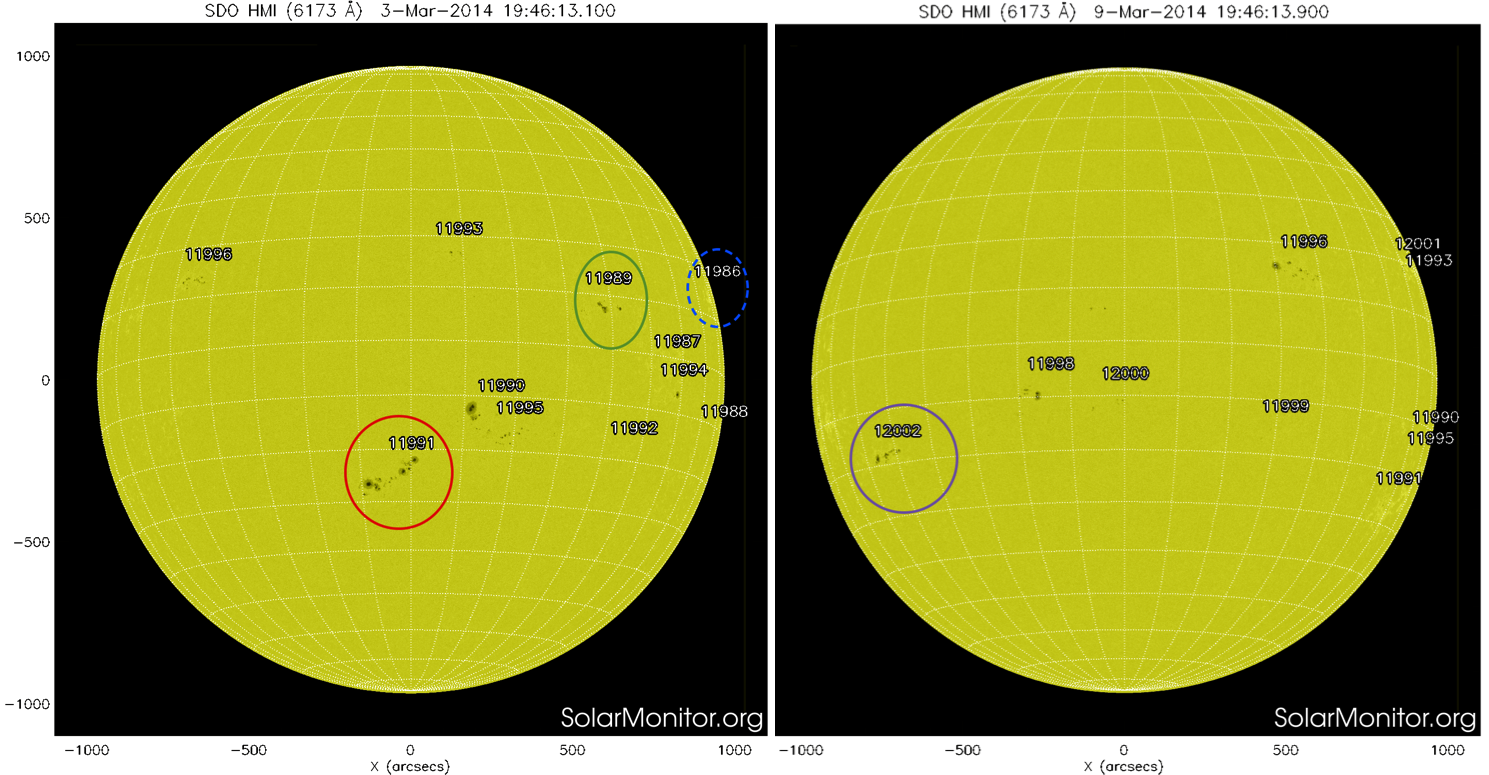
A quantitative overview of the number of C/M flares produced this week is in given in the chart below. The corresponding NOAA active regions are shown in SDO/HMI continuum pictures.
None of these events was associated to an Earth-directed CME. The observed (partial) halo CMEs on 4, 5 and 9 March were all backside events. The moderate proton event from last week's X4-flare (25 February) ended on 3 March at 01:50UT as can be seen in the GOES Proton Flux graph below.

| DAY | BEGIN | MAX | END | LOC | XRAY | OP | 10CM | TYPE | Cat | NOAA |
| 03 | 1554 | 1558 | 1601 | N5W36 | M1.2 | SN | 89 | 50 | 1989 | |
| 05 | 0206 | 0210 | 0212 | M1.0 | III/3 | 58 | 1991 | |||
| 08 | 2326 | 2341 | 2350 | M1.4 | 2002 | |||||
| 09 | 1352 | 1358 | 1405 | S17E58 | M1.0 | SN | 2002 | |||
| 09 | 2013 | 2028 | 2035 | S19E54 | M1.0 | SF | 2002 |
| LOC: approximate heliographic location | TYPE: radio burst type |
| XRAY: X-ray flare class | Cat: Catania sunspot group number |
| OP: optical flare class | NOAA: NOAA active region number |
| 10CM: peak 10 cm radio flux |
On 3 March, solar wind speed was around 350 km/s. From 4 March onwards, it gradually increased to values near 500 km/s early on 6 March after which a steady decline set in. Values of 300 km/s were reached by the end of the period.
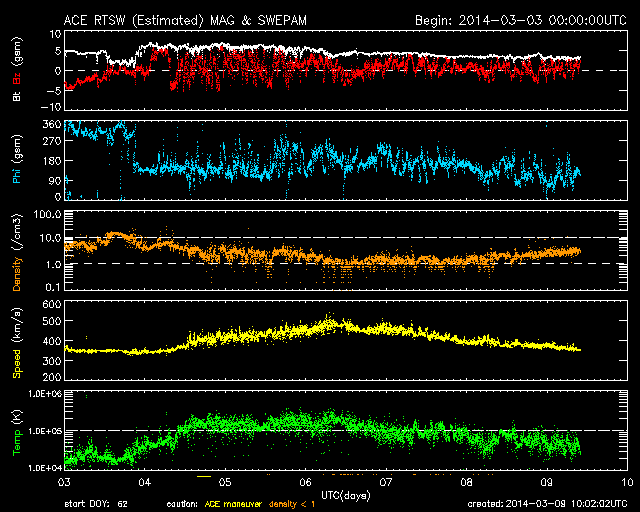
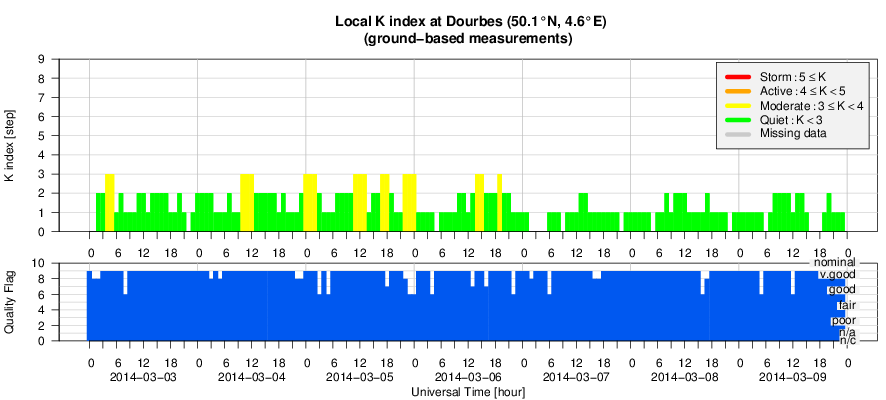
The source of this moderate-speed, high-temperature, low-density stream was possibly a coronal hole (CH) that passed the central meridian (CM) on 26-27 February. Bz fluctuated between -5nT and +5nT. Geomagnetic conditions remained quiet throughout the period, with locally some K=3 episodes from 3-6 March.
Solar activity was moderate at the beginning and the end of the week, with an intermediate period of low activity. 5 lower level M-flares were observed, the strongest was an M3.0 level flare.
In order to view the activity of this week in more detail, we suggest to go to the following website from which all the daily (normal and difference) movies can be accessed: http://proba2.oma.be/ssa
This page also lists the recorded flaring events.
A weekly overview movie can be found here: http://proba2.oma.be/swap/data/mpg/movies/WeeklyReportMovies/WR206_Mar03_Mar09/weekly_movie_2014_03_03.mp4 (SWAP week 206).
Details about some of this week’s events can be found further below.
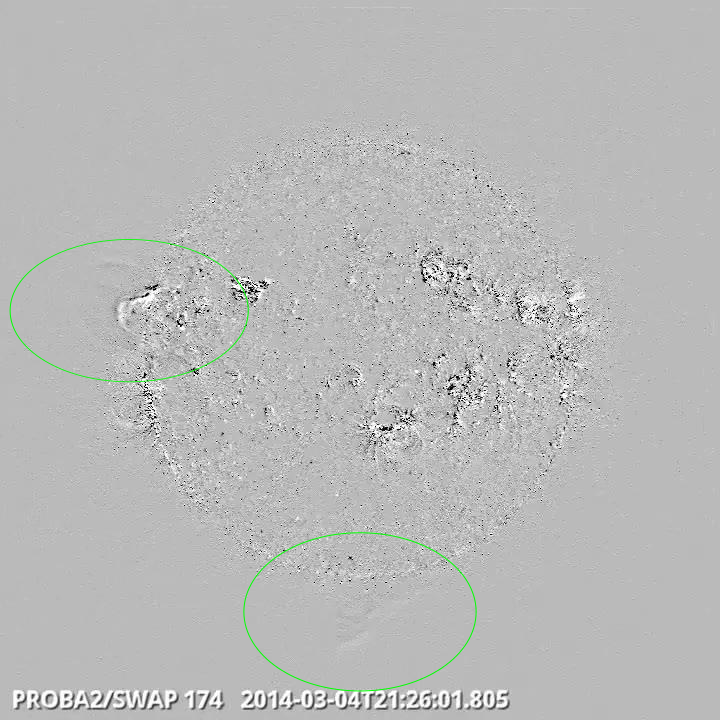
Double Prominence Eruption, North West and South Limb @ 21:26 - SWAP difference image
Find a movie of the event here: http://proba2.oma.be/swap/data/mpg/movies/WeeklyReportMovies/WR206_Mar03_Mar09/Events/20140304_DoubleProminenceEruption2126_SWAPdiff_annotated.mp4 (SWAP difference movie)
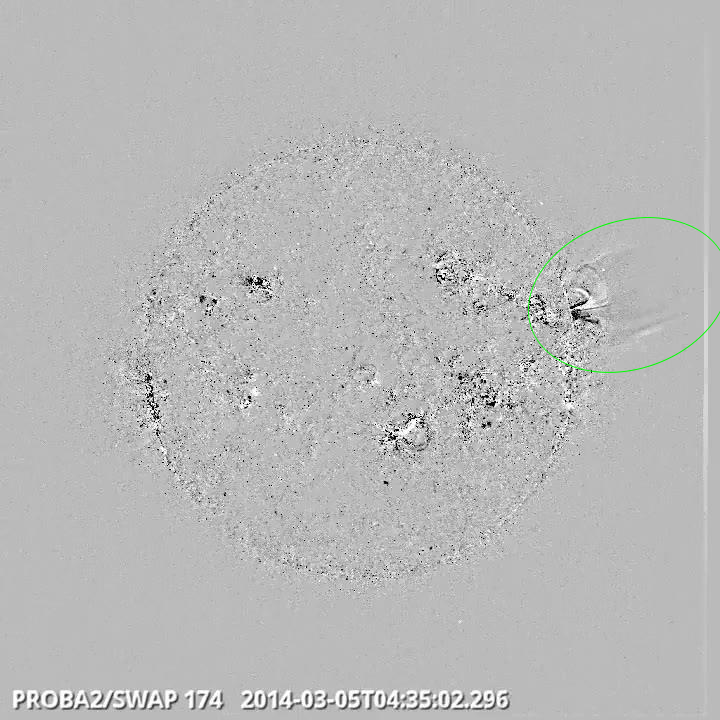
Eruption on the NorthWest Limb @ 04:35 - SWAP difference image
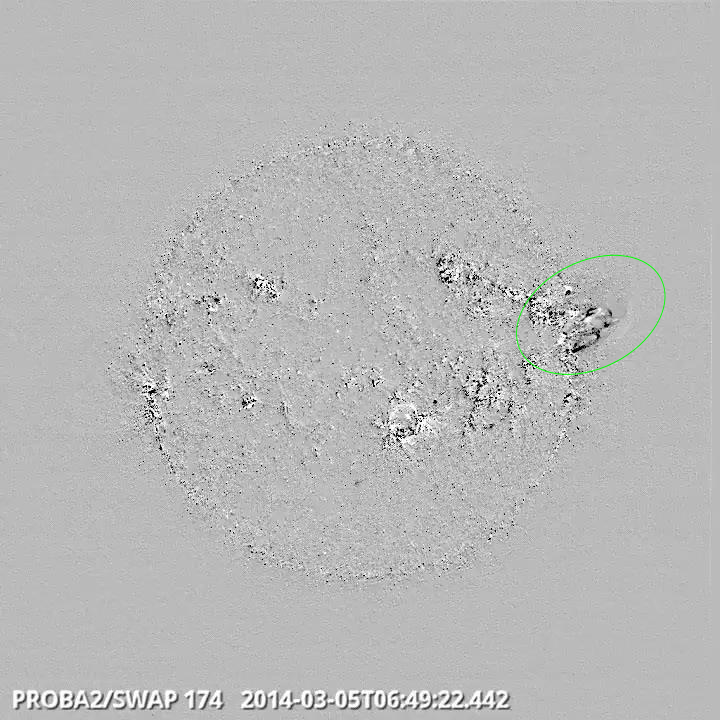
Eruption on the NorthWest Limb @ 06:49 - SWAP difference image
Both eruptions can be seen in this movie here: http://proba2.oma.be/swap/data/mpg/movies/WeeklyReportMovies/WR206_Mar03_Mar09/Events/20140305_Eruption_NWLimb_0649_SWAPdiff_annotated.mp4 (SWAP difference movie)
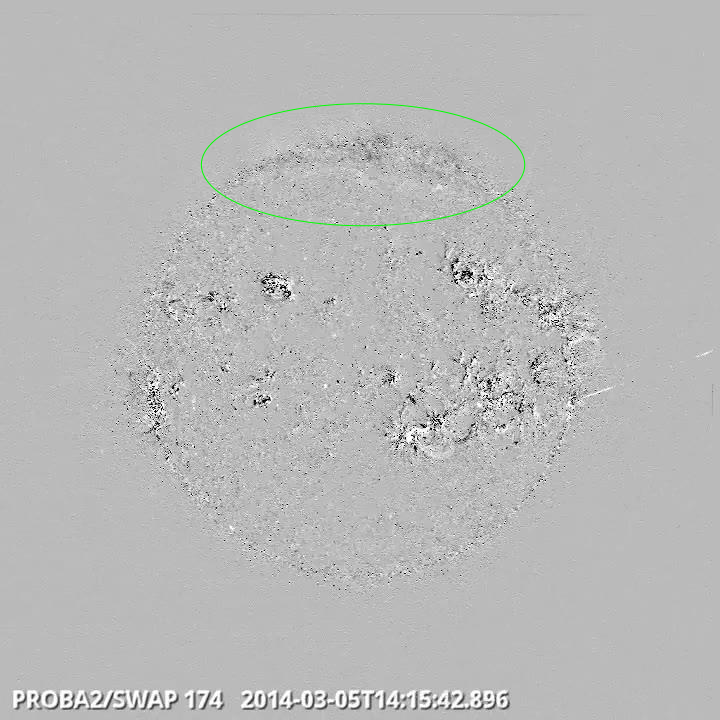
A wave appearing from behind the North limb, following a backside Northern eruption @ 14:15 - SWAP difference image
Find a movie of the event here: http://proba2.oma.be/swap/data/mpg/movies/WeeklyReportMovies/WR206_Mar03_Mar09/Events/20140305_NorthWave_NWLimb_1415_SWAPdiff_annotated.mp4(SWAP difference movie)
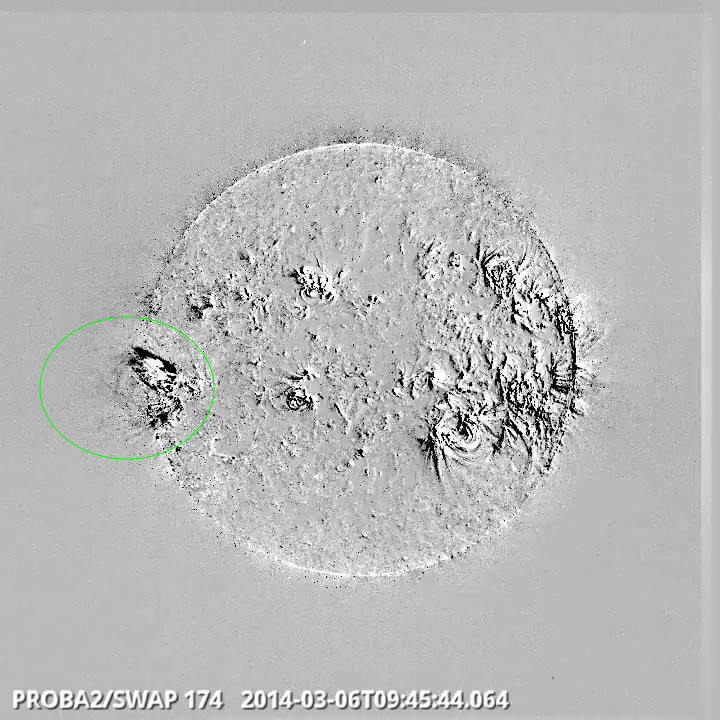
Flare Eruption on the East limb @ 09:45 - SWAP difference image
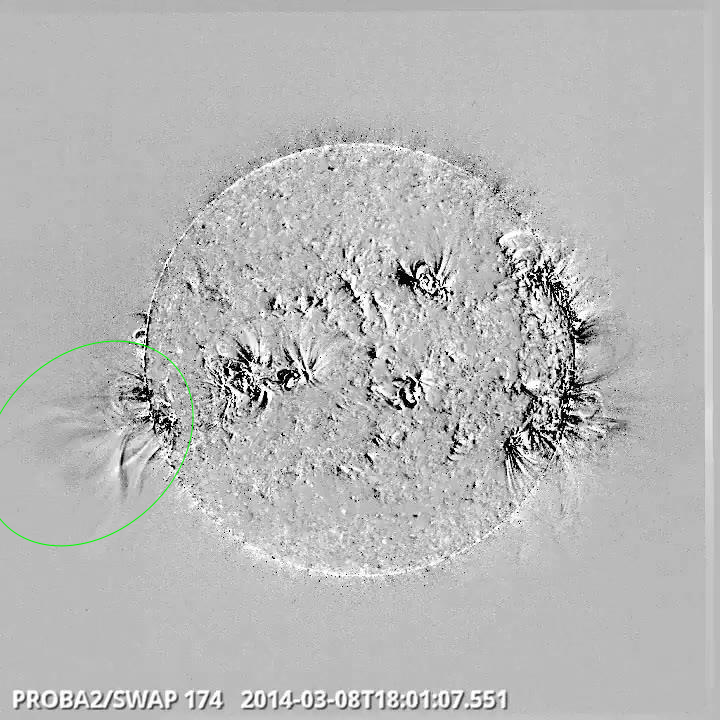
Eruption on the SouthEast Limb @ 18:01 - SWAP difference image
Find a movie of the event here: http://proba2.oma.be/swap/data/mpg/movies/WeeklyReportMovies/WR206_Mar03_Mar09/Events/20140308_SouthEastLimb_1801_SWAPdiff.mp4 (SWAP difference movie)
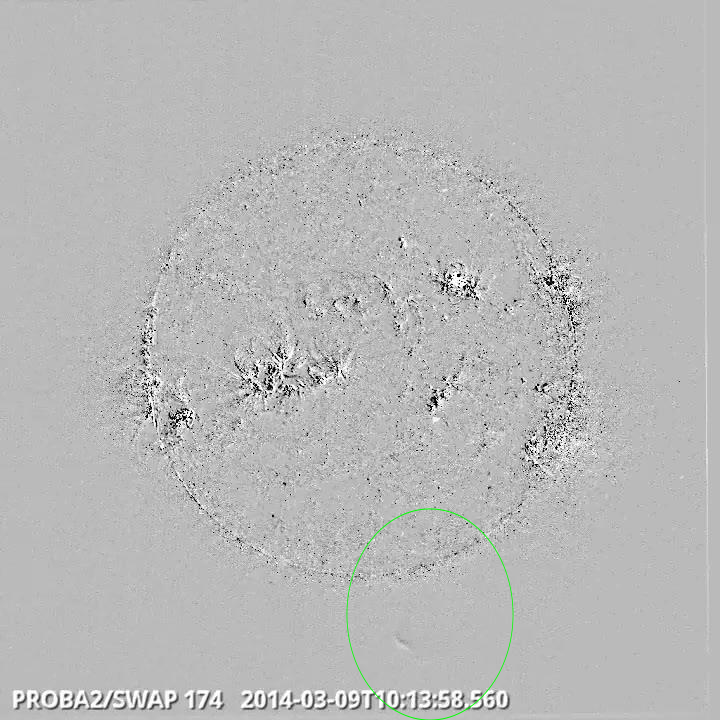
Prominence Eruption on the South Limb @ 10:14 - SWAP difference image
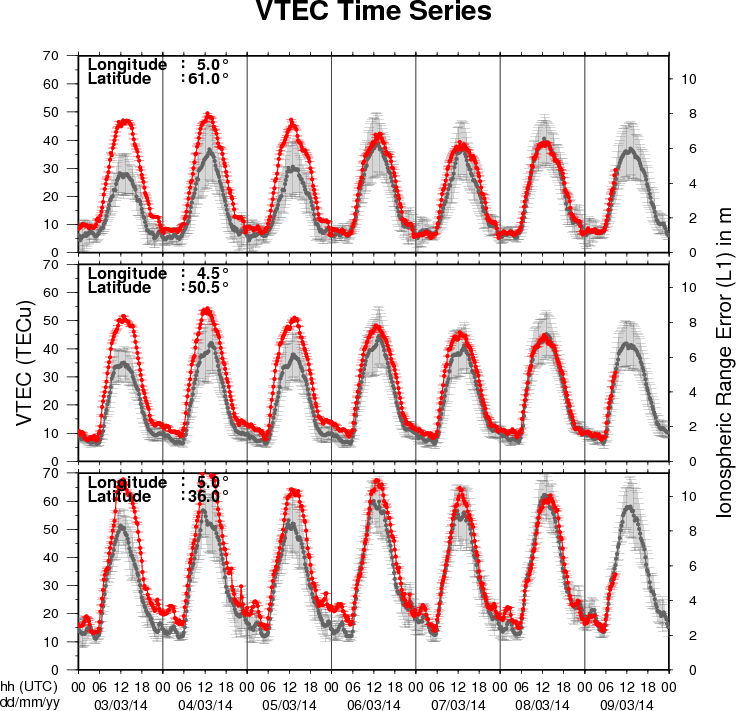
The figure shows the time evolution of the Vertical Total Electron Content (VTEC) (in red) during the last week at three locations:
a) in the northern part of Europe(N61°, 5°E)
b) above Brussels(N50.5°, 4.5°E)
c) in the southern part of Europe(N36°, 5°E)
This figure also shows (in grey) the normal ionospheric behaviour expected based on the median VTEC from the 15 previous days.
The VTEC is expressed in TECu (with TECu=10^16 electrons per square meter) and is directly related to the signal propagation delay due to the ionosphere (in figure: delay on GPS L1 frequency).
The Sun's radiation ionizes the Earth's upper atmosphere, the ionosphere, located from about 60km to 1000km above the Earth's surface.The ionization process in the ionosphere produces ions and free electrons. These electrons perturb the propagation of the GNSS (Global Navigation Satellite System) signals by inducing a so-called ionospheric delay.
See http://stce.be/newsletter/GNSS_final.pdf for some more explanations ; for detailed information, see http://gnss.be/ionosphere_tutorial.php
Lecture given to the members and public audience at the Cosmodrome Public Observatory. It focuses mainly on the effects of space weather, extreme space weather, and the space weather forecast team at the Space Pole (RWC Brussels).
In Dutch, 30 attendees
http://www.spaceweather.eu/en/repository/show?id=487
Lecture focusing on the effects of space weather, extreme space weather, and the space weather forecasting at the Space Pole (RWC Brussels).
The lecture was given to the astronomical association GALILEO in Heerlen, Nederlands-Limburg, The Netherlands.
Solar amateur astronomers and public audience, in Dutch, about 20 attendees.
http://www.spaceweather.eu/en/repository/show?id=488
http://www.spaceweather.eu/en/repository/show?id=489
Presentation supporting the splinter meeting, see http://www.stce.be/esww10/splinters/ssa.php
http://www.spaceweather.eu/en/repository/show?id=490
http://www.spaceweather.eu/en/repository/show?id=491
http://www.spaceweather.eu/en/repository/show?id=492
http://www.spaceweather.eu/en/repository/show?id=493
Start : 2014-03-30 - End : 2014-04-04
Biennial CCMC community workshops are designed as opportunities
for an in-depth exchange of experiences, opinions and needs between
model owners, science and operational users, agency representatives
and the CCMC staff.
Website:
http://ccmc.gsfc.nasa.gov/CCMC_Workshop_2014/index.php
Start : 2014-04-27 - End : 2014-05-02
The EGU General Assembly 2014 will bring together geoscientists
from all over the world to one meeting covering all disciplines of
the Earth, planetary and space sciences. The EGU aims to provide a
forum where scientists, especially early career researchers, can
present their work and discuss their ideas with experts in all
fields of geosciences.