
The Solar-Terrestrial Centre of Excellence (STCE) is a collaborative network of the Belgian Institute for Space Aeronomy, the Royal Observatory of Belgium and the Royal Meteorological Institute of Belgium.
|
Published by the STCE - this issue : 16 May 2014. The Solar-Terrestrial Centre of Excellence (STCE) is a collaborative network of the Belgian Institute for Space Aeronomy, the Royal Observatory of Belgium and the Royal Meteorological Institute of Belgium. |
| Archive of the newsletters | Subscribe to this newsletter by mail |
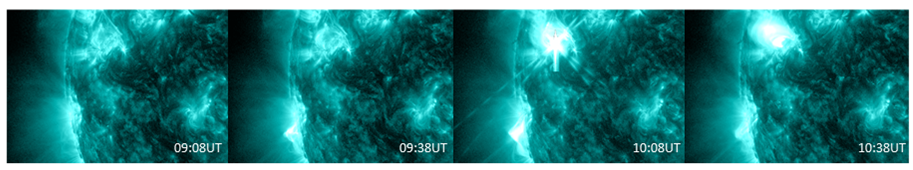
On 8 May, an M5 flare took place in sunspot region NOAA 2056. This active region was part of a cluster of sunspot groups that had appeared from behind the Sun's east limb between 4 and 6 May.
A movie of the event can be seen at http://youtu.be/kfvz5fo6EYs
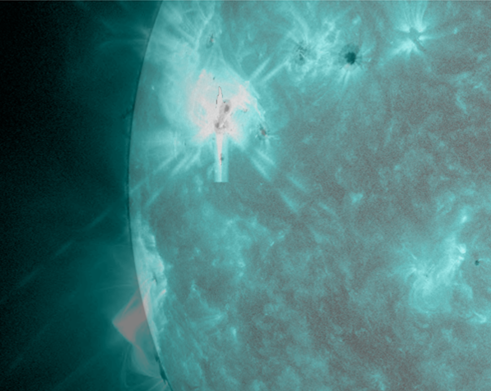
Image underneath shows the flare near its maximum (10:07UT) as seen through SDO's AIA 131 filter (temperature of million degrees) overlaid on a white light image (SDO/HMI). The flare is located over the trailing part of NOAA 2056, which harbored a delta (i.e. 2 spots of opposite magnetic polarity within the same penumbra).
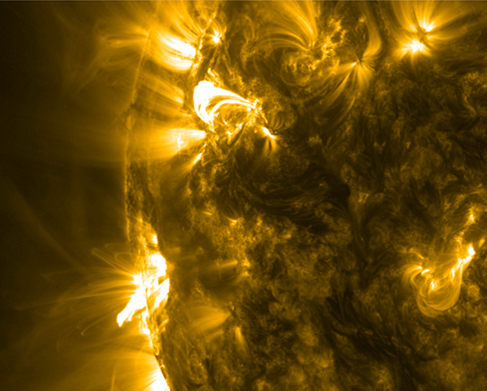
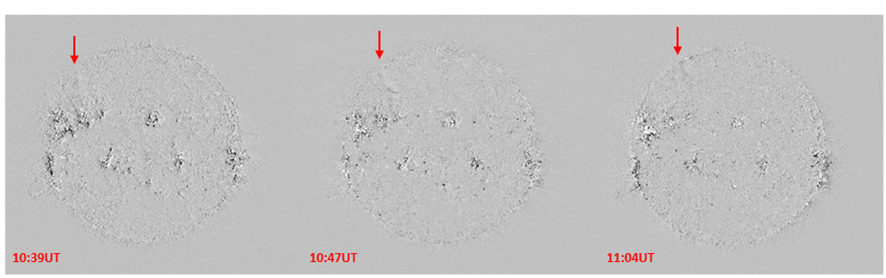
After the flare, SDO filters showing somewhat "cooler" temperatures of the Sun's atmosphere revealed the presence of post-flare coronal loops over the blast site (AIA 171 image above at 11:38UT). Scientists of the PROBA2 Science Centre noticed also a weak EIT-wave (http://www.stce.be/news/241/welcome.html) heading to the north between 10:30 and 11:10UT. The wave is best seen in difference images made by PROBA2's SWAP instrument (image underneath, and movie at http://proba2.oma.be/swap/movies/20140508_swap_diff.mp4 ). SOHO's coronagraphs did not reveal a clear coronal mass ejection (CME) associated to this event.
Interestingly, the x-ray flux as observed by the GOES15 satellite shows an increase well before the flare's peak at 10:07UT. Indeed, around 09:15UT, the x-ray flux gradually started to increase and stayed at C2-level for nearly half an hour (see graph underneath).
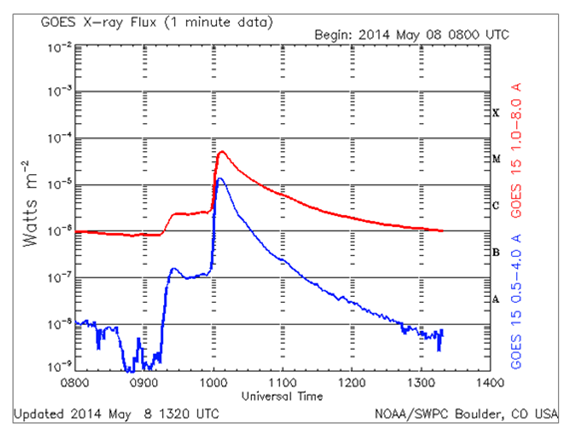
However, this "step-up" originated from a region at or just beyond the southeast solar limb. SDO--imagery (AIA 131) clearly demonstrates a flare starting around 09:15UT. At nearly 10:00UT, as the x-ray flux from the flare in NOAA 2056 rapidly rose, the x-ray flux from the source near the east limb declined. Hence, the stepped x-ray flux profile originated from two different sources.
Credits - Data and imagery were taken from SDO/AIA and HMI (http://sdo.gsfc.nasa.gov/data/aiahmi/), PROBA2/SWAP (http://proba2.oma.be/ssa) and GOES15/XRS (http://www.swpc.noaa.gov/rt_plots/xray_1m.html).
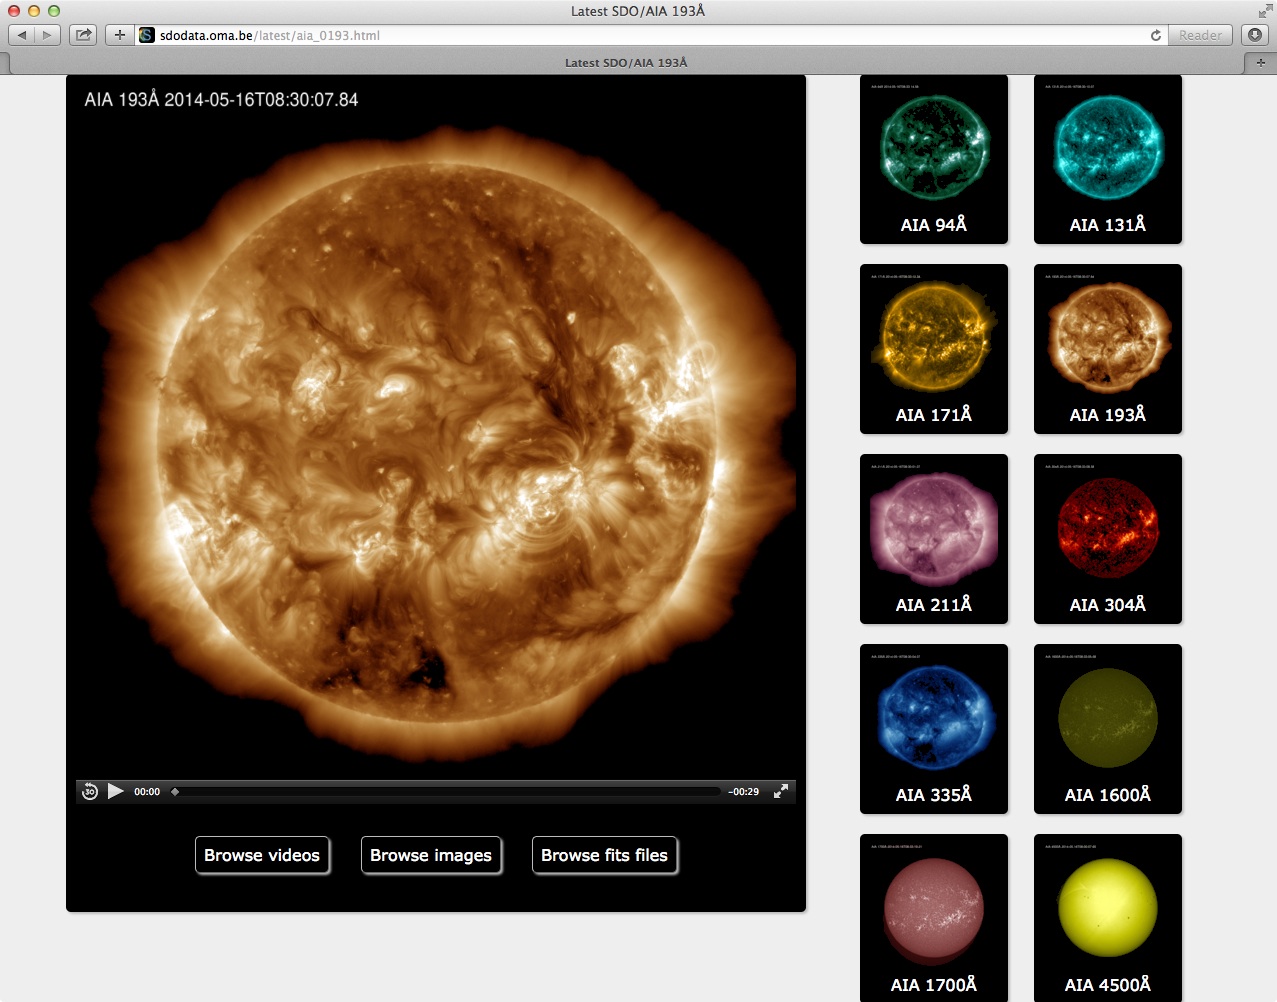
The Solar Dynamics Observatory was in 2010 brought into an Earth orbit. It got the task to observe our Sun in all its glory which the spacecraft performs with verve producing tons of data distributed to Europe by the European SDO data centre located in Brussels.
To provide the best possible service, the centre is interested in your feedback and set up a four question short survey. If you first need to be acquainted to the SDO data centre tricks and moves, please feel free to browse to the page explaining the use of the SDO wizard. It is in fact a play ground for solar scientists interested in real time data, major events, solar software with exotic names of animals of recent and long passed eras in paleontology:
http://sdoatsidc.oma.be/web/sdoatsidc/DataAccessWizardSDO
This brings you smoothly to the survey
http://sdoatsidc.oma.be/web/sdoatsidc/Survey
Thanks for your input!
A snapshot of the latest data SDO page
ESWW11 - the 11th edition of the European Space Weather Week can count also this year on visual support

more on http://www.stce.be/esww11
Solar flare activity fluctuated between low and moderate during the week.
In order to view the activity of this week in more detail, we suggest going to the following website from which all the daily (normal and difference) movies can be accessed: http://proba2.oma.be/ssa. This page also lists the recorded flaring events.
The weekly SWAP overview movie can be found here: http://proba2.oma.be/swap/data/mpg/movies/WeeklyReportMovies/WR215_May05_May11/weekly_movie_2014_05_05.mp4 (SWAP week 215).
At 2 occasions the Sun is seen to be off-pointed East, due to special campaigns.
Early in the week (Tue, Wed), some quite large scale structures and eruptions can be observed in the eastern corona (North and South, respectively).
Details about some of this week’s events can be found further below.
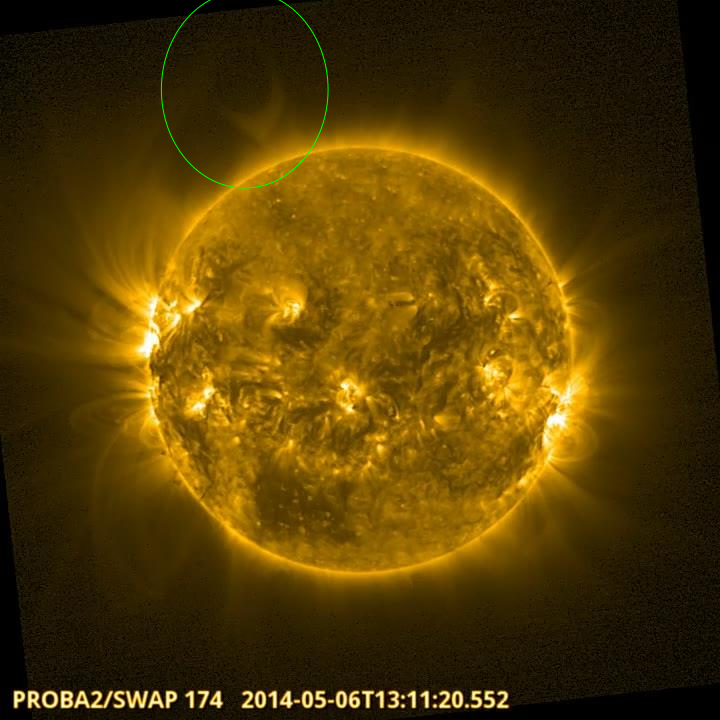
Cavity eruption, North East Limb @ 13:11 - SWAP image
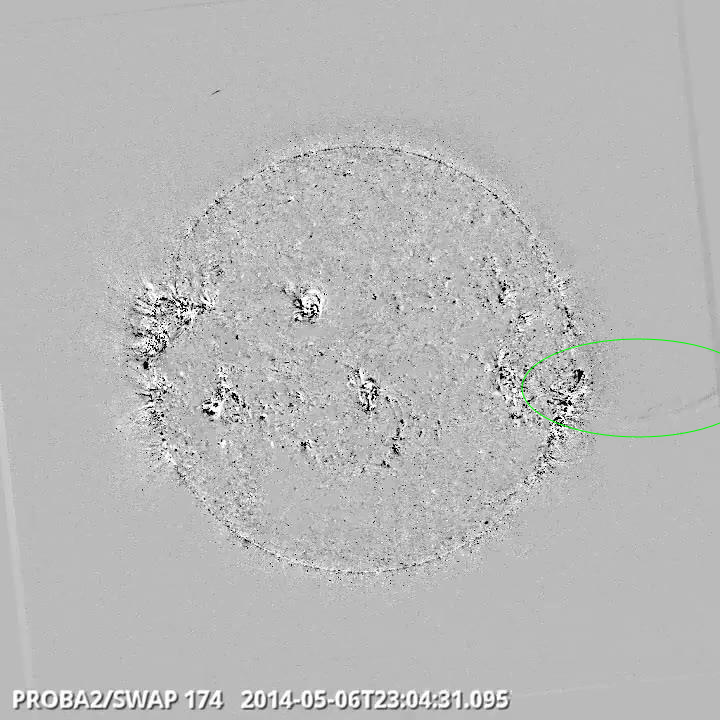
Eruption on West Limb @ 23:06 - SWAP difference image
Find a movie here: http://proba2.oma.be/swap/data/mpg/movies/WeeklyReportMovies/WR215_May05_May11/20140506_EruptionWestLimb_2304_SWAPdiff.mp4 (SWAP difference movie)

Eruption on West Limb, extending up to SWAP FOV @ 02:51 - SWAP difference image
Find a movie here: http://proba2.oma.be/swap/data/mpg/movies/WeeklyReportMovies/WR215_May05_May11/20140509_Eruption_WestLimb_0251_SWAPdiff.mp4 (SWAP difference movie)
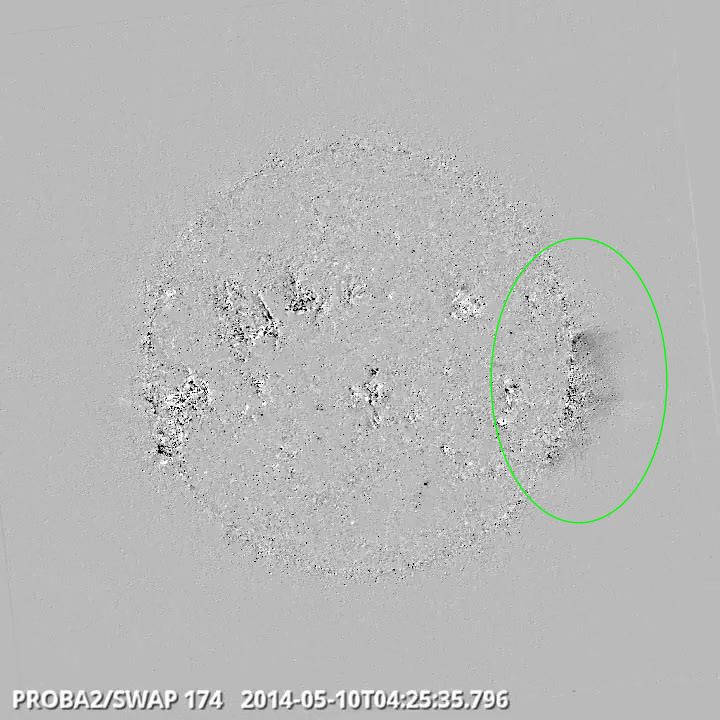
Backside eruption behind West Limb @ 04:25 - SWAP difference image
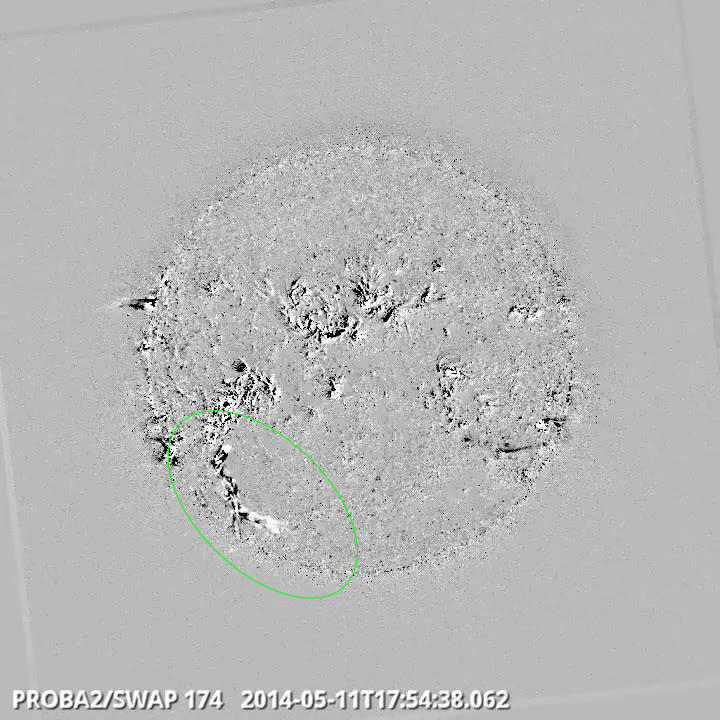
Multiple and extended flow-activity along the South-East limb @ 17:54 on Saturday -
SWAP difference image (see the daily movies of 10/11/12 of May)
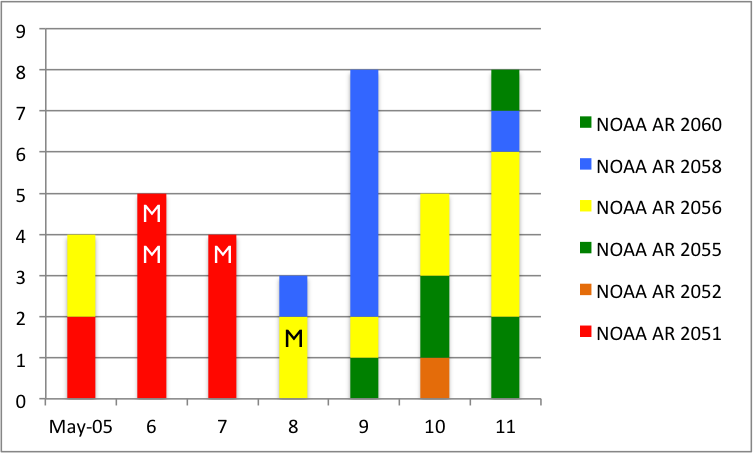
The background X-ray radiation was mostly at the high B level with a total of 33 C flares and 4 M flares associated with an active region.
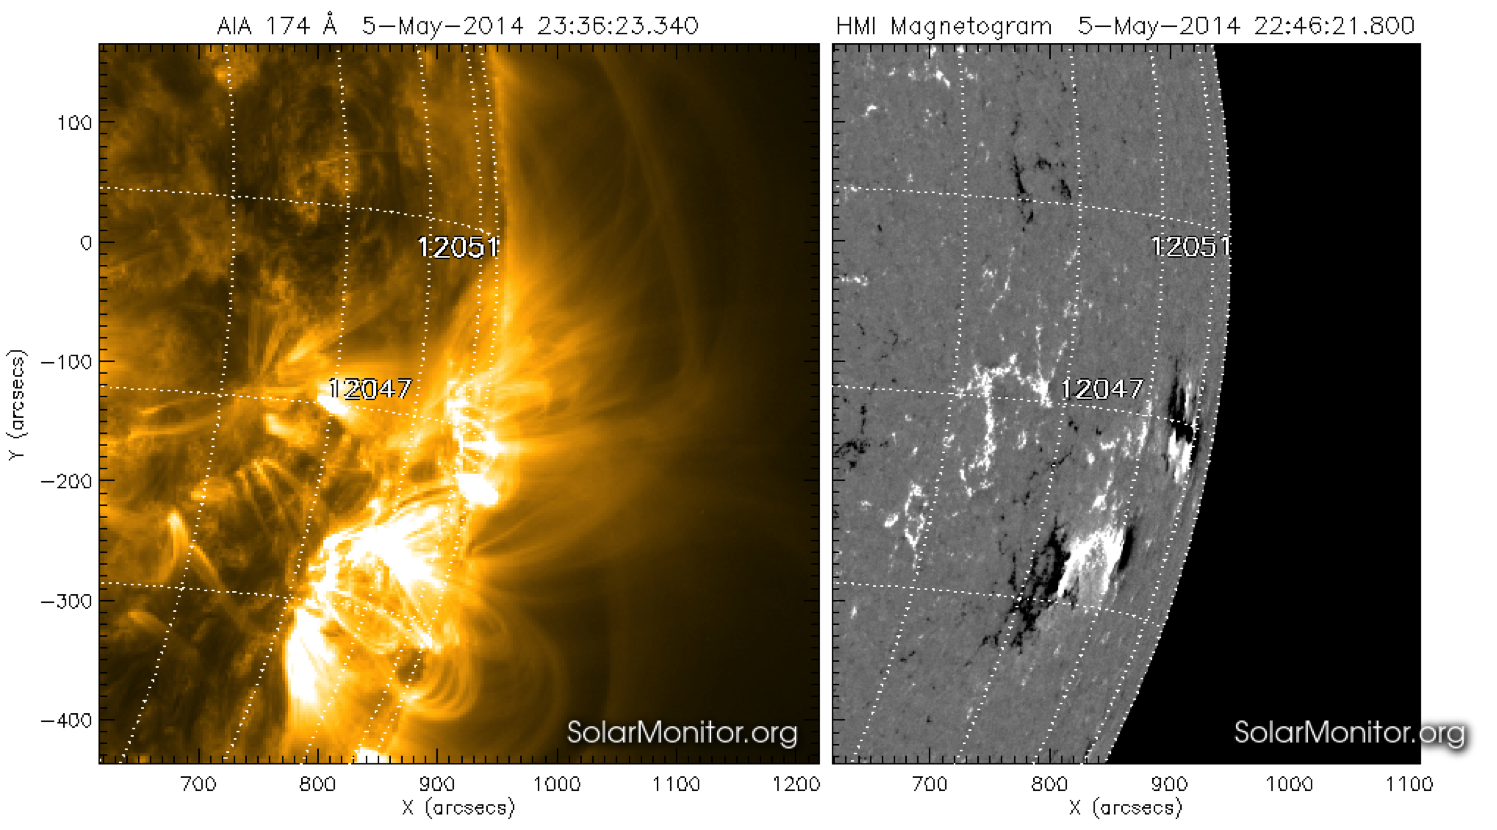
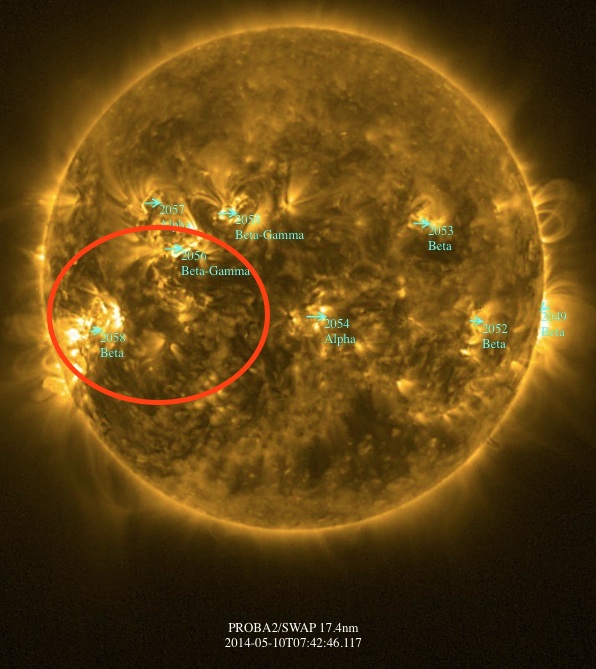
NOAA AR 2051 was a member of club ‘most active regions’ with 8 C-flares and 3 M-flares. Other notable groups were AR 2056 and 2058 which turned into view from behind the east limb during the week. AR 2056 produced the biggest flare: an M5.3. The first picture below show AR 2051 on May 5 ready to end its trip over the solar disk. Its most energetic flares where produced at a moment when the region was rotating over the west limb. The SWAP EUV image shows the complete solar disk with special focus on 2056 and 2058. The chart nicely shows the distribution of flares over time and regions.
Quite a number of (partial) halo CME events were recorded, but none of them was front sided. The CME's associated with the solar activity of NOAA AR 2051 occurred when it was at or well behind the western limb.
| DAY | BEGIN | MAX | END | LOC | XRAY | OP | 10CM | TYPE | Cat | NOAA |
| 06 | 0841 | 0903 | 0921 | S15W84 | M1.8 | SF | III/2 | 36 | 2051 | |
| 06 | 2201 | 2209 | 2220 | S10W57 | M1.0 | SF | III/2 | 36 | 2051 | |
| 07 | 1607 | 1629 | 1703 | N15E50 | M1.2 | SF | III/1 | 2051 | ||
| 08 | 0920 | 1007 | 1018 | M5.2 | 390 | |||||
| 08 | 0959 | 1007 | 1018 | N8E54 | M5.2 | 2B | 390 | 43 | 2056 |
| LOC: approximate heliographic location | TYPE: radio burst type |
| XRAY: X-ray flare class | Cat: Catania sunspot group number |
| OP: optical flare class | NOAA: NOAA active region number |
| 10CM: peak 10 cm radio flux |
Enhanced solar wind conditions after the arrival of the April 29 CME on May 3, were declining at the start of the week. After a shock arrival around 21:35 UT May 7, possibly related to the May 3 CME (see STCE news letter), a new period of increased solar wind values started with Bz reaching a maximal negative value around -12nT. Towards the end of the week these enhanced values persisted due to coronal hole high speed stream influence and speeds climbed to over 400 km/s but total magnetic field declined to around 5nT. It probably concerns the northern coronal hole which was near the meridian on May 7.
A typical coronal hole signature includes first an increase in Bt and density followed by a gradual increase in speed of the solar wind plasma. Because the Sun rotates, a fast solar wind particle (red) from a coronal hole can follow the same physical radial path of a slow solar wind particle (blue). When the fast wind catches up with the slow wind in front of it, a compressed, both magnetically and in terms of density, plasma structure is formed which rotates as fast as the Sun rotates around its axis.
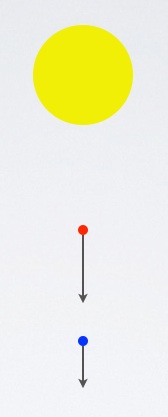
This is a co-rotating interaction region, CIR. ACE, fixed at the first Lagrangian point (L1) measures accordingly a gradually increasing solar wind speed: first the slow particles pass, followed by the fast particles. The speed curve shows a bump which comes a little later then the density/magnetic bump. As soon a the speed increases, the density and Bt decrease to conserve the mass flux. The point where the red dot overtakes the blue dot and forms a shock front (blue and red move together) is usually located behind 1AU.
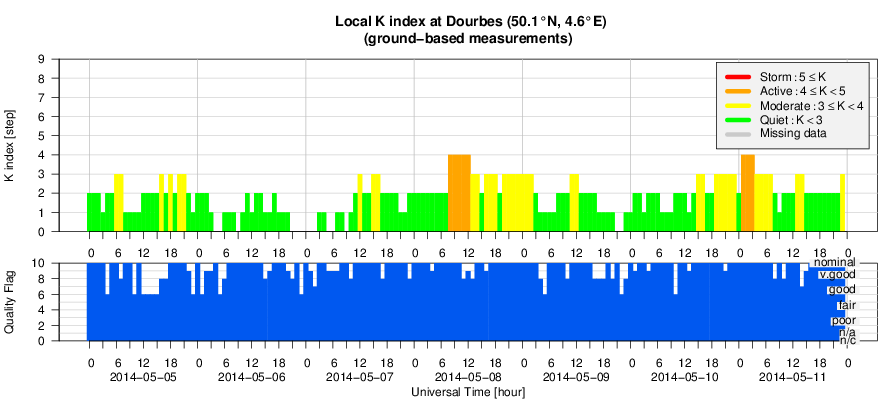
Geomagnetic conditions were mostly quiet to unsettled with two periods of active conditions following the shock arrival on May 7 and on May 11 after the onset of the high speed stream influence.
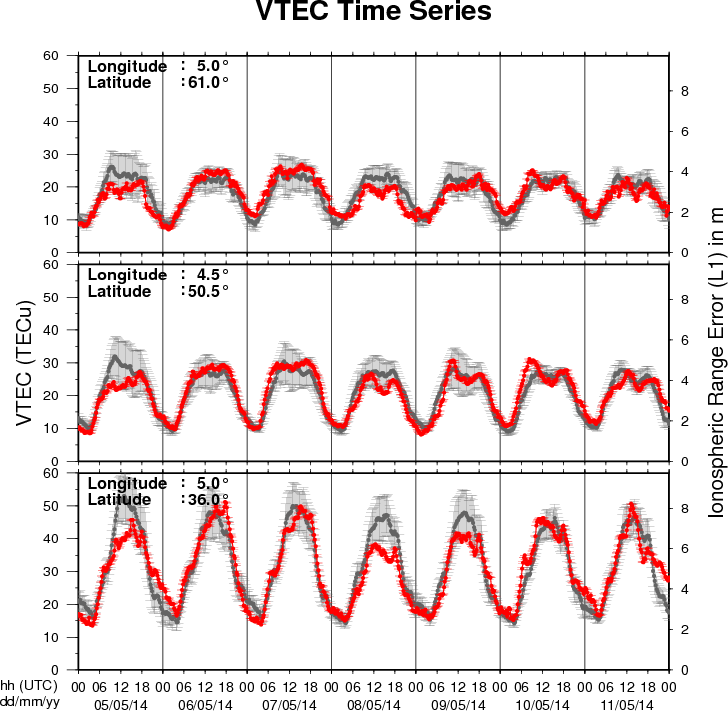
The figure shows the time evolution of the Vertical Total Electron Content (VTEC) (in red) during the last week at three locations:
a) in the northern part of Europe(N61°, 5°E)
b) above Brussels(N50.5°, 4.5°E)
c) in the southern part of Europe(N36°, 5°E)
This figure also shows (in grey) the normal ionospheric behaviour expected based on the median VTEC from the 15 previous days.
The VTEC is expressed in TECu (with TECu=10^16 electrons per square meter) and is directly related to the signal propagation delay due to the ionosphere (in figure: delay on GPS L1 frequency).
The Sun's radiation ionizes the Earth's upper atmosphere, the ionosphere, located from about 60km to 1000km above the Earth's surface.The ionization process in the ionosphere produces ions and free electrons. These electrons perturb the propagation of the GNSS (Global Navigation Satellite System) signals by inducing a so-called ionospheric delay.
See http://stce.be/newsletter/GNSS_final.pdf for some more explanations ; for detailed information, see http://gnss.be/ionosphere_tutorial.php
Start : 2014-06-10 - End : 2014-06-11
The STCE workshop 'Inter-Calibration and Degradation of EUV
Instruments' aims at understanding the differences observed between
the various instruments observing in the SXR-EUV range and at
analyzing the ageing effects that affect their results. It targets
imagers as well as spectrometers and photometers.
The workshop will be followed by two days of working sessions
(June 12-13) organized by the Solar EUV Irradiance Working Group
(also supported by the STCE). These working sessions are in the
continuity of similar events organized in 2011, 2012 and 2013, but
they are open to new participants and you are welcome to join if
you are interested.
Website:
http://www.stce.be/euvworkshop2014/
Start : 2014-06-19 - End : 2014-06-20
During the summer of 2014 DTU Space will host the 3rd Swarm
Science Meeting, sponsored by the European Space Agency, ESA
. This meeting will take place at
the IDA Conference Centre in Copenhagen on June 19th to 20th 2014
and is open to the science community at large.
Website:
http://congrexprojects.com/2014-events/Swarm/home
Presentation given at the STCE Workshop Science and science operations of the PROBA satellite fleet on the perspective of Belspo on the PROBA series and the Belgian involvement in the European space programmes.
http://www.spaceweather.eu/en/repository/show?id=501
Presentation given at the STCE Workshop Science and science operations of the PROBA satellite fleet on the perspective of QinetiQ Space on the PROBA series.
http://www.spaceweather.eu/en/repository/show?id=502
Presentation given at the STCE Workshop Science and science operations of the PROBA satellite fleet on Proba-1 and Proba-V as part of the ESA's Earth Observation Programme.
http://www.spaceweather.eu/en/repository/show?id=503
Presentation given at the STCE Workshop Science and science operations of the PROBA satellite fleet about the PROBA2 science operations.
http://www.spaceweather.eu/en/repository/show?id=504
Presentation given at the STCE Workshop Science and science operations of the PROBA satellite fleet on the new operational mission PROBA-V, an earth observing satellite.
http://www.spaceweather.eu/en/repository/show?id=505
Presentation given at the STCE Workshop Science and science operations of the PROBA satellite fleet about the operations at the PROBA satellites "nursery".
http://www.spaceweather.eu/en/repository/show?id=506
Presentation given at the STCE Workshop Science and science operations of the PROBA satellite fleet on a PROBA-V experimental moon calibration method.
http://www.spaceweather.eu/en/repository/show?id=507
Presentation given at the STCE Workshop Science and science operations of the PROBA satellite fleet on the instrument aspects, operations and science of the Energetic Particle Telescope (EPT) onboard of PROBA-V.
http://www.spaceweather.eu/en/repository/show?id=508
Presentation given at the STCE Workshop Science and science operations of the PROBA satellite fleet on the challenges and successes of the coronal images SWAP onboard of PROBA2.
http://www.spaceweather.eu/en/repository/show?id=509
Presentation given at the STCE Workshop Science and science operations of the PROBA satellite fleet on the Large-Yield Radiometer (LYRA) onboard of PROBA2. LYRA measures the solar irradiance in 4 bandpasses with 3 types of detectors.
http://www.spaceweather.eu/en/repository/show?id=510
Presentation given at the STCE Workshop Science and science operations of the PROBA satellite fleet on the results and operations of the micro-cameras onboard of PROBA-1 and PROBA2.
http://www.spaceweather.eu/en/repository/show?id=511
Presentation given at the STCE Workshop Science and science operations of the PROBA satellite fleet on the impacts of the Low Earth Orbit radiation environment on PROBA satellites.
http://www.spaceweather.eu/en/repository/show?id=512
Presentation given at the STCE Workshop Science and science operations of the PROBA satellite fleet on ALTIUS, an Atmospheric Limb Tracker for Investigation of the Upcoming Stratosphere.
http://www.spaceweather.eu/en/repository/show?id=513
Presentation given at the STCE Workshop Science and science operations of the PROBA satellite fleet on the future PROBA-3 satellite. PROBA-3 consists of 2 spacecraft flying in formation. The inner-satellite acts as the occulter for a chronograph observing the solar atmosphere.
http://www.spaceweather.eu/en/repository/show?id=514
Presentation given at the STCE Workshop Science and science operations of the PROBA satellite fleet on the study of a Passive Companion Micro-Satellite to the SAOCOM-1B Satellite of Argentina, for bistatic and interferometric SAR applications.
http://www.spaceweather.eu/en/repository/show?id=515
Presentation given at the STCE Workshop Tomography and 3D reconstruction in space science, April 2014 on 3D CME reconstruction: constraints, methods and an application.
http://www.spaceweather.eu/en/repository/show?id=516
Presentation given at the workshop Tomography and 3D reconstruction in space science, April 2014 on temperature and density reconstruction of coronal structures. The technique which is based on Python is applied to polar plumes observed in SDO/AIA images.
http://www.spaceweather.eu/en/repository/show?id=517
Presentation given at the workshop Tomography and 3D reconstruction in space science, April 2014 about the work performed at Vision Lab ASTRA: All Scale Tomographic Reconstruction Antwerp.
http://www.spaceweather.eu/en/repository/show?id=518
Presentation given at the workshop Tomography and 3D reconstruction in space science, April 2014 on how the 2D energy spectra of electron above the auroral arcs are estimated. The technique uses optical ground-based observations done with ALIS, Auroral Large imaging System.
http://www.spaceweather.eu/en/repository/show?id=519
Raising awareness and get people outside the scientific community involved in space weather becomes more and more an issue. To cross the borders of our science project eHEROES, we came up with a tide communication plan that answers the questions: what, to whom, why, when, how, by whom? The key is to link the audience and your message in a correct way. Both formal and informal education are on our tool list.
This is an invited poster presented at EGU, 2014 in the session
Raising and maintaining awareness of our local space weather: education and public outreach.
eHEROES, Environment for Human Exploration and RObotic Experimentation in Space is an FP7 project (n° 284461, www.eheroes.eu).
http://www.spaceweather.eu/en/repository/show?id=520