
The Solar-Terrestrial Centre of Excellence (STCE) is a collaborative network of the Belgian Institute for Space Aeronomy, the Royal Observatory of Belgium and the Royal Meteorological Institute of Belgium.
|
Published by the STCE - this issue : 23 May 2014. The Solar-Terrestrial Centre of Excellence (STCE) is a collaborative network of the Belgian Institute for Space Aeronomy, the Royal Observatory of Belgium and the Royal Meteorological Institute of Belgium. |
| Archive of the newsletters | Subscribe to this newsletter by mail |
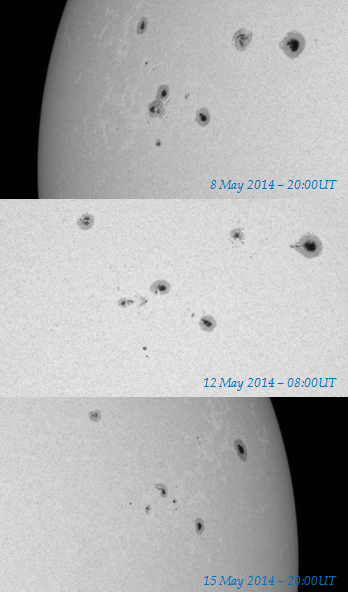
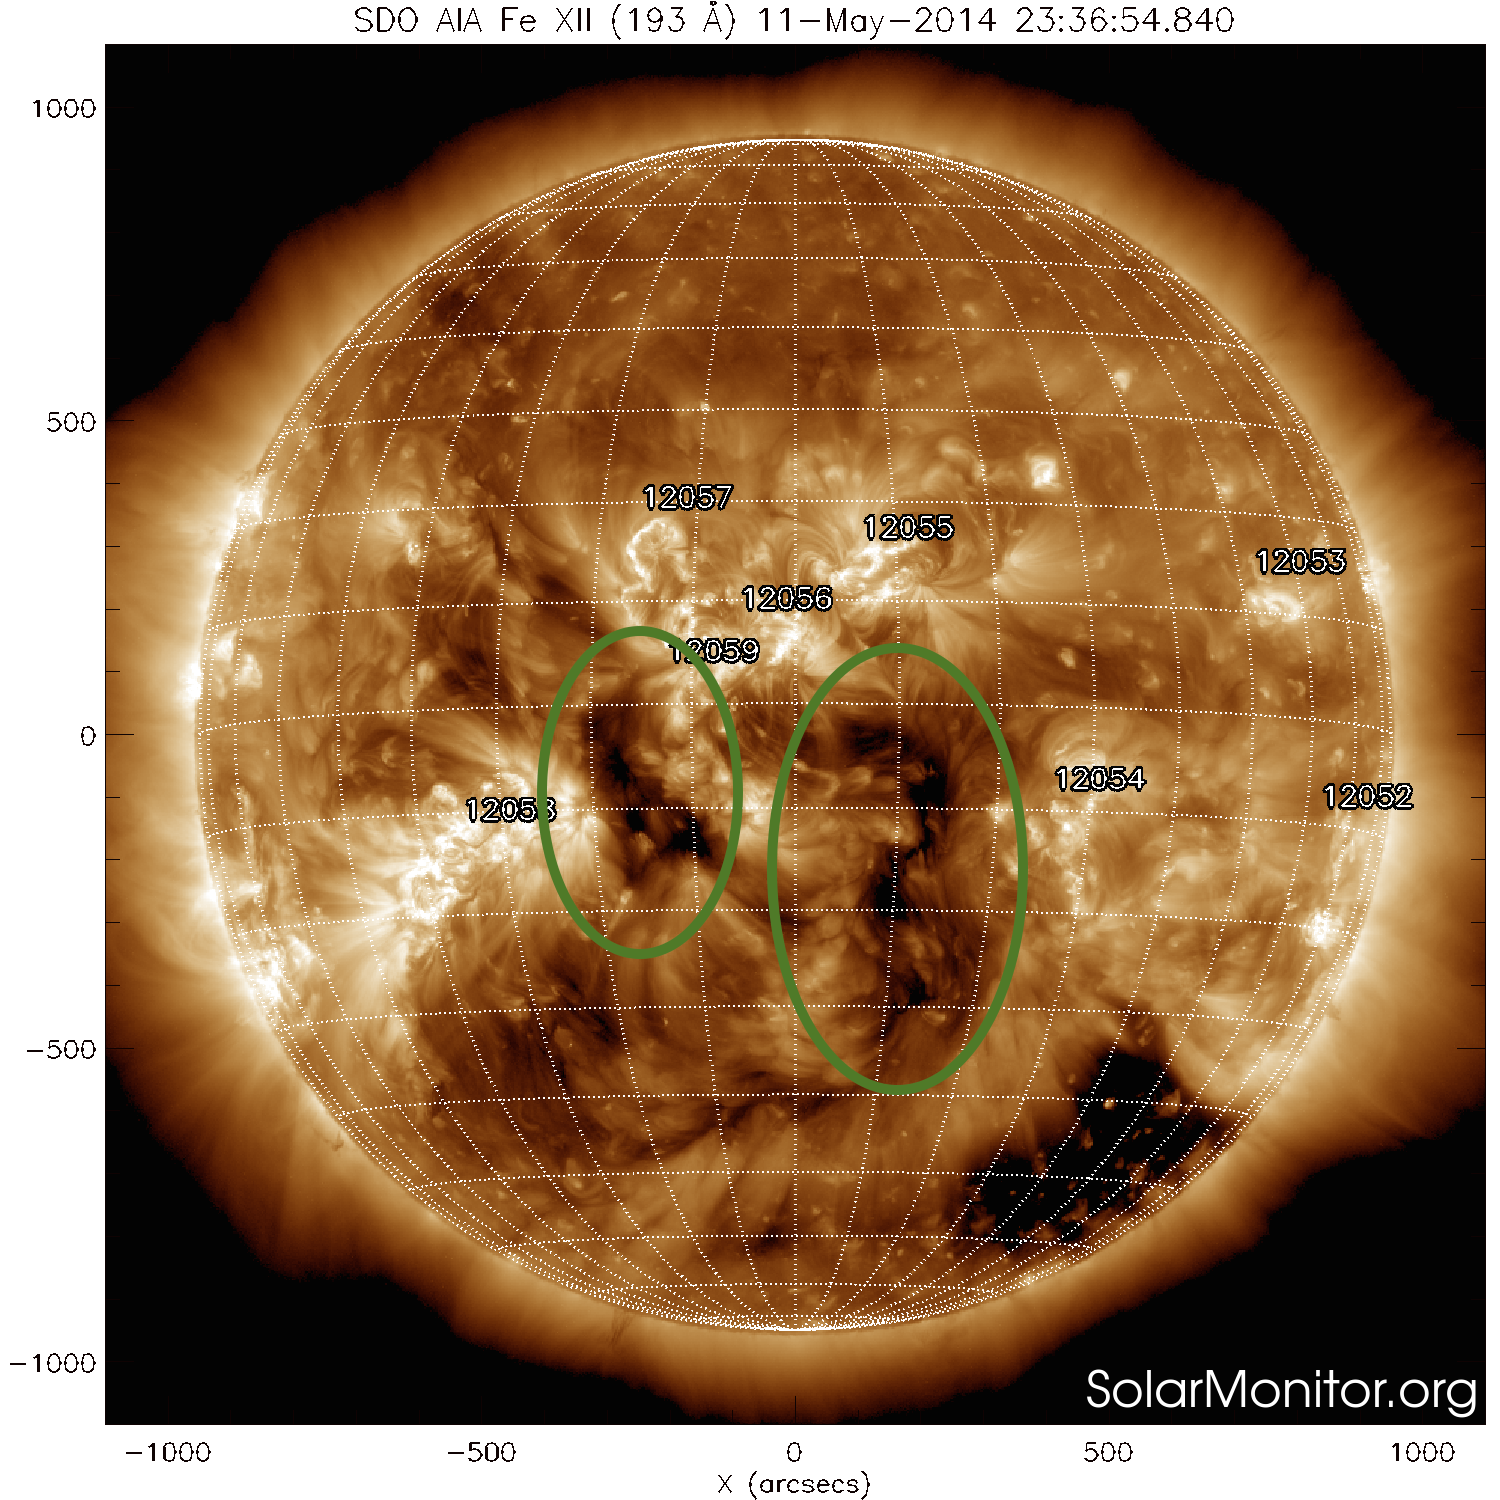
From 5 till 18 May, sunspot Group NOAA 2056 made its transit over the solar disk. This group was not especially big, but initially had a complex trailing sunspot section that resulted in an M5 flare on 8 May (see previous Newsletter). Over the next few days, the group gradually simplified and almost completely disintegrated.
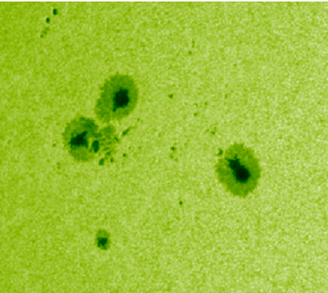
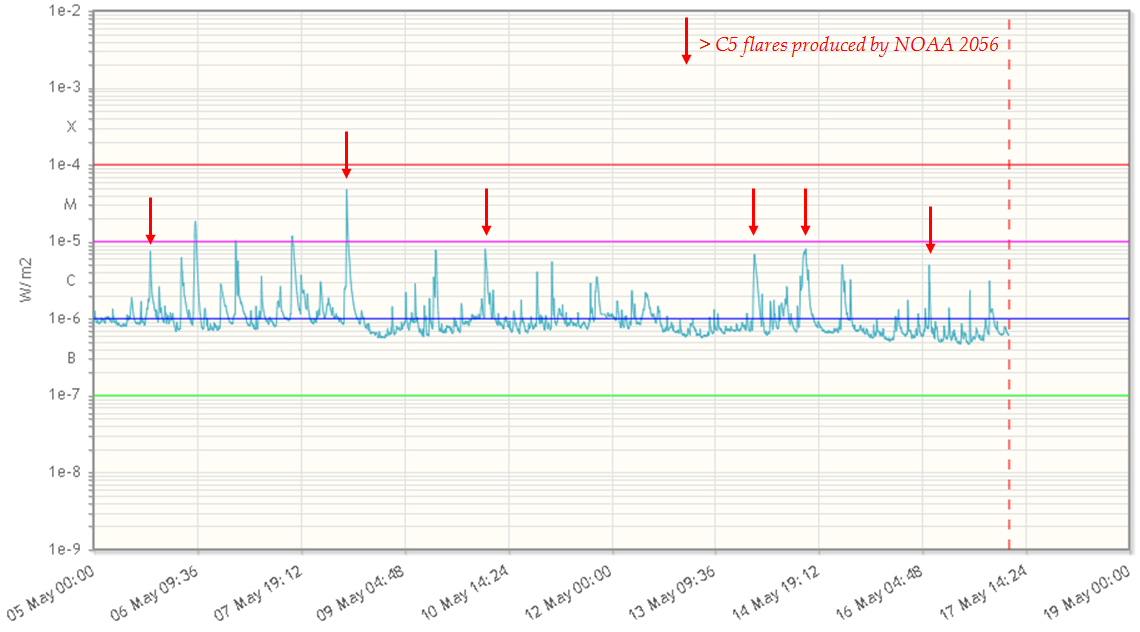
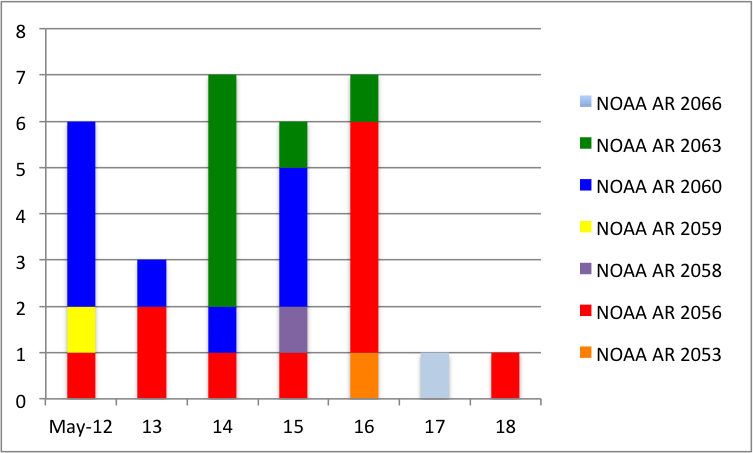
During the last 2 weeks, this active region certainly left its footprint on the solar activity. Aside its M5 flare, it also produced 5 moderate C-class flares (larger than C5). As can be seen from the xray flaring activity underneath, this graph would have had quite a different outlook without NOAA 2056's flares.
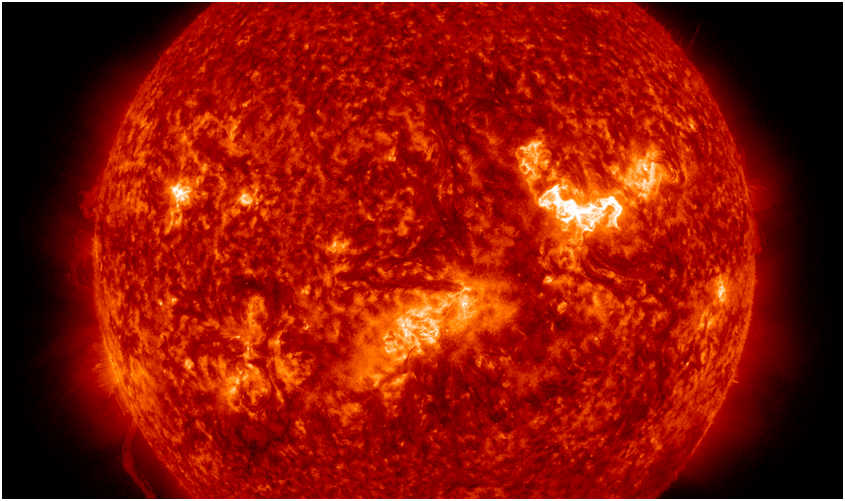
One of the more pertinent C-class flares took place on 14 May, when NOAA 2056 produced a C8 flare. It was a lengthy event, starting at 12:59UT, reaching its maximum only on 15:04UT, and ending at 15:28UT. Most of the flaring activity took place along the magnetic inversion line to the north of the region near the remainder of the trailing portion, which at that time had the same magnetic polarity as the main leading spot. In the course of the event, the most intense areas of the flare shifted from east to west. Part of a small filament located to the south of the region seems to have been ejected, but no coronal mass ejection was observed.
The movie at http://youtu.be/LI1t1wJwCpY first shows the evolution of the region from 8 till 15 August (white light, green filter), and an outlook in white light of the region on 14 May. Then follows the evolution of the C8 flare, first in SDO/AIA 304 (transition region), AIA 171 (upper transition region and lower corona), then a combination of the two, and ending with the AIA 304 movie overlaid on the magnetogram.
Credits - Data and imagery were taken from SDO (http://sdo.gsfc.nasa.gov/data/aiahmi/) and GOES (http://www.swpc.noaa.gov/ftpdir/indices/events/). Tools used were STAFF (http://sun-ts-dev.oma.be/) and (J)Helioviewer (http://helioviewer.org/).
Solar flare activity remained low during the week.
In order to view the activity of this week in more detail, we suggest to go to the following website from which all the daily (normal and difference) movies can be accessed: http://proba2.oma.be/ssa
This page also lists the recorded flaring events.
A weekly overview movie can be found here (SWAP week 216).
http://proba2.oma.be/swap/data/mpg/movies/WeeklyReportMovies/WR216_May12_May18/weekly_movie_2014_05_12.mp4
Details about some of this week's events, can be found further below.
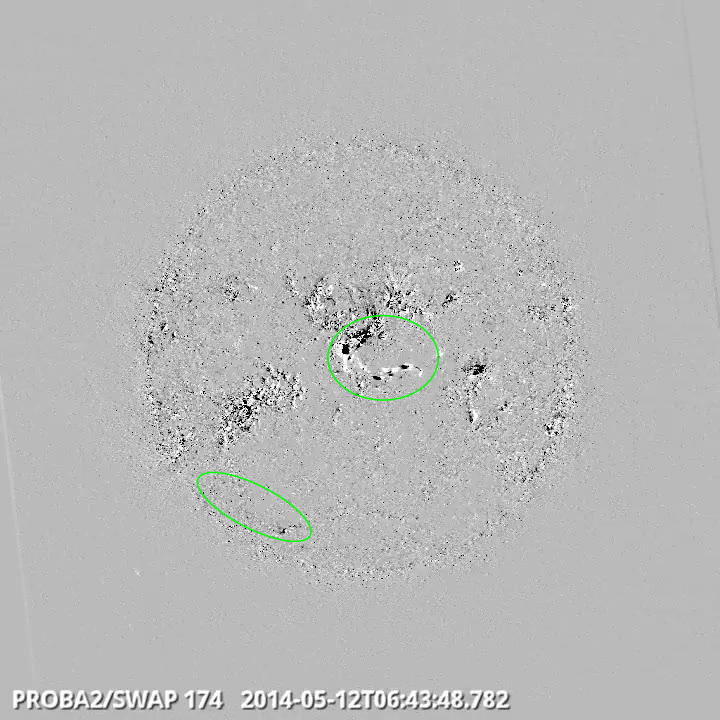
Flows in the centre @ 06:43 SWAP difference image
Find a movie of the events here (SWAP difference movie)
http://proba2.oma.be/swap/data/mpg/movies/20140512_swap_diff.mp4
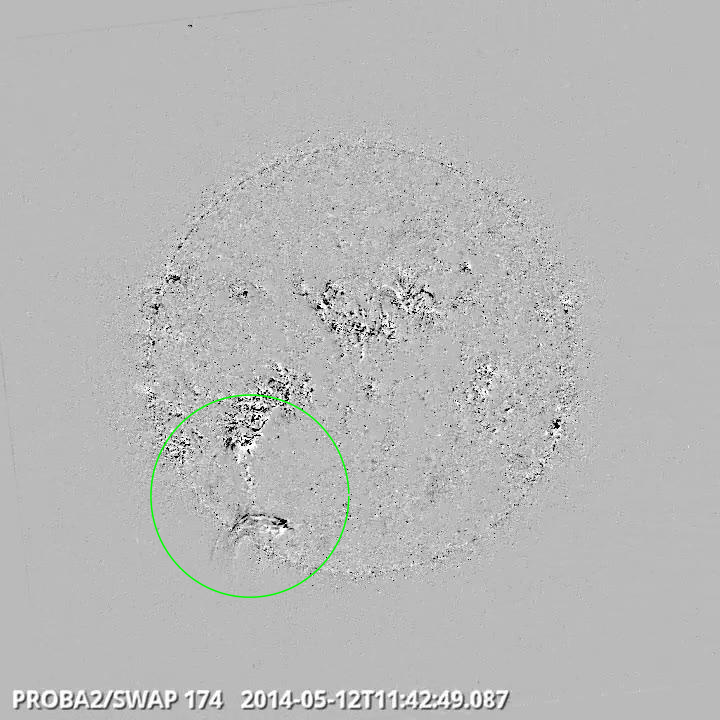
Eruption on the south east quad @ 11:42 SWAP difference image
Find a movie of the events here (SWAP difference movie)
http://proba2.oma.be/swap/data/mpg/movies/20140512_swap_diff.mp4
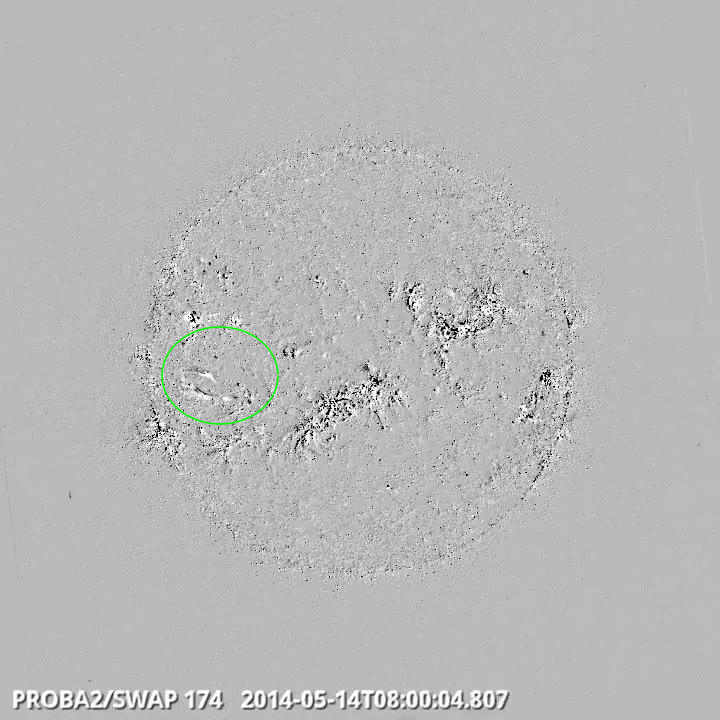
Flow on south east quad @ 08:00 SWAP difference image
Find a movie of the event here (SWAP difference movie)
http://proba2.oma.be/swap/data/mpg/movies/20140514_swap_diff.mp4
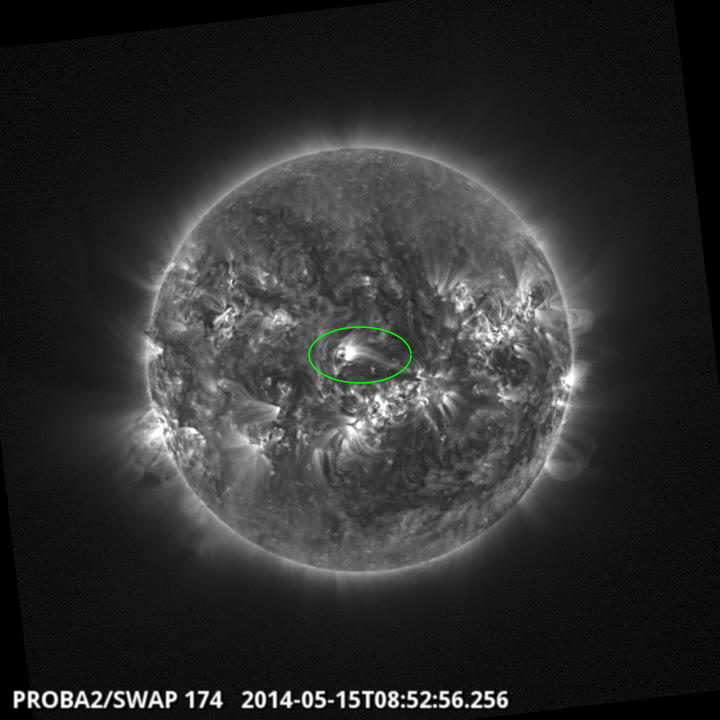
Brightening in the centre @ 08:52 SWAP difference image
Find a movie of the event here (SWAP movie)
http://proba2.oma.be/swap/data/mpg/movies/20140515_swap_movie.mp4
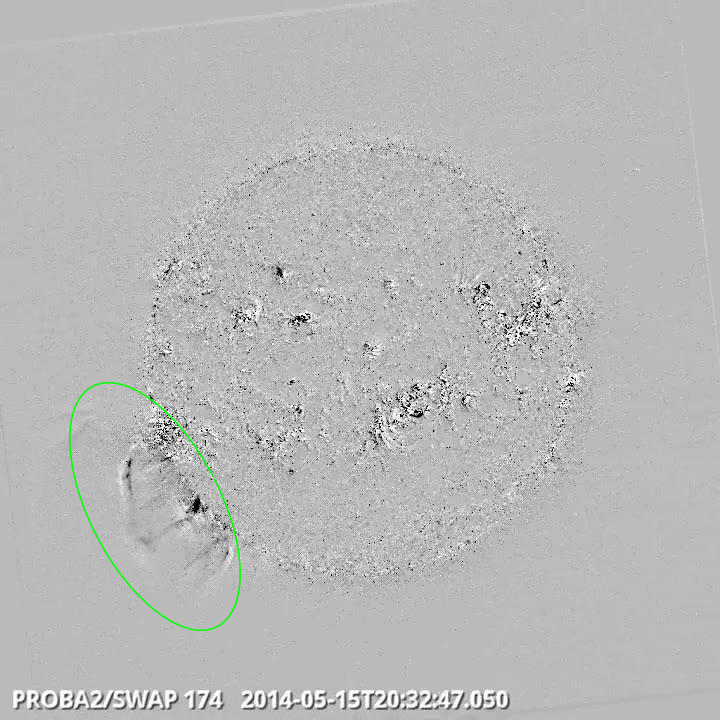
Eruption on the east limb @ 20:32 SWAP difference image
Find a movie of the event here (SWAP difference movie)
http://proba2.oma.be/swap/data/mpg/movies/20140515_swap_diff.mp4
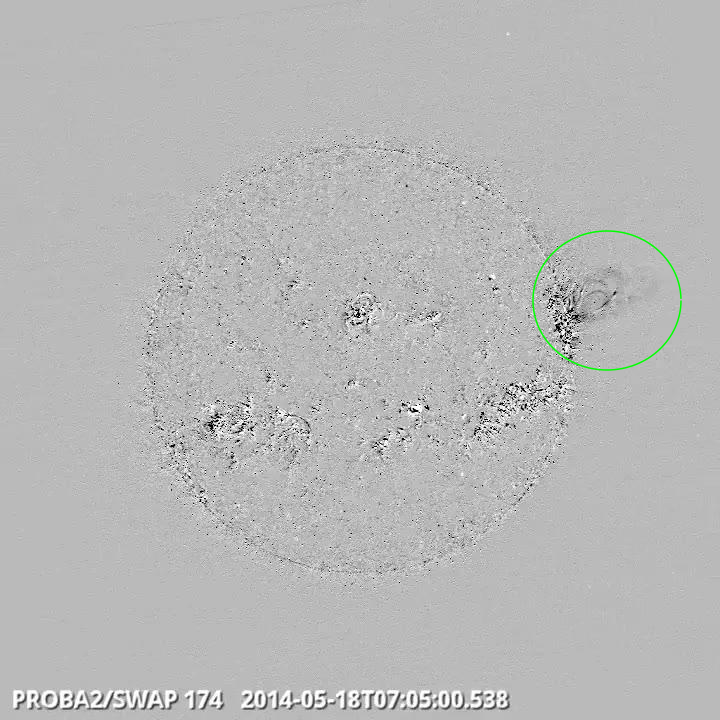
Eruption on the west limb @ 07:05 SWAP difference image
Find a movie of the event here (SWAP difference movie)
http://proba2.oma.be/swap/data/mpg/movies/20140518_swap_diff.mp4
31 C-class flares linked to an active region were reported by GOES. The strongest flare of the week was C8.3 flare peaking at 15:04 UT on May 14. The flare originated from the Catania sunspot group 43 (NOAA AR 2056) which produced 11 flares. No clear signatures of a CME associated with this flare were observed.
Only one partial halo CME was observed this week. The CME was first seen in the SOHO LASCO C2 field of view at 20:48 UT on May 15, had angular width of about 180 degrees and a projected plane of the sky speed of about 600 km/s. The CME source region was situated just behind the east solar limb and the CME was therefore not Earth directed.
Two small equatorial coronal holes were observed this week. First narrow, small coronal hole reached the central meridian on May 11 and the second one on May 12.
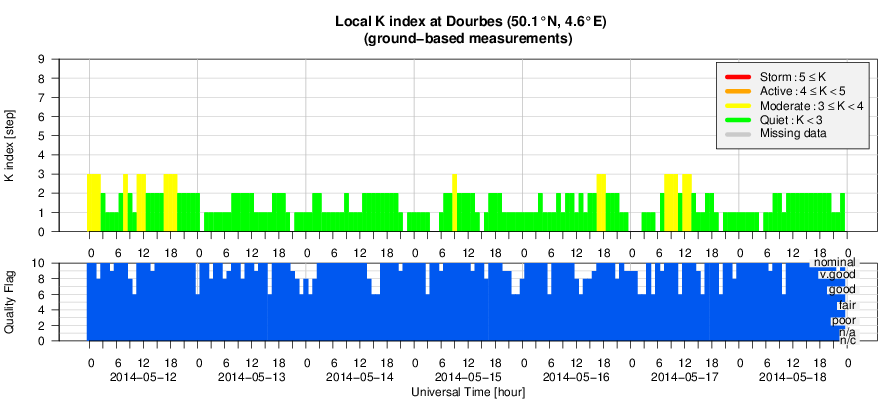
The geomagnetic conditions were mostly quiet.
The solar wind speed was about 450 km/s during the first day of the week and very stable during the rest of the week with the value of about 350 km/s, this is the yellow line in the fourth panel of the ACE graph below. The interplanetary magnetic field magnitude was varying between 2 and 7 nT.
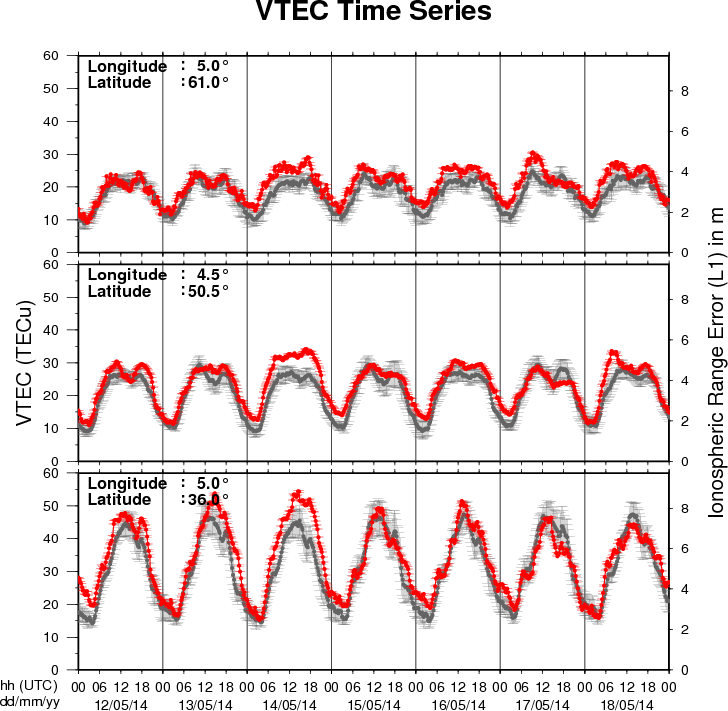
The figure shows the time evolution of the Vertical Total Electron Content (VTEC) (in red) during the last week at three locations:
a) in the northern part of Europe(N61°, 5°E)
b) above Brussels(N50.5°, 4.5°E)
c) in the southern part of Europe(N36°, 5°E)
This figure also shows (in grey) the normal ionospheric behaviour expected based on the median VTEC from the 15 previous days.
The VTEC is expressed in TECu (with TECu=10^16 electrons per square meter) and is directly related to the signal propagation delay due to the ionosphere (in figure: delay on GPS L1 frequency).
The Sun's radiation ionizes the Earth's upper atmosphere, the ionosphere, located from about 60km to 1000km above the Earth's surface.The ionization process in the ionosphere produces ions and free electrons. These electrons perturb the propagation of the GNSS (Global Navigation Satellite System) signals by inducing a so-called ionospheric delay.
See http://stce.be/newsletter/GNSS_final.pdf for some more explanations ; for detailed information, see http://gnss.be/ionosphere_tutorial.php
Start : 2014-06-10 - End : 2014-06-11
The STCE workshop 'Inter-Calibration and Degradation of EUV
Instruments' aims at understanding the differences observed between
the various instruments observing in the SXR-EUV range and at
analyzing the ageing effects that affect their results. It targets
imagers as well as spectrometers and photometers.
The workshop will be followed by two days of working sessions
(June 12-13) organized by the Solar EUV Irradiance Working Group
(also supported by the STCE). These working sessions are in the
continuity of similar events organized in 2011, 2012 and 2013, but
they are open to new participants and you are welcome to join if
you are interested.
Website:
http://www.stce.be/euvworkshop2014/
Start : 2014-06-19 - End : 2014-06-20
During the summer of 2014 DTU Space will host the 3rd Swarm
Science Meeting, sponsored by the European Space Agency, ESA
. This meeting will take place at
the IDA Conference Centre in Copenhagen on June 19th to 20th 2014
and is open to the science community at large.
Website:
http://congrexprojects.com/2014-events/Swarm/home
Presentation given at the STCE Workshop Tomography and 3D reconstruction in space science, April 2014 on 3D CME reconstruction: constraints, methods and an application.
http://www.spaceweather.eu/en/repository/show?id=516
Presentation given at the workshop Tomography and 3D reconstruction in space science, April 2014 on temperature and density reconstruction of coronal structures. The technique which is based on Python is applied to polar plumes observed in SDO/AIA images.
http://www.spaceweather.eu/en/repository/show?id=517
Presentation given at the workshop Tomography and 3D reconstruction in space science, April 2014 about the work performed at Vision Lab ASTRA: All Scale Tomographic Reconstruction Antwerp.
http://www.spaceweather.eu/en/repository/show?id=518
Presentation given at the workshop Tomography and 3D reconstruction in space science, April 2014 on how the 2D energy spectra of electron above the auroral arcs are estimated. The technique uses optical ground-based observations done with ALIS, Auroral Large imaging System.
http://www.spaceweather.eu/en/repository/show?id=519
Raising awareness and get people outside the scientific community involved in space weather becomes more and more an issue. To cross the borders of our science project eHEROES, we came up with a tide communication plan that answers the questions: what, to whom, why, when, how, by whom? The key is to link the audience and your message in a correct way. Both formal and informal education are on our tool list.
This is an invited poster presented at EGU, 2014 in the session
Raising and maintaining awareness of our local space weather: education and public outreach.
eHEROES, Environment for Human Exploration and RObotic Experimentation in Space is an FP7 project (n° 284461, www.eheroes.eu).
http://www.spaceweather.eu/en/repository/show?id=520
Presentation given at the STCE workshop Long Term Solar changes about the variation of the TSI measured from space by past and present missions, e.g. Diarad/Sovim. These data are used to reconstruct the TSI up to 400 years ago.
http://www.spaceweather.eu/en/repository/show?id=521
Presentation given at the STCE workshop Long Term Solar Changes about the revision of the efficiency correction factor used for Sova-P TSI data series.
http://www.spaceweather.eu/en/repository/show?id=522
Presentation given at the STCE workshop Long Term Solar changes about Solar Solspec on board of the ISS.
http://www.spaceweather.eu/en/repository/show?id=523
Presentation given at the STCE workshop Long Term Solar changes on the influence of long term solar changes on parameters describing the earth magnetosphere, cosmic rays and the ionosphere.
http://www.spaceweather.eu/en/repository/show?id=524
Presentation given at the STCE workshop Long Term Solar changes about the radiation recorded by the Bolometric Oscillation sensor aboard the PICARD micro satellite.
http://www.spaceweather.eu/en/repository/show?id=525