
The Solar-Terrestrial Centre of Excellence (STCE) is a collaborative network of the Belgian Institute for Space Aeronomy, the Royal Observatory of Belgium and the Royal Meteorological Institute of Belgium.
|
Published by the STCE - this issue : 13 Jun 2014. The Solar-Terrestrial Centre of Excellence (STCE) is a collaborative network of the Belgian Institute for Space Aeronomy, the Royal Observatory of Belgium and the Royal Meteorological Institute of Belgium. |
| Archive of the newsletters | Subscribe to this newsletter by mail |
Solar filaments are clouds of ionized gas above the solar surface squeezed between magnetic regions of opposite polarity. Being cooler and denser than the surrounding plasma, they appear as dark lines when seen on the solar disk using special filters. At the solar limb, the same features shine bright and are called prominences.
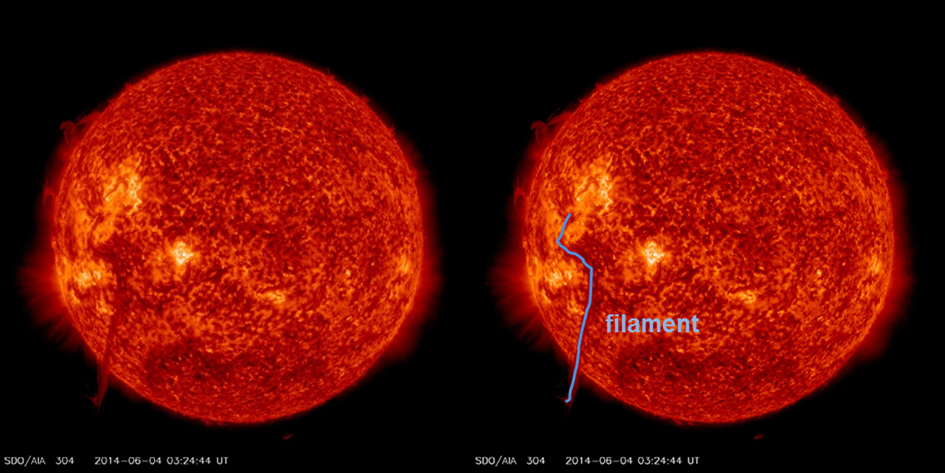
Early June, a long filament rounded the east limb, towering 150.000 km over the solar surface. Because of its length, about 1.5 times the Earth-Moon distance, space weather forecasters knew they had to keep an eye on this feature. Indeed, such long filaments are known for becoming unstable and may eventually erupt. Exactly this scenario unfolded on 4 June when part of the filament slingshot itself into space at an estimated speed of around 500 km/s. A movie of the event can be seen at http://youtu.be/zMX6xpabhtc
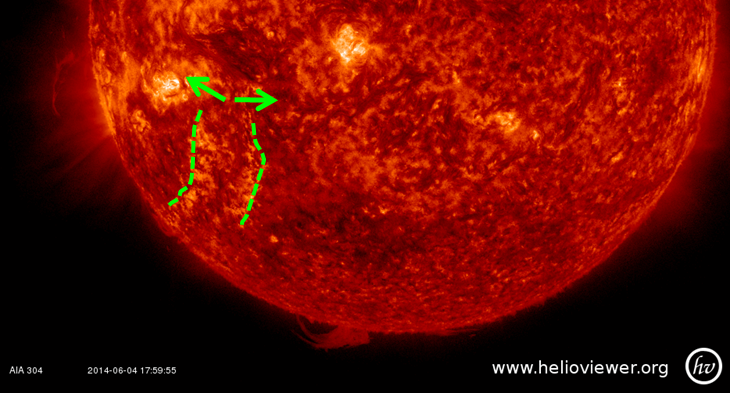
The eruption was not associated to an obvious x-ray flare, but a disturbance was noted in the EUV imagery, parallel to the original position of the erupted filament on both the east and west side (see annotated image above). The disturbance propagated through the corona at a speed of 2-5 km/s. Just as the expanding flare ribbons ("parallel ribbons") and the post-flare coronal loops that often can be seen after a solar flare, also this phenomenon is an effect of the reconnection higher up in the solar atmosphere. The charged particles get accelerated towards the denser inner solar atmosphere, where they collide with other particles and heat the local chromospheric environment and make it evaporate. It is not an EIT wave, characteristics of which were described in a previous newsletter (see http://stce.be/news/241/welcome.html for more details). The footpoints of some faint coronal loops can be seen embedded in the expanding disturbance in the combo movies.
Dubbed in the popular literature as a "canyon-of-fire", many of these features have been observed during this solar cycle. Typical examples include the events of 24 and 29 September 2013 (see http://stce.be/news/218/welcome.html ), and the one from 24 February 2012 (see http://stce.be/news/173/welcome.html ).
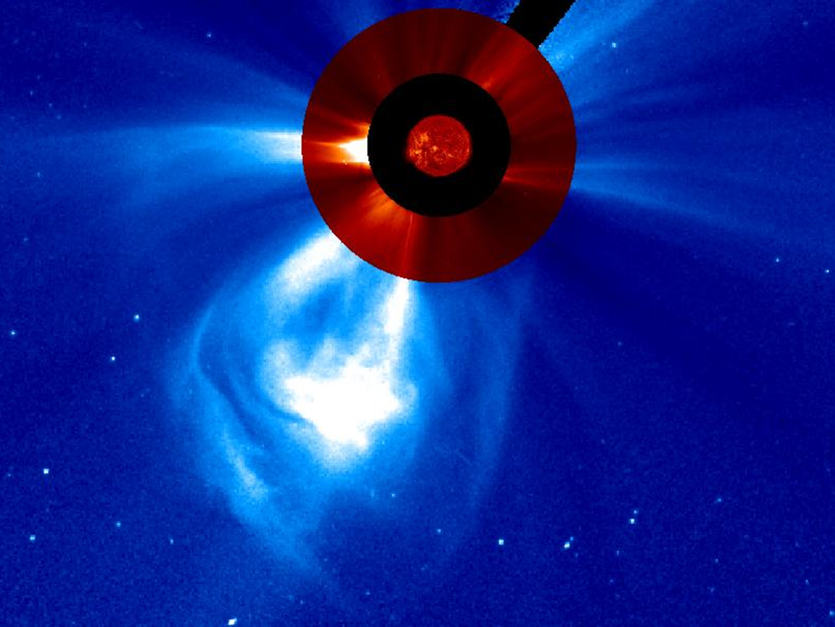
The eruption was associated to a coronal mass ejection (CME), which was actually an asymmetrical halo, meaning that despite the bulk was ejected south of the Sun-Earth plane, Earth could still expect a glancing blow from this CME. And so it happened, as a shock was observed in the solar wind parameters during the afternoon of 7 June. Short-lived negative excursions in the magnetic field strength were observed (up to -17 nT), leading to a moderate geomagnetic storm on 8 June.
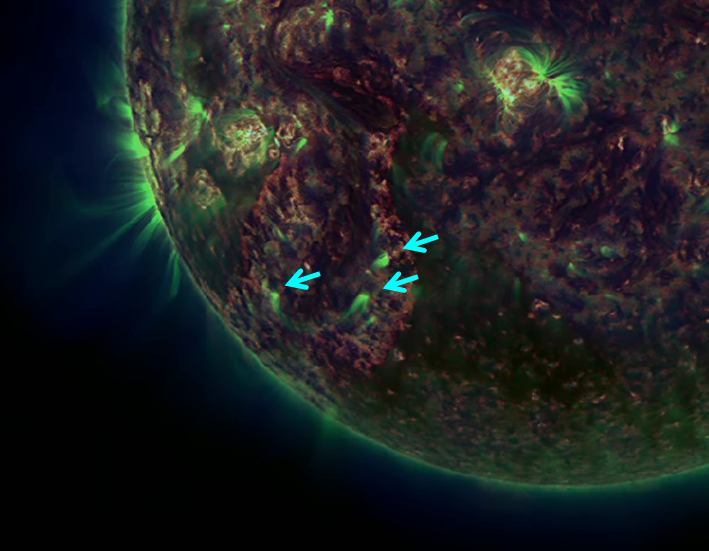
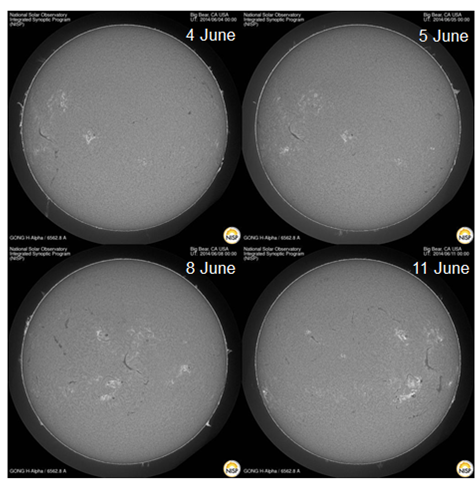
As of this writing, the filament seemed to be in the process of gradually reshaping itself. This can be seen in these images from the GONG/NISP network, displaying the activity in the chromosphere (lower atmosphere of the Sun). So far, no further eruptions from this filament have been observed.
Credits – Imagery and data were taken from SDO (http://sdo.gsfc.nasa.gov/data/aiahmi/), GONG H-alpha Network (http://halpha.nso.edu/), SOHO (http://sohodata.nascom.nasa.gov/cgi-bin/data_query), and (J)Helioviewer (http://helioviewer.org/).
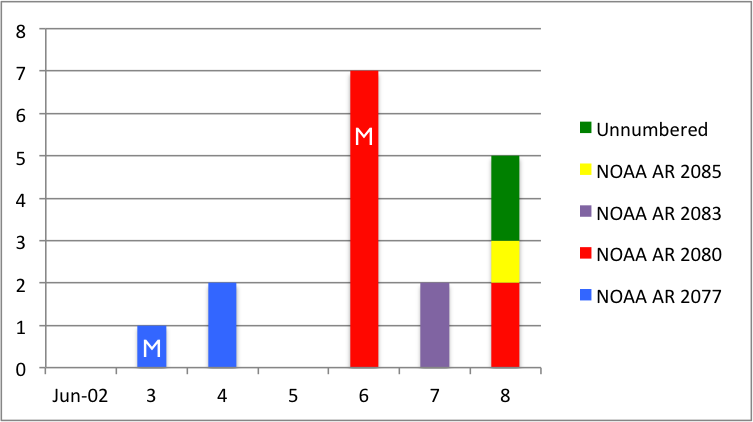
In total 4-class and 2 M-class flares were observed by the GOES X-ray instrument. Flaring activity was dominated by NOAA AR 2077 in the first half of the week, while NOAA AR 2080 took the leading role in the second half of the week, accompanied by NOAA ARs 2083 and 2085. NOAA AR 2077 produced 2 C-class flares and one impulsive M-class flare (M1.3) peaking at 4:09UT on 3 June. This region was at that moment with a beta-gamma configuration the most complex one on the disk. NOAA AR 2080 produced several B- and C-class flares, as well as an M1.4 flare, peaking at 19:31 on 6 June. NOAA AR 2080 for short time had a delta component in the magnetic configuration of its photospheric field, while NOAA ARs 2082 and 2085 also were beta-gamma regions.
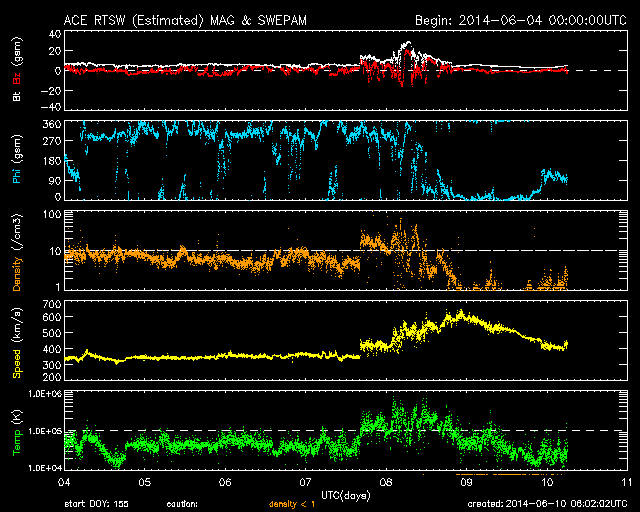
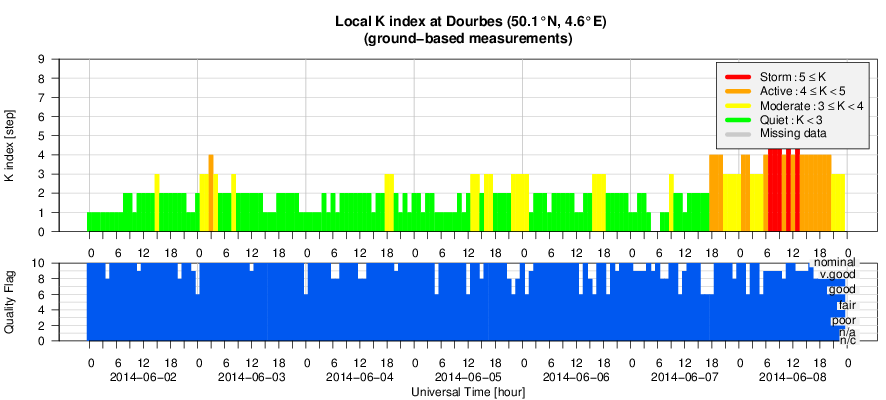
Slow solar wind conditions were observed during most of the week, with a solar wind speed between 250 and 350 km/s and the magnitude of the interplanetary magnetic field (IMF) lower then 9 nT. Geomagnetic conditions were quiet to unsettled. These conditions changed at the shock arrival, observed by ACE at 16:10 UT on 7 June, related to an Earth-directed component of the 4 June CME. The magnitude of the IMF reached a maximum of 29 nT at 6:55 UT on 8 June. The Bz-component was fluctuating between negative and positive values from -15 to + 21 nT. The solar wind speed increased to 550 km/s. Local K-index at Dourbes went to K=5 and estimated NOAA Kp even reached K=6 on the UT morning of 8 June.
| DAY | BEGIN | MAX | END | LOC | XRAY | OP | 10CM | TYPE | Cat | NOAA |
| 03 | 0358 | 0409 | 0417 | M1.3 | N | 65 | 2077 | |||
| 06 | 1926 | 1931 | 1933 | S12E25 | M1.4 | SF | VI/2III/2 | 69 | 2080 |
| LOC: approximate heliographic location | TYPE: radio burst type |
| XRAY: X-ray flare class | Cat: Catania sunspot group number |
| OP: optical flare class | NOAA: NOAA active region number |
| 10CM: peak 10 cm radio flux |
Solar flare activity fluctuated between very low and moderate this week. An M1.3-flare was recorded on Tuesday, and an M1.4 on Friday. On Wednesday, a big prominence erupted in the south-east quadrant (see below).
In order to view the activity of this week in more detail, we suggest going to the following website from which all the daily (normal and difference) movies can be accessed: http://proba2.oma.be/ssa.
This page also lists the recorded flaring events.
A weekly overview movie can be found here: http://proba2.oma.be/swap/data/mpg/movies/WeeklyReportMovies/WR219_Jun02_Jun08/weekly_movie_2014_06_02.mp4 (SWAP week 219).
Details about some of this week’s events can be found further below.
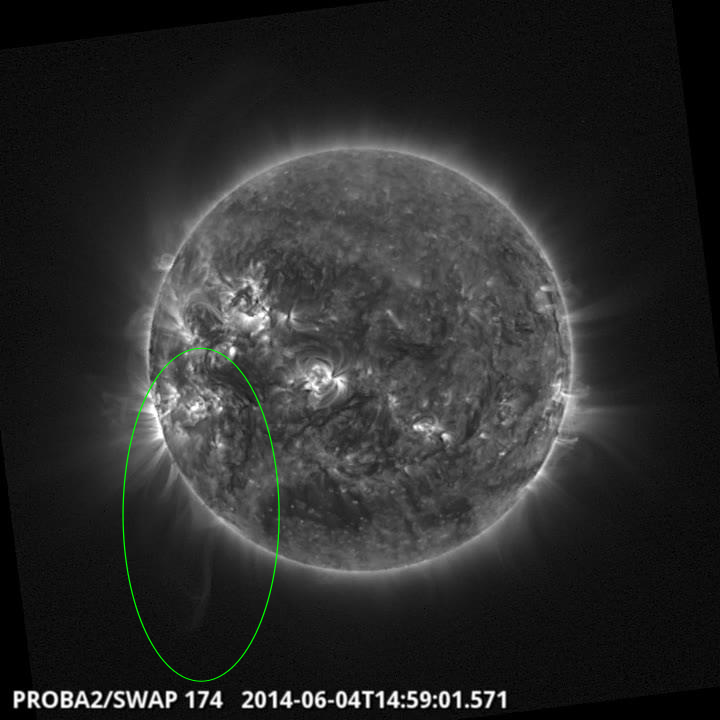
Big Prominence Eruption @ 14:46 - SWAP image
The daily SWAP movie (http://proba2.oma.be/swap/data/mpg/movies/20140604_swap_movie.mp4) shows the eruption quite clearly, as well as the follow-on, quite impressive expanding flare ribbons, continuing well into the morning of June 5th.
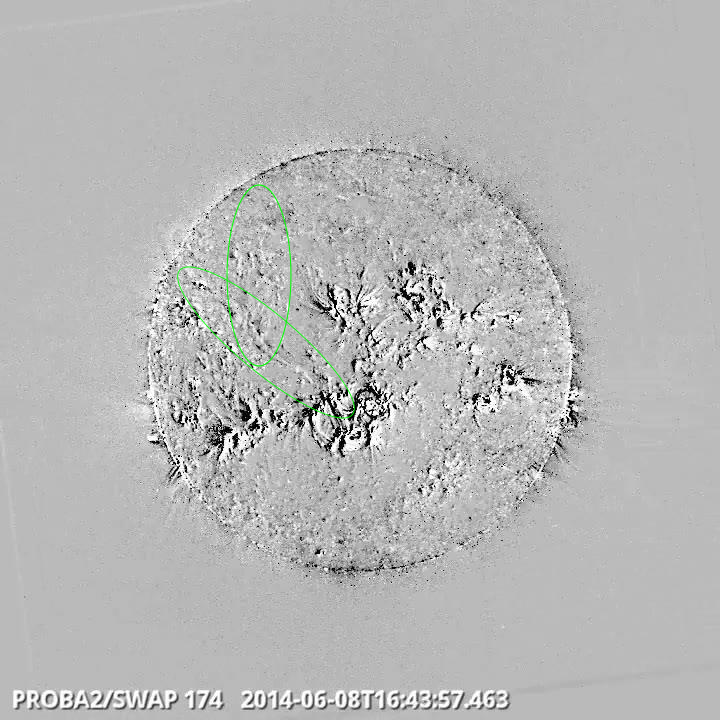
Double (?) Prominence Eruption in North East Quadrant @ 16:43 - SWAP difference image
A movie of this event: http://proba2.oma.be/swap/data/mpg/movies/WeeklyReportMovies/WR219_Jun02_Jun08/20140608_PromEruptFlows_NE_Quad_1459_SWAPdiff.mp4
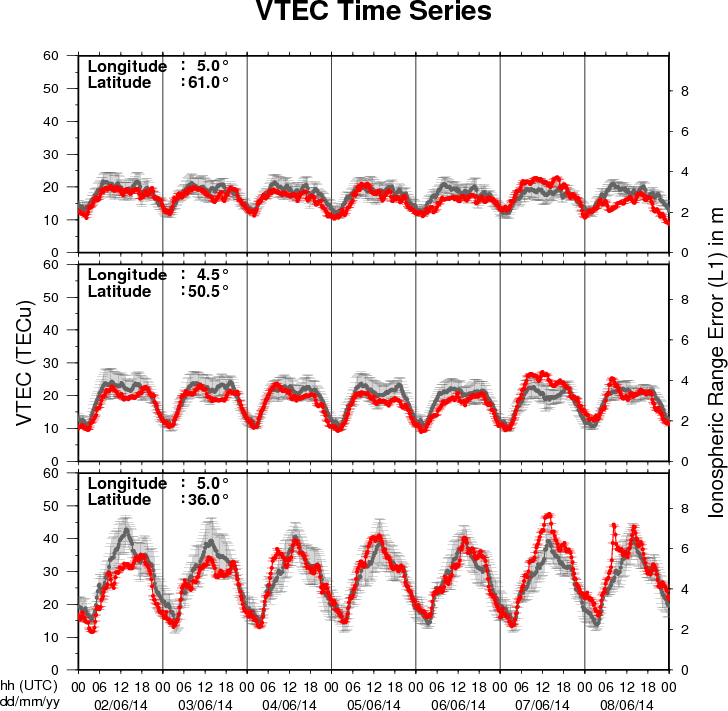
The figure shows the time evolution of the Vertical Total Electron Content (VTEC) (in red) during the last week at three locations:
a) in the northern part of Europe(N61°, 5°E)
b) above Brussels(N50.5°, 4.5°E)
c) in the southern part of Europe(N36°, 5°E)
This figure also shows (in grey) the normal ionospheric behaviour expected based on the median VTEC from the 15 previous days.
The VTEC is expressed in TECu (with TECu=10^16 electrons per square meter) and is directly related to the signal propagation delay due to the ionosphere (in figure: delay on GPS L1 frequency).
The Sun's radiation ionizes the Earth's upper atmosphere, the ionosphere, located from about 60km to 1000km above the Earth's surface.The ionization process in the ionosphere produces ions and free electrons. These electrons perturb the propagation of the GNSS (Global Navigation Satellite System) signals by inducing a so-called ionospheric delay.
See http://stce.be/newsletter/GNSS_final.pdf for some more explanations ; for detailed information, see http://gnss.be/ionosphere_tutorial.php
Presentation given at the STCE workshop Long Term Solar changes about the variation of the TSI measured from space by past and present missions, e.g. Diarad/Sovim. These data are used to reconstruct the TSI up to 400 years ago.
http://www.spaceweather.eu/en/repository/show?id=521
Presentation given at the STCE workshop Long Term Solar Changes about the revision of the efficiency correction factor used for Sova-P TSI data series.
http://www.spaceweather.eu/en/repository/show?id=522
Presentation given at the STCE workshop Long Term Solar changes about Solar Solspec on board of the ISS.
http://www.spaceweather.eu/en/repository/show?id=523
Presentation given at the STCE workshop Long Term Solar changes on the influence of long term solar changes on parameters describing the earth magnetosphere, cosmic rays and the ionosphere.
http://www.spaceweather.eu/en/repository/show?id=524
Presentation given at the STCE workshop Long Term Solar changes about the radiation recorded by the Bolometric Oscillation sensor aboard the PICARD micro satellite.
http://www.spaceweather.eu/en/repository/show?id=525
Start : 2014-06-19 - End : 2014-06-20
During the summer of 2014 DTU Space will host the 3rd Swarm
Science Meeting, sponsored by the European Space Agency, ESA
. This meeting will take place at
the IDA Conference Centre in Copenhagen on June 19th to 20th 2014
and is open to the science community at large.
Website:
http://congrexprojects.com/2014-events/Swarm/home