
The Solar-Terrestrial Centre of Excellence (STCE) is a collaborative network of the Belgian Institute for Space Aeronomy, the Royal Observatory of Belgium and the Royal Meteorological Institute of Belgium.
|
Published by the STCE - this issue : 26 Jun 2014. The Solar-Terrestrial Centre of Excellence (STCE) is a collaborative network of the Belgian Institute for Space Aeronomy, the Royal Observatory of Belgium and the Royal Meteorological Institute of Belgium. |
| Archive of the newsletters | Subscribe to this newsletter by mail |
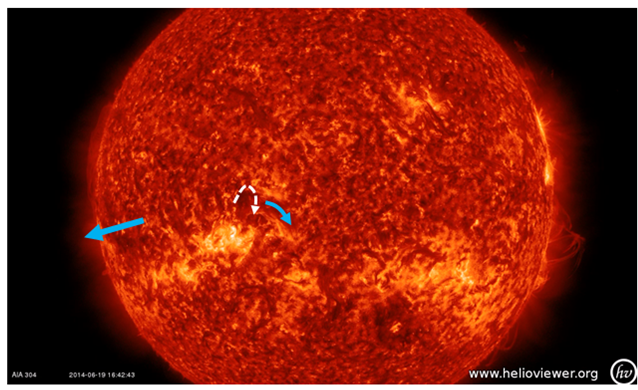
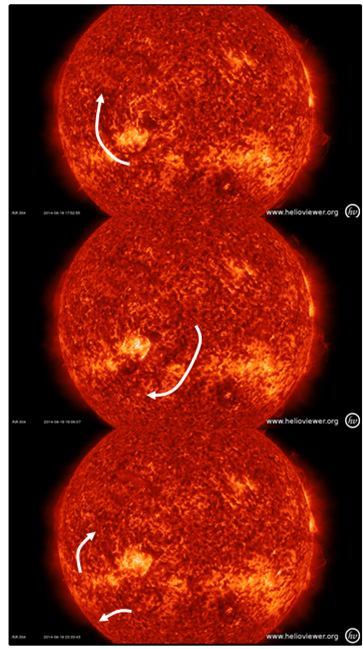
Solar filaments are clouds of ionized gas above the solar surface squeezed between magnetic regions of opposite polarity. Being cooler and denser than the surrounding plasma, they appear as dark lines when seen on the solar disk using special filters. On 19 June, a filament north of sunspot region NOAA 2093 became unstable and swirled away from the Sun.
Credits: Images were taken from the GONG H-alpha Network (http://halpha.nso.edu/), SDO/AIA (http://sdo.gsfc.nasa.gov/data/aiahmi/), and (J)Helioviewer (http://helioviewer.org/).
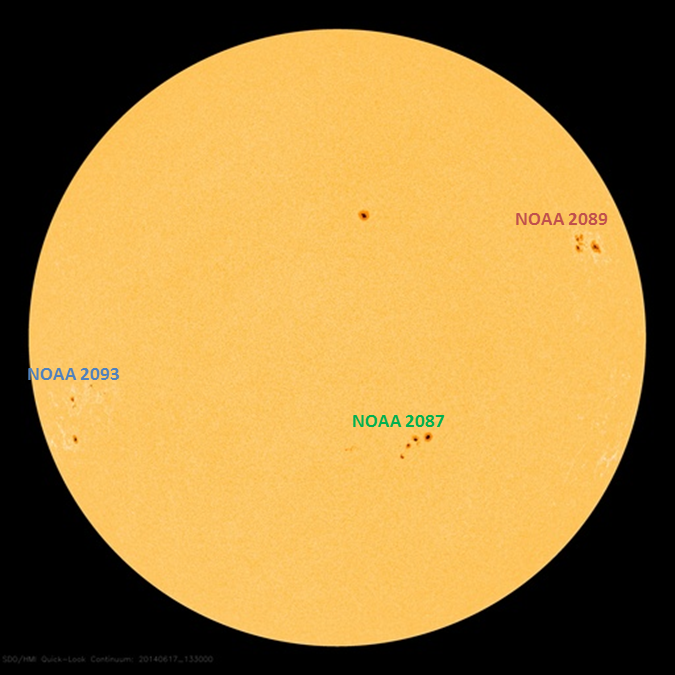
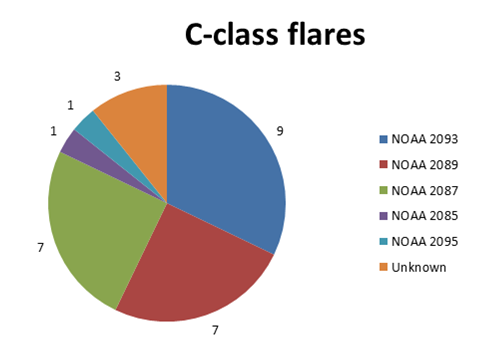
Eight sunspot groups were reported by NOAA during the week. The most flare productive were (corresponding Catania numbers are shown in brackets) NOAA Active Regions 2087 (81), 2089 (82), and 2093 (89 and 90).
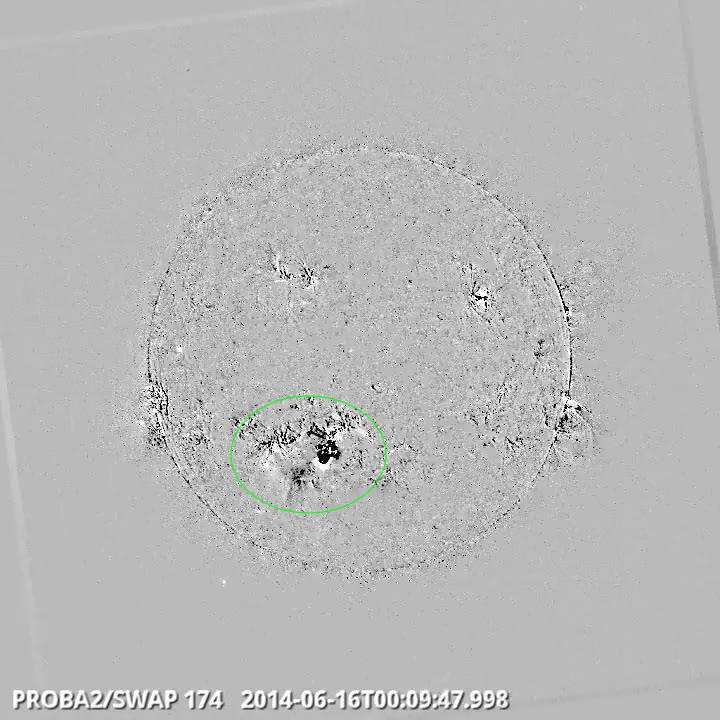
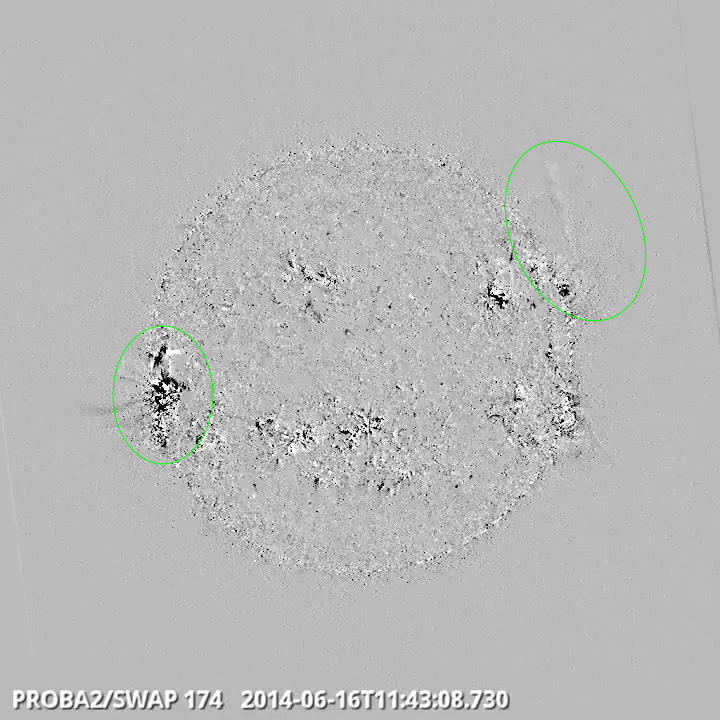
NOAA 2087 (81) produced the strongest flare (M1.0) peaking at 00:01UT on 16 June, but starting at 23:50UT on 15 June and thus technically belonging to the previous period. No associated coronal mass ejection (CME) was detected by SOHO/LASCO. In total, 28 C-class flares were recorded, the strongest being a long duration C8 flare on 16 June produced by NOAA 2085 from behind the west limb. Over the period, both the soft X-ray flux background and the flaring activity then gradually decreased, and on 22 June only B-class flares were observed.
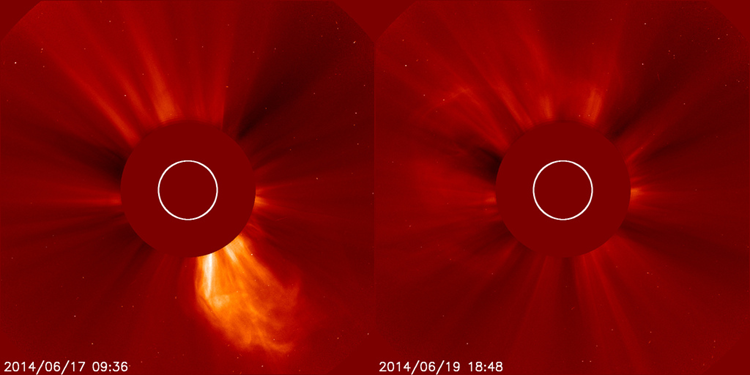
Four partial halo CMEs were detected during the week.
The first and best visible started to appear in the SOHO/LASCO C2 field of view at 09:12UT on 17 June. It was related to a far side eruption in former active region NOAA 2080.
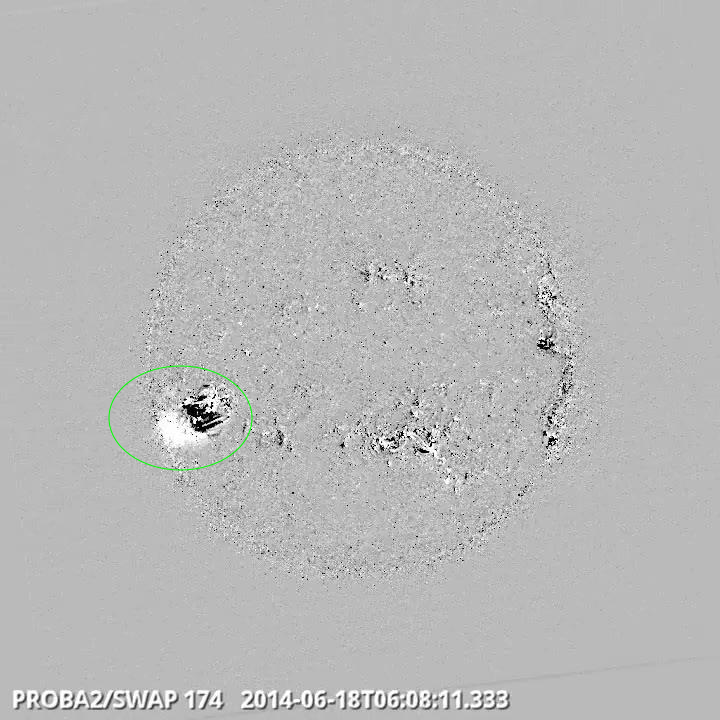
A partial halo CME appeared in the LASCO C2 field of view on 19 June at 17:00UT. The CME had an angular width of around 190 degrees and projected plane-of-the-sky speed of around 400 km/s. It was produced by the eruption of a filament to the north of NOAA 2093, starting around 14:25UT as seen by SDO/AIA. The eruption was also accompanied by coronal dimmings and a post-eruption arcade. An interplanetary shock probably driven by this partial halo CME was detected by ACE and SOHO/CELIAS at 22:00UT on 23 June.
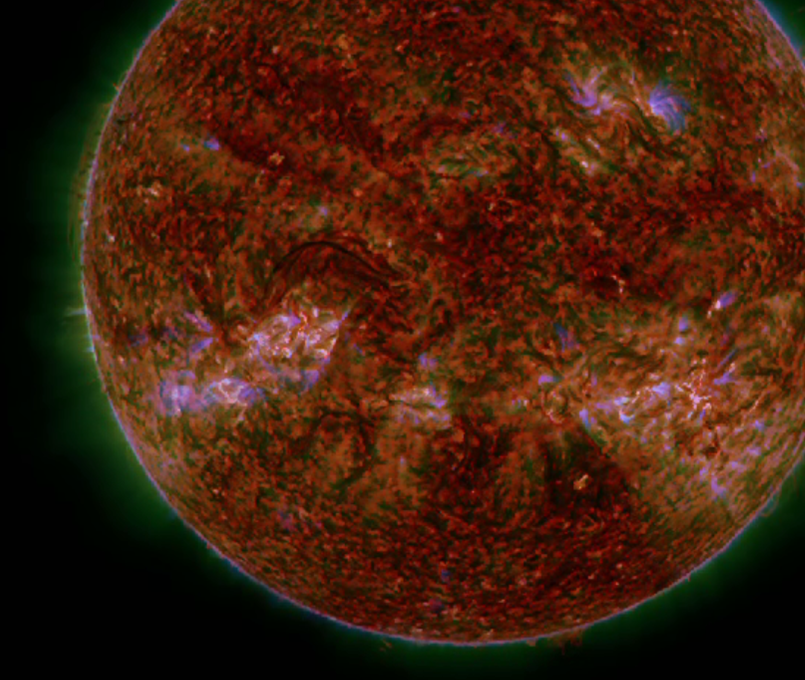
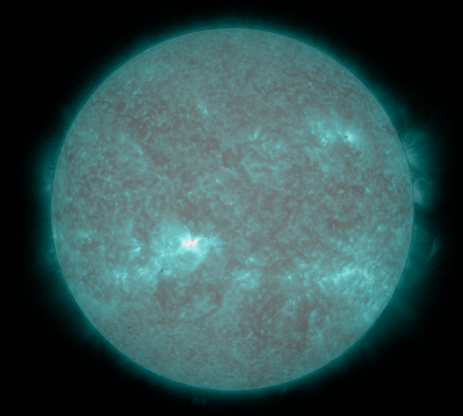
A rather symmetric, but very weak partial halo CME (angular width around 270 degrees, projected plane-of-the-sky speed around 350 km/s) first appeared in the LASCO C2 field of view at 12:24UT on 20 June. It was associated with the C5.0 flare peaking at 11:20UT in the Catania sunspot group 89 (leading part of NOAA 2093). See image below (combination of SDO/AIA 131 and SDO/HMI intensitygram).
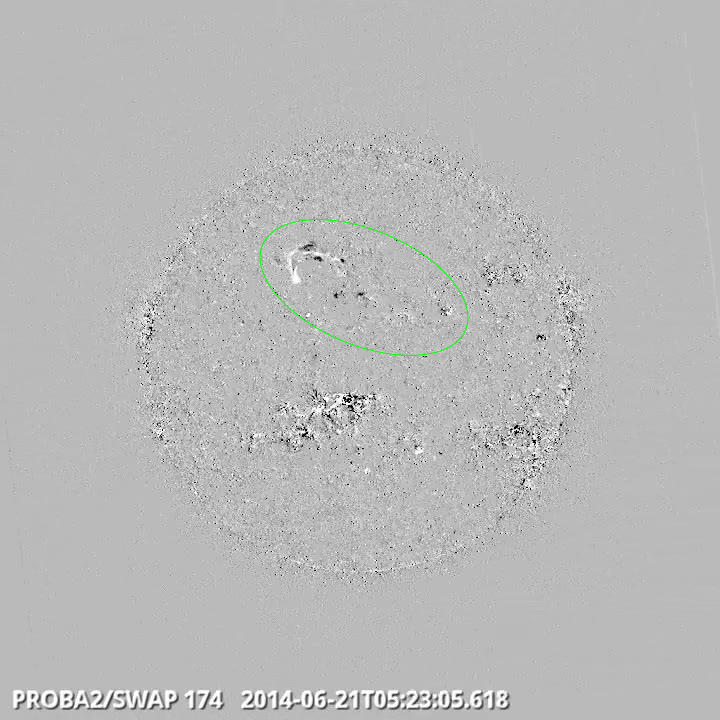
The last partial halo CME (angular width around 160 degrees, projected plane-of-the-sky speed around 300 km/s) was first seen in the LASCO C2 field of view at 05:24UT on 21 June. It was associated with a filament eruption at the central meridian in the northern hemisphere, and mostly directed to the north of the ecliptic plane.
This week, the level of solar activity decreased from moderate on Monday, mostly low during the week and very low on Sunday.
In order to view the activity of this week in more detail, we suggest going to the following website from which all the daily (normal and difference) movies can be accessed: http://proba2.oma.be/ssa.
This page also lists the recorded flaring events.
A weekly overview movie can be found here: http://proba2.oma.be/swap/data/mpg/movies/WeeklyReportMovies/WR221_Jun16_Jun22/weekly_movie_2014_06_16.mp4 (SWAP week 221).
Details about some of this week’s events can be found further below.
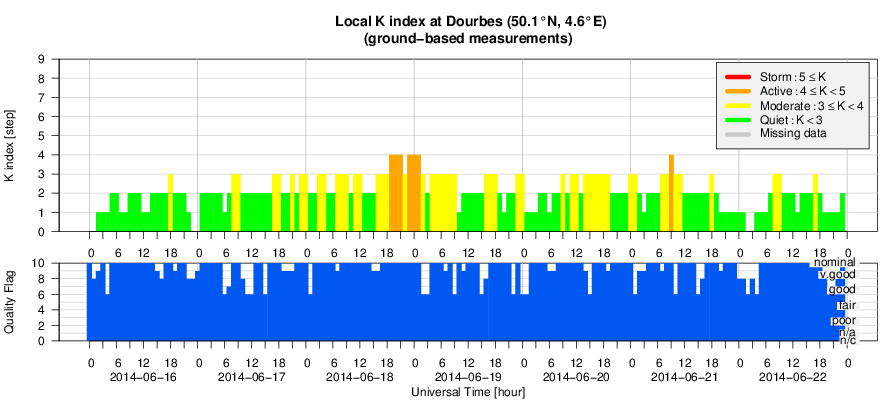
In the beginning of the week, the Earth was situated inside a slow solar wind flow, and the geomagnetic conditions were quiet. An interplanetary sector boundary was crossed around 17:00 UT on 17 June. The interplanetary magnetic field (IMF) magnitude increased up to 10 nT, but did not exhibit prolonged intervals of strongly negative north-south component Bz. The geomagnetic conditions were quiet to unsettled.
After that, the solar wind flow became rather inhomogeneous in speed and IMF magnitude, with the solar wind speed reaching 500 km/s and the IMF magnitude reaching 10 nT. Active to minor storm geomagnetic conditions were reported in the evening of 18 June, as well as on 21 June. Otherwise, the geomagnetic conditions were on the quiet to unsettled level until the end of the week.
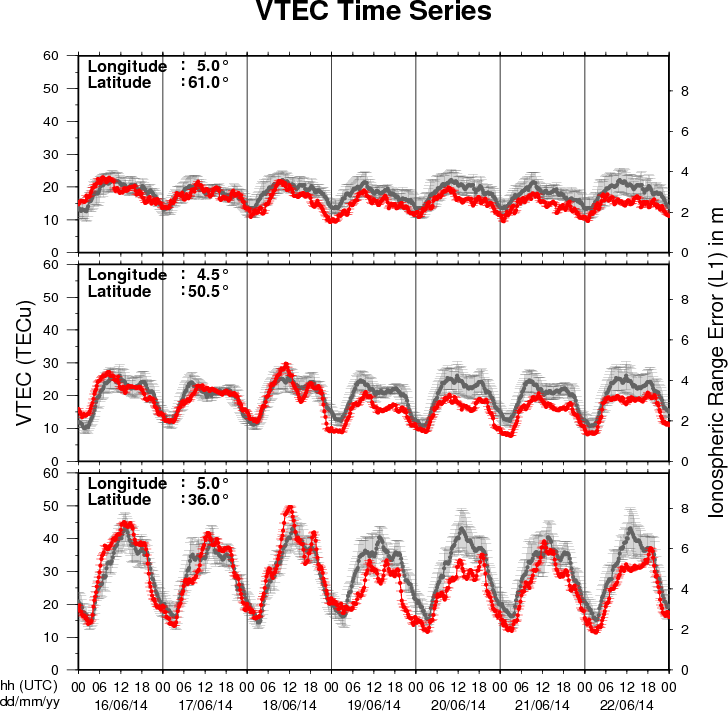
The figure shows the time evolution of the Vertical Total Electron Content (VTEC) (in red) during the last week at three locations:
a) in the northern part of Europe(N61°, 5°E)
b) above Brussels(N50.5°, 4.5°E)
c) in the southern part of Europe(N36°, 5°E)
This figure also shows (in grey) the normal ionospheric behaviour expected based on the median VTEC from the 15 previous days.
The VTEC is expressed in TECu (with TECu=10^16 electrons per square meter) and is directly related to the signal propagation delay due to the ionosphere (in figure: delay on GPS L1 frequency).
The Sun's radiation ionizes the Earth's upper atmosphere, the ionosphere, located from about 60km to 1000km above the Earth's surface.The ionization process in the ionosphere produces ions and free electrons. These electrons perturb the propagation of the GNSS (Global Navigation Satellite System) signals by inducing a so-called ionospheric delay.
See http://stce.be/newsletter/GNSS_final.pdf for some more explanations ; for detailed information, see http://gnss.be/ionosphere_tutorial.php