
The Solar-Terrestrial Centre of Excellence (STCE) is a collaborative network of the Belgian Institute for Space Aeronomy, the Royal Observatory of Belgium and the Royal Meteorological Institute of Belgium.
|
Published by the STCE - this issue : 31 Jul 2014. The Solar-Terrestrial Centre of Excellence (STCE) is a collaborative network of the Belgian Institute for Space Aeronomy, the Royal Observatory of Belgium and the Royal Meteorological Institute of Belgium. |
| Archive of the newsletters | Subscribe to this newsletter by mail |
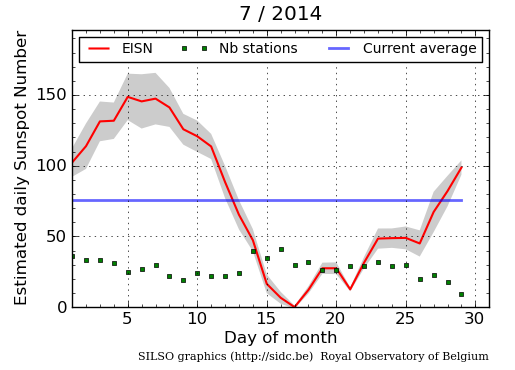
The Sun had its own mountain stage this month, with soaring sunspot numbers during the first week, then a fast decline until sea-level values (that is: zero sunspots) were reached on the 17th, followed by a gradual recovery to more moderate sunspot numbers. This can be seen in the evolution of the estimated daily sunspot number as compiled by SILSO on the SILSO website (http://sidc.oma.be/silso/ ), as shown in graph underneath.
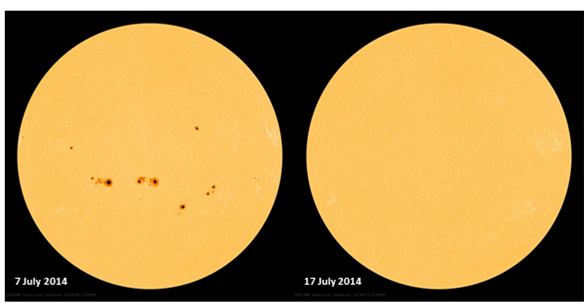
The high number of sunspots early this month was already discussed in a previous newsletter (see http://www.stce.be/news/260/welcome.html ). Despite the numerous and complex sunspot groups, only 4 M-class flares were recorded during the first 10 days of July. Things got worse, as all the sunspot groups one-by-one rounded the west limb, and the solar surface got devoid of any freckles. The SDO-images (http://sdo.gsfc.nasa.gov/data/aiahmi/browse/ ) underneath show the Sun on 7 and 17 July: Quite a difference! There was even an "all quiet alert" in place from 16-24 July (see this newsletter http://stce.be/news/159/welcome.html for more information).
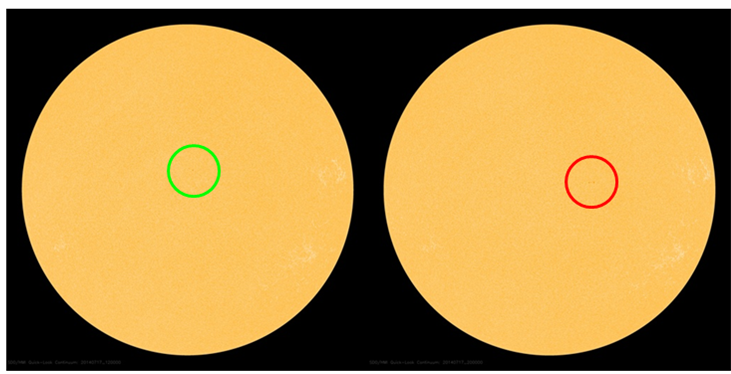
The zero value of the sunspot number for the 17th is still preliminary. Indeed, observers early on the day correctly reported no spots, but observers taking a look at the Sun during the afternoon or evening hours could see the rise and fall of a sun speck, and -starting around 18:00UT- the development of a small bipolar group, as can be seen in the SDO-images underneath (resp. at 12:00 and 20:00UT; http://sdo.gsfc.nasa.gov/ ).
Assuming the final sunspot number on 17 July will be zero, one could question how often this happens. After all, this is solar maximum, isn't it? Graph underneath puts things in perspective. It shows from 1818 onwards the (Meeus) smoothed monthly sunspot number (thick blue line), and for each month the highest and lowest value of the daily sunspot number (resp. green and red; data from WDC/SILSO at http://sidc.oma.be/silso/datafiles ). The values for the last 4 months are preliminary.
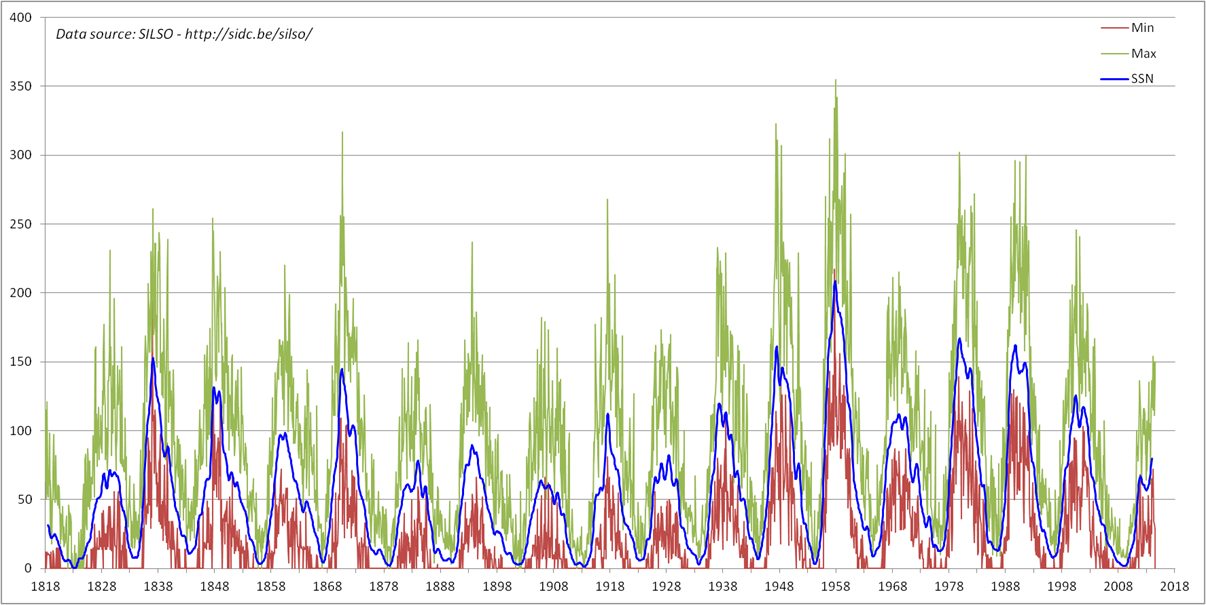
As can readily be seen, it has been quite a while since we had a cycle maximum with a spotless day. This was the case especially during SC 7 (+/- 1830), 12 (+/- 1883) and 14 (+/- 1905). Just like ongoing Solar Cycle 24, it concerned moderate to weak solar cycles. It's also not so unusual that we have very high and (near) zero daily sunspot numbers within one and the same month during a cycle maximum. In July 1905, the sunspot number was 148 on the 15th, but 0 only half a solar rotation later on the 28th.
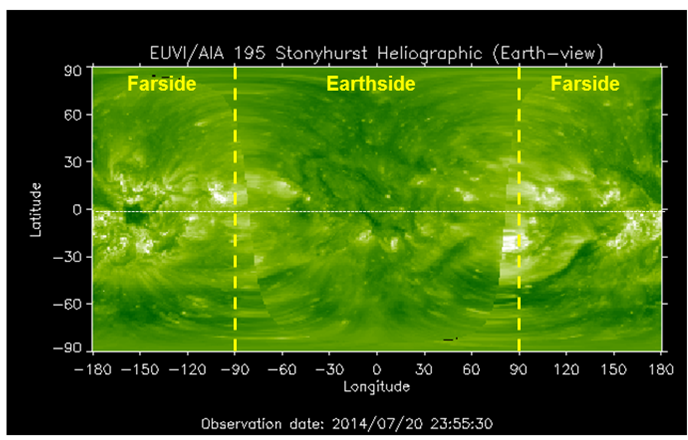
A spotless interval of only one or a few days does not necessarily mean that the Sun has become completely inactive over a full solar rotation, as there can still be a lot of activity in a limited longitudinal band. Such configurations often occur during the ascending and descending phases of stronger cycles, and are favored by a strong asymmetry in activity between the northern and southern solar hemispheres, i.e. with only one hemisphere being active and almost no contribution from the other one as is currently the case with the weakly active northern hemisphere. So in this case, the longitudinal "gaps" of the active southern hemisphere were not filled by active longitudes of the northern hemisphere, whereas normally these gaps are filled at times of maximum activity. This can be seen in the above EUV-image from STEREO/SDO (http://stereo-ssc.nascom.nasa.gov/beacon/beacon_secchi.shtml ), showing nearly no active (bright) regions on the Earth-directed hemisphere, most of them being on the farside and in the southern hemisphere.
Solar activity was low to very low for the last two weeks. Only low-level C-class flares were recorded: On 14-15 July by NOAA 2109, and from 24 July onwards in a cluster of small sunspot groups. The strongest event was a C2.5 flare produced by NOAA 2125 on 27 July. Several observers reported a spotless solar disk on 17 July. No Earth directed CMEs were observed over the entire period.
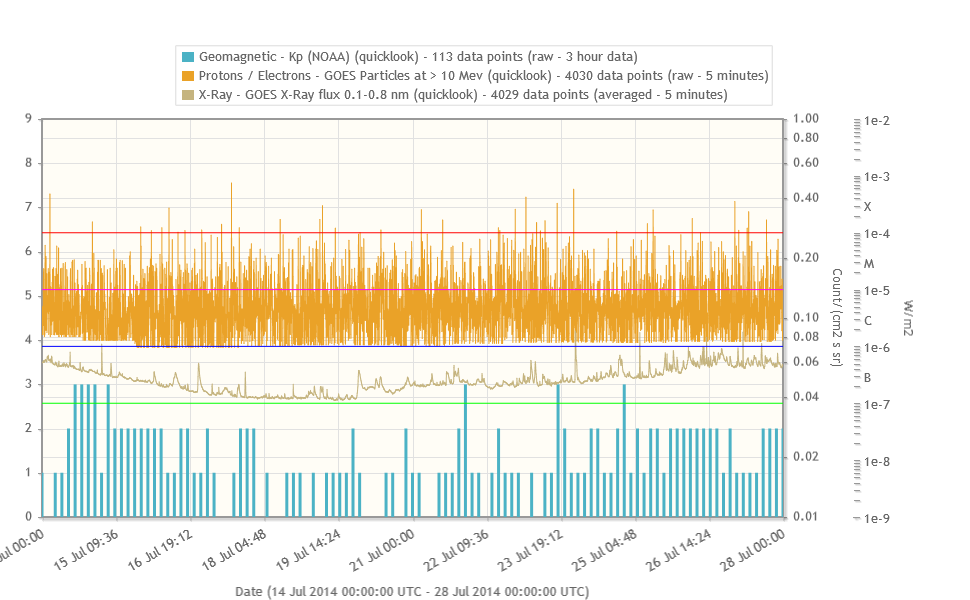
An ALL-QUIET-ALERT was issued on 16 July and lifted on 24 July after the first C-class flare occurrence. Indeed, as can be seen in graph underneath, for the period of 16-23 July the solar X-ray output remained below C-class level, the Kp index (blue) remained well below 5, and the high-energy proton fluxes (orange) stayed far below the event threshold of 10 particle flux units.
The level of solar activity was *low* to *very low* this week.
In order to view the activity of this week in more detail, we suggest going to the following website from which all the daily (normal and difference) movies can be accessed: http://proba2.oma.be/ssa.
This page also lists the recorded flaring events.
A weekly overview movie can be found here: http://proba2.oma.be/swap/data/mpg/movies/WeeklyReportMovies/WR225_Jul14_Jul20/weekly_movie_2014_07_14.mp4 (SWAP week 225).
Note the off-point campaigns at the beginning of this movie. They are the consequence of SWAP supporting a LYRA paving campaign, by off-pointing several times.
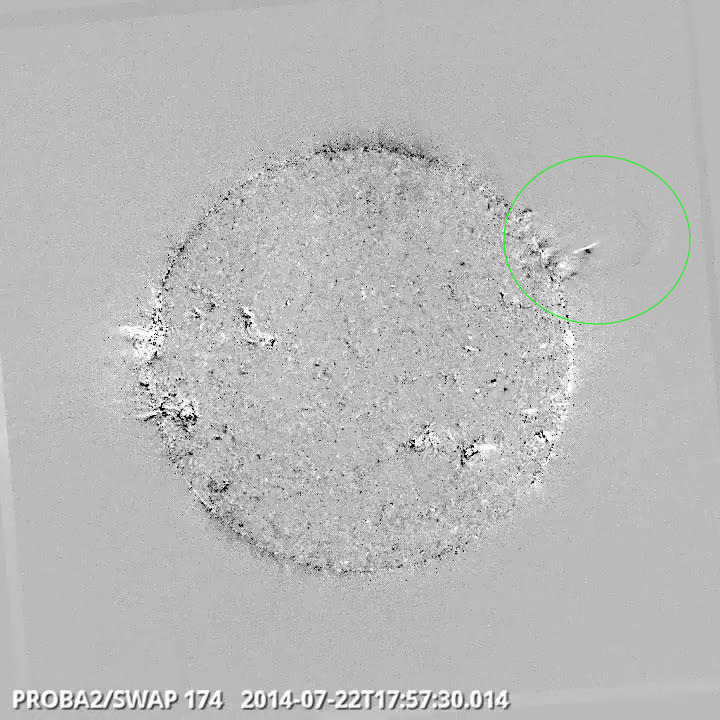
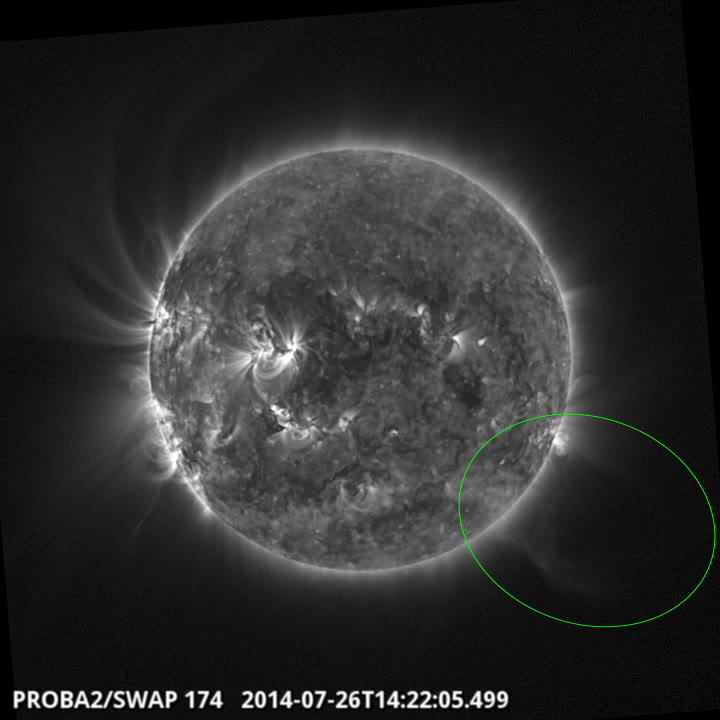
Except for a single weak flare occurrence on the South West limb and a few small prominence eruptions, no noteworthy solar events occurred this week.
The level of solar activity evolved from *very low* to *low* this week.
In order to view the activity of this week in more detail, we suggest going to the following website from which all the daily (normal and difference) movies can be accessed: http://proba2.oma.be/ssa.
This page also lists the recorded flaring events.
A weekly overview movie can be found here: http://proba2.oma.be/swap/data/mpg/movies/WeeklyReportMovies/WR226_Jul21_Jul26/weekly_movie_2014_07_21.mp4 (SWAP week 226).
Details about some of this week’s events, can be found further below.
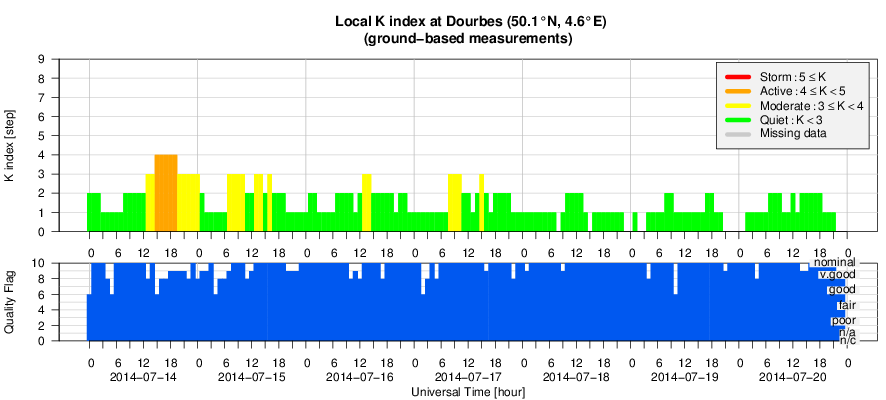
During the last 2 weeks, geomagnetic conditions were mostly quiet with the exception of 14 July when a shock arrived at Earth (at 13:27 UT) and caused one active period at Dourbes (K=4). Some unsettled conditions that day were also related to a sector boundary crossing, as the interplanetary magnetic field (IMF) changed its direction from away to towards the Sun and stayed that way till 20 July.
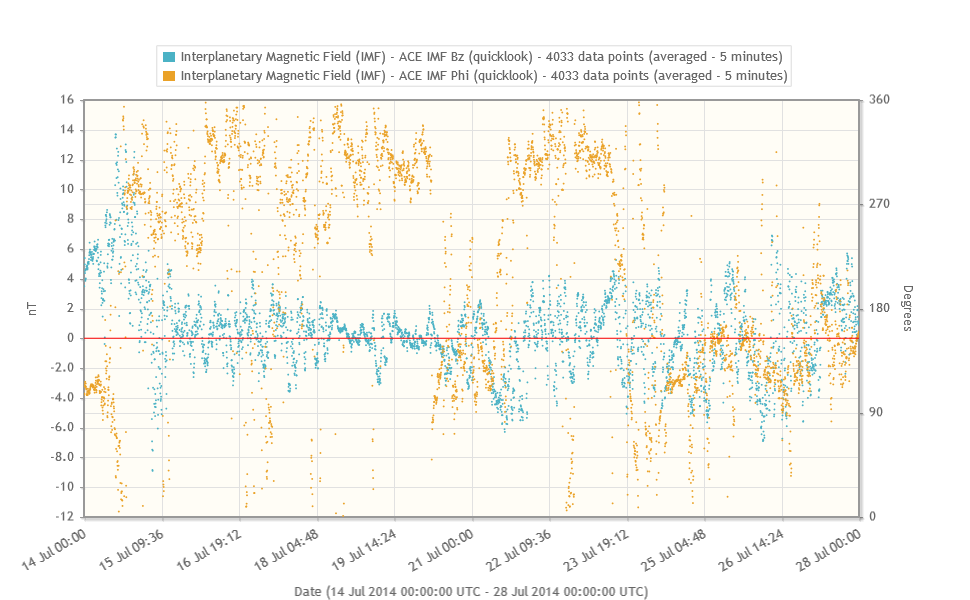
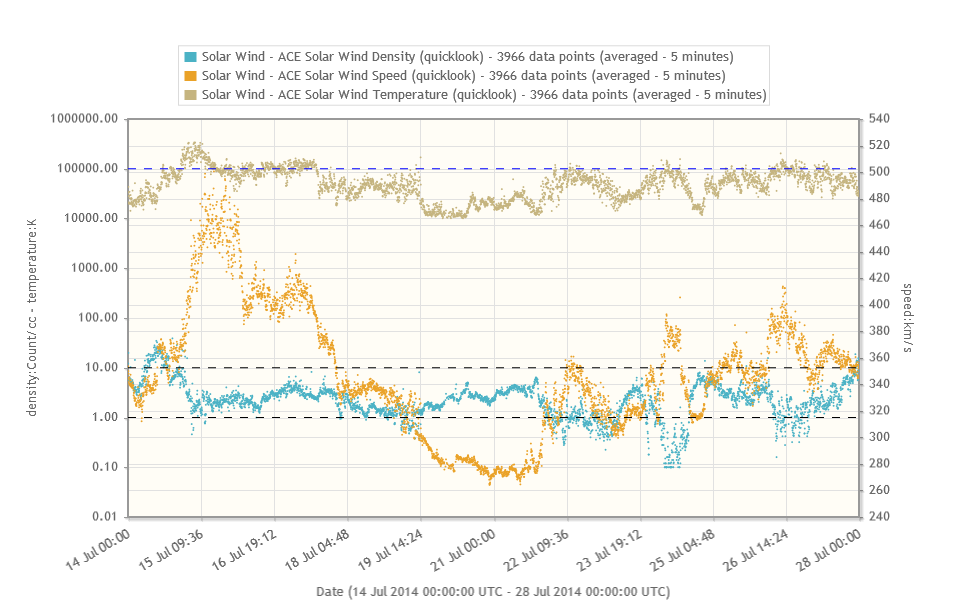
For the rest of the period, solar wind conditions were mainly nominal with some periods of slightly enhanced flow speeds (up to 425 km/s) related to sector boundary crossings which may have been modulated by the influence of coronal hole moderate speed streams. Total magnetic field reached maxima of around 8nT with variable Bz.
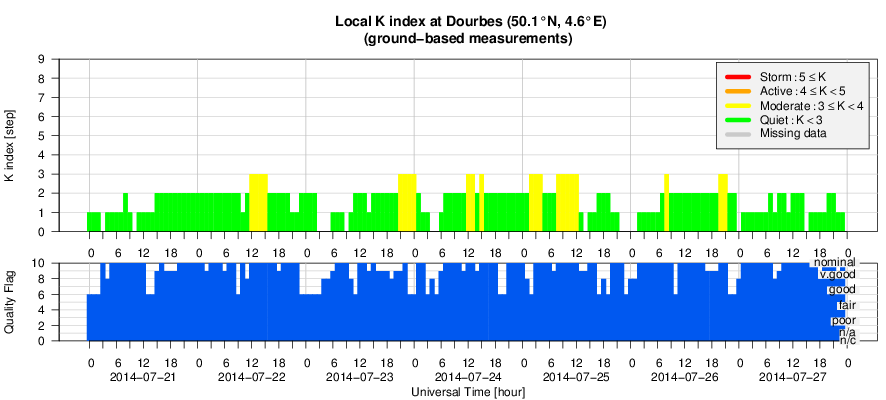
Geomagnetic conditions were quiet to unsettled, with NOAA Kp and local K Dourbes varying between 0 and 3.
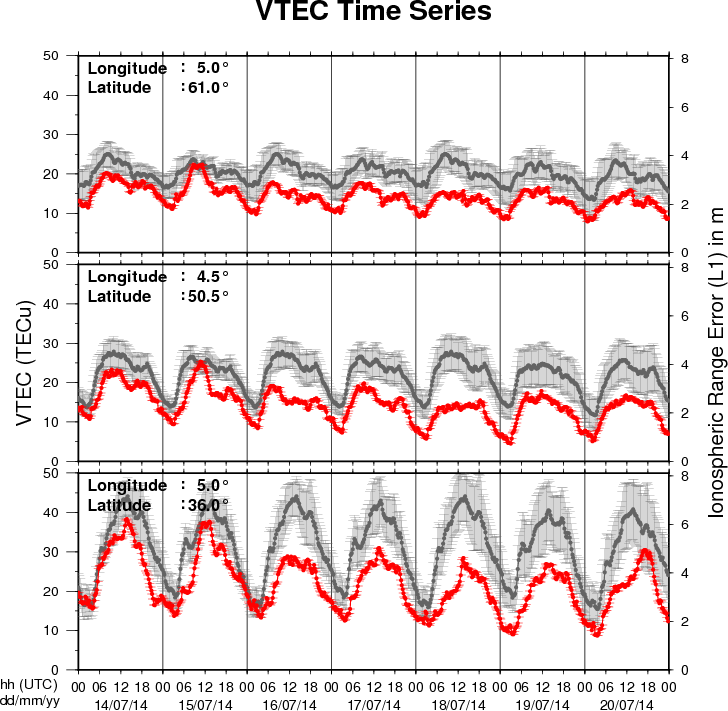
The figure shows the time evolution of the Vertical Total Electron Content (VTEC) (in red) during the last week at three locations:
a) in the northern part of Europe(N61°, 5°E)
b) above Brussels(N50.5°, 4.5°E)
c) in the southern part of Europe(N36°, 5°E)
This figure also shows (in grey) the normal ionospheric behaviour expected based on the median VTEC from the 15 previous days.
The VTEC is expressed in TECu (with TECu=10^16 electrons per square meter) and is directly related to the signal propagation delay due to the ionosphere (in figure: delay on GPS L1 frequency).
The Sun's radiation ionizes the Earth's upper atmosphere, the ionosphere, located from about 60km to 1000km above the Earth's surface.The ionization process in the ionosphere produces ions and free electrons. These electrons perturb the propagation of the GNSS (Global Navigation Satellite System) signals by inducing a so-called ionospheric delay.
See http://stce.be/newsletter/GNSS_final.pdf for some more explanations ; for detailed information, see http://gnss.be/ionosphere_tutorial.php
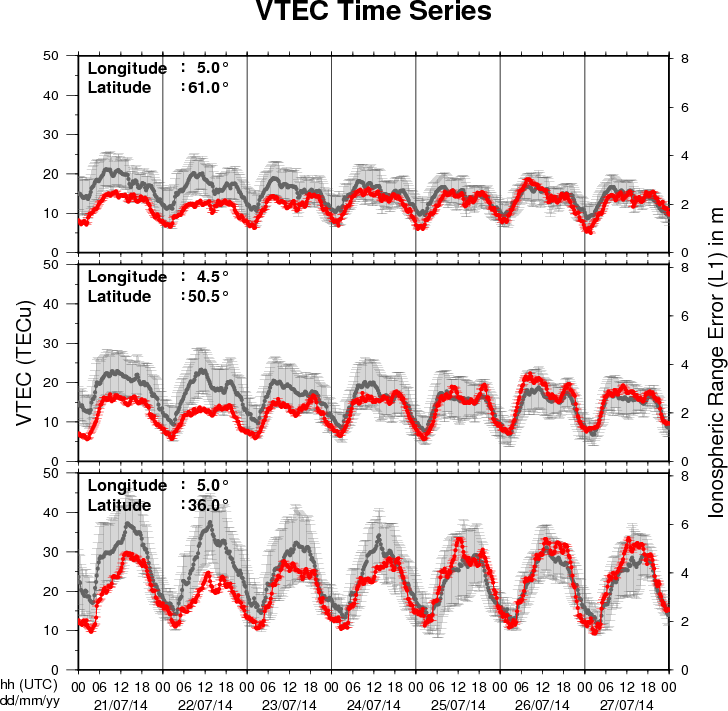
Presentation given during the STCE workshop Modelling of antennas and calibration of radio instruments.
http://www.spaceweather.eu/en/repository/show?id=526
Presentation given during the STCE workshop Modelling of antennas and calibration of radio instruments.
http://www.spaceweather.eu/en/repository/show?id=527
Presentation given during the STCE workshop Modelling of antennas and calibration of radio instruments.
http://www.spaceweather.eu/en/repository/show?id=528
Presentation given at the STCE workshop Modelling of antennas and calibration of radio instruments, June 2014.
http://www.spaceweather.eu/en/repository/show?id=529
Presentation given at the STCE workshop Modelling of antennas and calibration of radio instruments, June 2014.
http://www.spaceweather.eu/en/repository/show?id=530
Presentation given at the STCE workshop Modelling of antennas and calibration of radio instruments, June 2014.
http://www.spaceweather.eu/en/repository/show?id=531
Presentation given at the STCE workshop Modelling of antennas and calibration of radio instruments, June 2014.
http://www.spaceweather.eu/en/repository/show?id=532
Presentation given at the STCE workshop Modelling of antennas and calibration of radio instruments, June 2014.
http://www.spaceweather.eu/en/repository/show?id=533
Start : 2014-09-07 - End : 2014-09-12
Planetary space weather can be characterised by changes in the
ambient planetary magnetic field and plasma populations around the
planetary environment while space climate refers to the long-term
changes in space weather conditions. Space weather and space
climate are driven by the changes in the Sun. The effects of Space
Weather on the Earth's environment are well documented,
particularly in terms of risk to satellites, communications and
ground-based systems such as electrical power grids and pipelines.
However, planetary space weather and space climate studies as well
as better prediction models for space weather are needed. Typically
differences in the magnetic field and plasma environment at
different planets, as well as the distance of the planet from the
sun drives different space weather effects as we move through the
solar system. The use of solar wind propagation models combined
with solar observations allows us to obtain and predict the
interplanetary conditions around each planet.
We solicit papers on planetary as well as terrestrial space
weather and space climate, where data from past and on-going space
missions such as ACE, SOHO, SDO, MEX, VEX, MESSENGER and CASSINI is
used. We welcome papers on observations as well as modeling of
space weather and space climate in our solar system.
Website:
http://meetingorganizer.copernicus.org/EPSC2014/session/16809
Start : 2014-09-09 - End : 2014-09-11
The Workshop on Radiation Monitoring for the International Space
Station (WRMISS) has been held annually since 1996. The major
purpose of WRMISS is to provide a forum for discussion of technical
issues concerning radiation dosimetry aboard the International
Space Station and other spacecraft. This includes discussion of new
results, improved instrumentation, detector calibration, and
radiation environment and transport models. The goal of WRMISS is
to enhance international efforts to provide the best information on
the space radiation environment in low-Earth orbit and on the
exposure of astronauts and cosmonauts in order to optimize the
radiation safety of space crew.
Website:
http://www.ifj.edu.pl/conf/wrmiss/
Start : 2014-09-15 - End : 2014-09-20
The 'Geospace Revisited' conference aims at revisiting
long-standing issues of geospace dynamic phenomena. New data from
space missions like Cluster, THEMIS and the more recent Van Allen
Probes, along with measurements from ground-based magnetometer
arrays around the globe, processed with new methods and combined
with theory and simulations are expected to shed light on the
complex interplay of particles, fields and waves in geospace, and
in particular the inner magnetosphere (radiation belts and ring
current).
Website:
http://geospacerev.space.noa.gr/index.php
Start : 2014-11-12
This conference aims to bring together researchers, engineers,
users in the area of Big Data in the Space sector.
The focus is on the whole data lifecycle, ranging from data
acquisition by spaceborne and ground-based sensors to data
management, analysis and exploitation in the domains of Earth
Observation, Space Science, Space Engineering, Space Weather,
etc.
Special emphasis will be put on highlighting synergies and
cross-fertilization opportunities from domains like Climate Change,
Solid Earth Science, Planetary Sciences, Life Science,
Astrophysics, High Energy Physics, Social Sciences, etc.
We expect this conference to:
* contribute towards a common "Big Data from Space" scientific
and programmatic framework
* widen competences and expertise of universities, labs and
industrial actors
* foster networking of experts and users towards better access
and sharing of data, tools and resources
* leverage innovation, spin-in, spin off of technologies, and
business development arising from research and industry
progress
Website:
http://congrexprojects.com/2014-events/BigDatafromSpace/objectives
Start : 2014-12-15 - End : 2014-12-19
The AGU Fall Meeting is the largest worldwide conference in the
geophysical sciences, attracting more than 22,000 Earth and space
scientists, educators, students, and other leaders. For 46 years,
energized and passionate Earth and space scientists from around the
world gather at the AGU Fall Meeting to connect with colleagues,
broaden their knowledge base, and embrace the joy of science. The
2014 meeting takes place Monday 15 - Friday 19 December 2014.
Several sessions about space weather are foreseen:
*
When and Why Does Space weather Forecasting Fail?
*
Addressing Operational Space Weather Needs
*
Near Real Time Data for Earth Science and Space Weather
Applications
*
Understanding Hemispheric Asymmetry and Space Weather
*
Connection of Solar Events With the Variability of Space
Environments
*
Bz from the Sun to the Earth: Observations and Modeling
*
Solar Sources and Heliospheric Consequences of Coronal Mass
Ejections in Solar Cycle 24
*
Advances in Ionospheric Forecasting - Modeling, Observations, and
Validation
Abstract Submission Deadline: August 6, 2014
Website:
http://fallmeeting.agu.org/2014/
Start : 2015-04-20 - End : 2015-04-24
This gathering was born out of the desire to collect in one
place the latest technologies required for advancement of science
in the discipline of Solar and Space Physics. In doing so, it was
recognized that the two 1998 volumes of 'Measurement Techniques in
Space Plasmas' (Particles and Fields) have been a valuable
reference and resource for advanced students and scientists who
wish to know the fundamentals of measurement techniques and
technology.
Website:
https://mtssp.msfc.nasa.gov/
Start : 2015-06-22 - End : 2015-07-02
We invite contributions on novel inversion methods with
application across the geosciences. Of particular interest are 3D
imaging, joint inversion of geodetic, geophysical and geochemical
datasets, and multi-disciplinary interpretation approaches such as
integration of gravity, EM and seismic data or thermo-mechanical
modelling studies constrained by physical parameters.
Modelling of Space Weather Effects: Solar, Magnetospheric and
Earth Resistivity Constraints (IAGA, IAMAS)
In this symposium we welcome contributions on all aspects of the
modelling of space weather and its effects, from the Sun to Earth.
This includes the modelling of the various interactions between
travelling solar storms and the solar wind, magnetosphere,
ionosphere and solid Earth and the validation of models through
measurements. Contributions on models developed to aid end-users,
such as satellite and power grid operators, survive the impact of
space weather are also encouraged.
Website:
http://www.iugg2015prague.com/joint-inter-association-symposia.htm#JA