
The Solar-Terrestrial Centre of Excellence (STCE) is a collaborative network of the Belgian Institute for Space Aeronomy, the Royal Observatory of Belgium and the Royal Meteorological Institute of Belgium.
|
Published by the STCE - this issue : 11 Sep 2014. The Solar-Terrestrial Centre of Excellence (STCE) is a collaborative network of the Belgian Institute for Space Aeronomy, the Royal Observatory of Belgium and the Royal Meteorological Institute of Belgium. |
| Archive of the newsletters | Subscribe to this newsletter by mail |
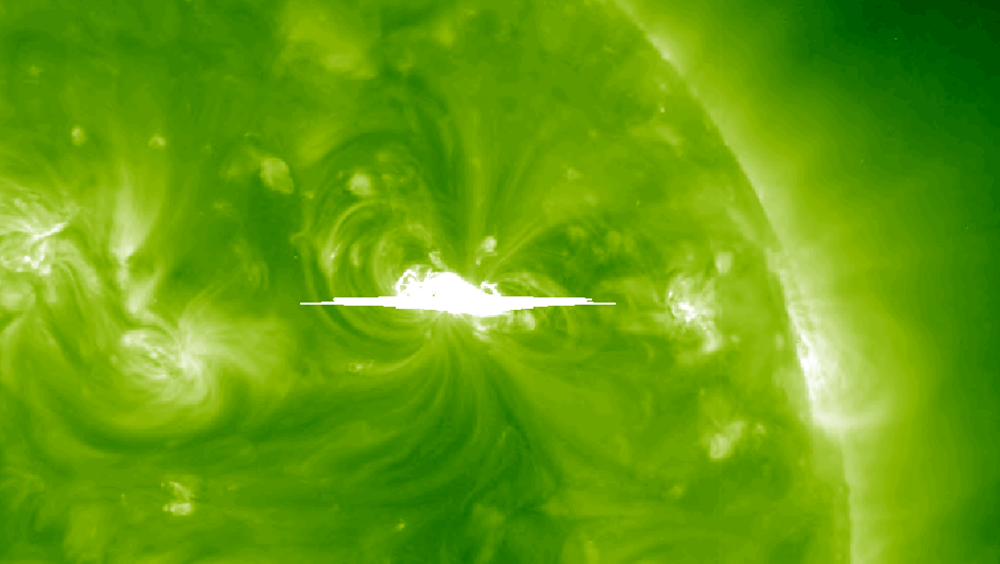
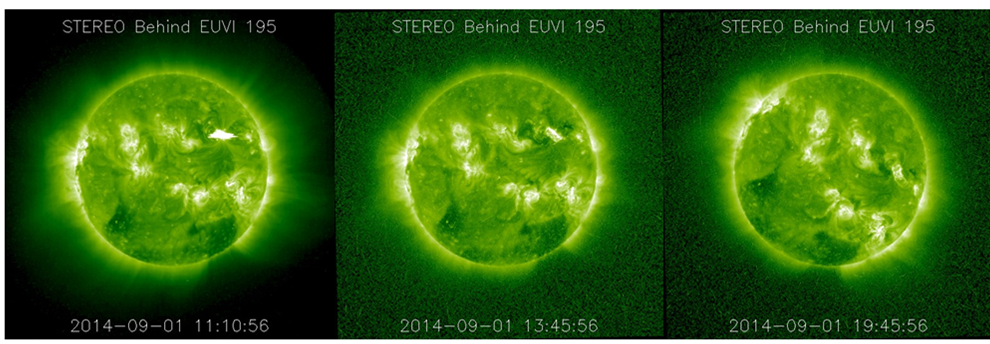
On 1 September around 11:05UT, the STEREO-B spacecraft observed a huge blast on the far-side of the Sun (see this movie at http://youtu.be/pvbpHHvYzmk). The maximum strength of the flare was cautiously estimated to be between M5 and X1.5, giving it a good chance the event belonged to the category of "eXtreme" flares.
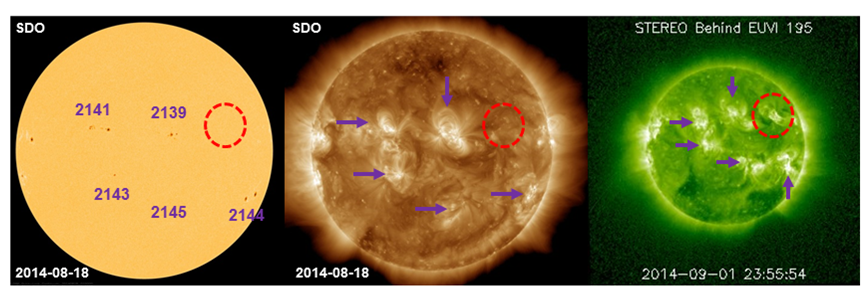
The eruption took place in a region that developed on the Sun's far-side. This can be seen when comparing the view in extreme ultraviolet (EUV) of 1 September with the view from Earth 2 weeks before. On the SDO images, no active region at the corresponding location can be seen. Note that the solar axis is currently slightly (about 7 degrees) pointed towards the Earth, and away from STEREO-B over about the same angle. This gives the false impression that the active regions, as seen from STEREO-B, are located on more northern latitudes. Note that another strong flare, albeit slightly weaker, took place only hours later, peaking at 22:15UT in or very near old sunspot group NOAA 2144.
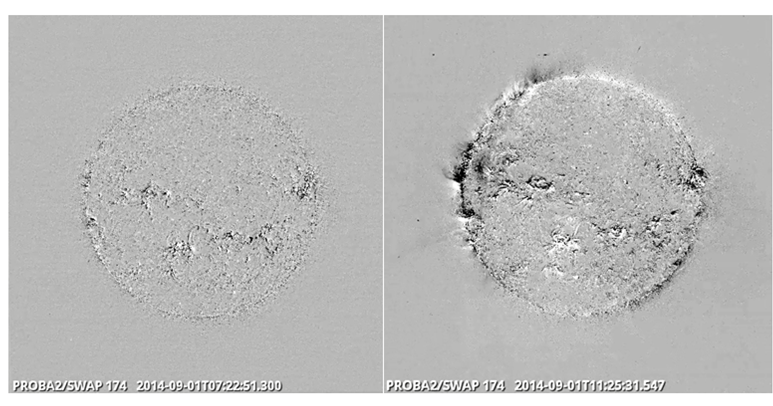
A strong EIT-wave could be seen in difference images from both STEREO-B and SDO, meaning that the wave was strong enough to travel all the way from the back to the earth-facing side of the Sun. This has happened before, such as e.g. on 5 March this year (see http://stce.be/news/241/welcome.html for more info on this event and EIT-waves). The arrival of the EIT-wave at the front-side can be seen in these before/after difference images from PROBA2/SWAP.
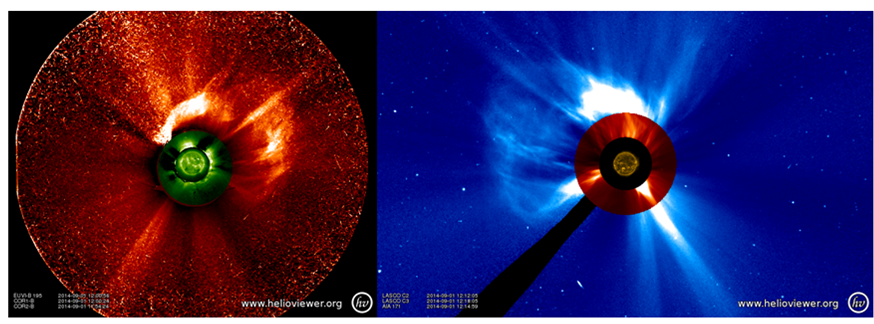
The EUV images from STEREO also showed coronal dimmings as well as post-flare coronal loops. Space and ground based radio-instruments recorded a type II radio-burst. This was all indicative that a plasma cloud was ejected into space. This coronal mass ejection (CME) was observed both by SOHO and STEREO-B. The huge CME had an estimated plane-of-the-sky-speed of around 1000 km/s. Images underneath were taken by STEREO-B and SOHO about an hour after the flare. Note STEREO-B is almost at the opposite side of the Sun compared to SOHO.
However, the most amazing effect associated to this eruption was the solar energetic particle (SEP) event. There were so many particles slamming into the camera pixels (creating the white dots in the images) that they saturated the star-trackers onboard STEREO-B, and the spacecraft lost lock on the Sun. This can be seen in the movie, where the solar image started to rotate clockwise from about 16:00UT till about 20:30UT, before resetting itself and providing again images with the correct orientation. More info at http://sohowww.nascom.nasa.gov/pickoftheweek/
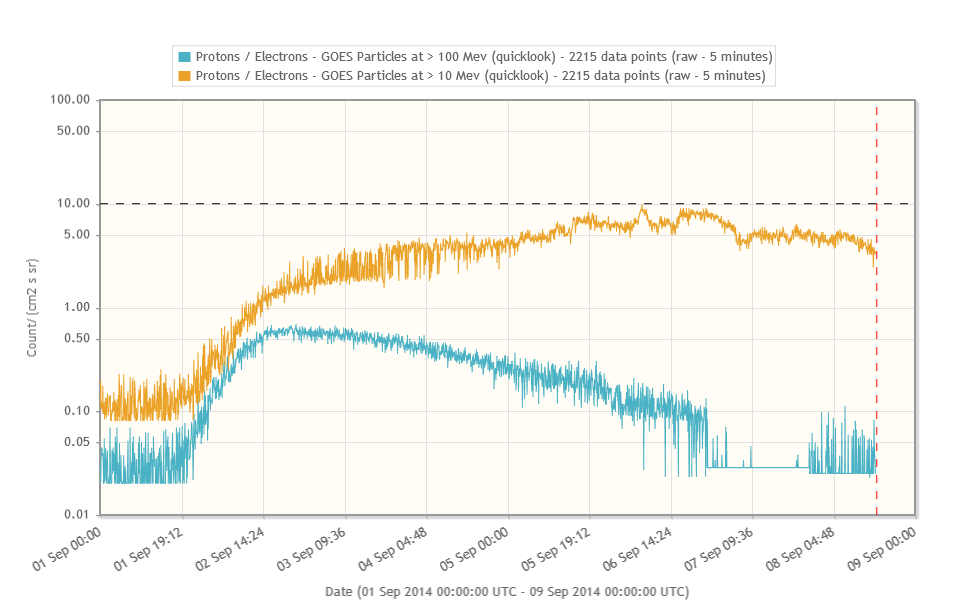
The energetic protons also found their way to Earth via well connected magnetic field lines. Around 21:00UT on 1 September, proton fluxes gradually started to rise. This concerned also particles with energies 10 times greater than the ones usually used for characterizing proton events. Nonetheless, fluxes rose not enough to get this enhancement characterized as a genuine proton event, as the maximum flux stayed just below the alert threshold. The effect of the enhanced proton flux was only barely noticeable in the SOHO imagery. More information on the intensity of proton events can be found in this news item at http://www.sidc.be/news/233/welcome.html Amazingly, a week after the eruption, the proton flux was still well above the nominal values!
Credits - Data and imagery were taken from SDO (http://sdo.gsfc.nasa.gov/data/aiahmi/), PROBA2/SWAP (http://proba2.oma.be/ssa), SOHO/LASCO http://sohowww.nascom.nasa.gov/), STEREO (http://stereo.gsfc.nasa.gov/), Cactus (www.sidc.oma.be/cactus/), LMSAL (http://www.lmsal.com/solarsoft/latest_events/; and at http://www.lmsal.com/nitta/movies/aia_euvi/20140901_1045_aia0193_euvib195_rdiff_euvi/AIA0193_EUVIB195_RDIFF_EUVI_20140901_1045.html), (J)Helioviewer (http://helioviewer.org/#), and daily reports from NOAA/SWPC (http://www.swpc.noaa.gov/Data/index.html) and SIDC/RWC (http://www.sidc.be/).
On August 27, the GNSS section of the STCE measured increased density levels of electrons in the ionosphere, a layer of the earth atmosphere. Disturbances in the so-called TEC (Total Electron Content) influences navigation and communication systems.
More background information can be found on this particular GNSS webpage
http://www.gnss.be/Atmospheric_Maps/ionospheric_event.php?date=2014-08-27
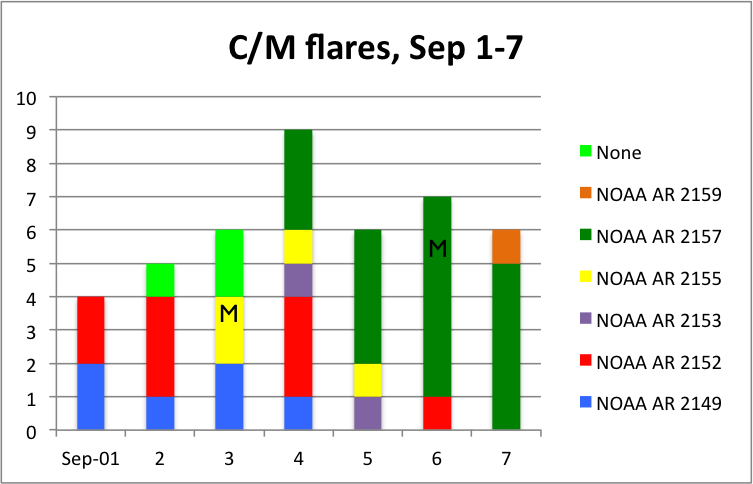
Fourteen active regions were reported during the week, with NOAA AR numbers between 2149 and 2162. Numerous C-class flares and two M-class flares were observed, 43 in total. NOAA AR 2155 produced the M2.5 flare peaking at 13:54 UT on September 3, accompanied only by a weak and narrow CME. The M1.1 flare peaking on September 6 at 17:09 UT in the NOAA AR 2157 was not associated with a CME. The flare in the category 'None' originate from a region that was at the moment of the flare behind the east limb.
Two far side partial halo CMEs were detected early on September 1, first appearing in the SOHO/LASCO C2 field of view at 00:36 and 09:24 UT respectively. Their angular widths were similar (around 150 and 130 degrees respectively), as well as were their shapes, although the first one was significantly weaker than the second one. Both CMEs seem to result from activity in the active region on the far side of the Sun (around N10W130) as observed by STEREO/EUVI, so they did not result in any geomagnetic disturbance.
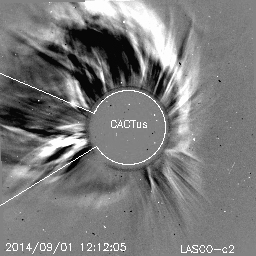
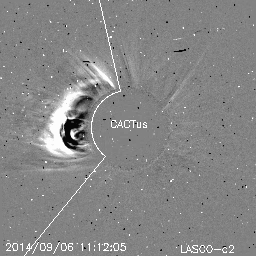
A full halo CME was detected on September 1, first appearing in the LASCO C2 field of view at 11:12 UT.
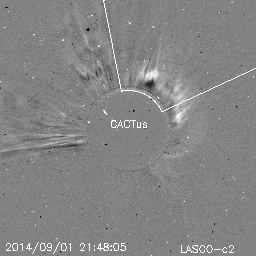
Two more partial halo CMEs were detected late on September 1. The first halo CME appeared at 21:36 UT in the LASCO C2 field of view above the north-west limb, and had angular width around 165 degrees (you can ignore the angle indicated by CACTus in the LASCO C2 image).
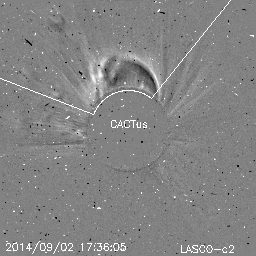
A partial halo CME was detected on September 2 in association with the eruption of a long filament in the northern hemisphere. The CME first appeared in the LASCO C2 field of view at 16:36 UT, had angular width around 190 degrees and the projected plane-of-the-sky speed around 450 km/s. Despite the position of the CME source region not far from the solar disk center, the bulk of the CME material went northward of the ecliptic plane. Nevertheless, the corresponding ICME (without a shock) arrived at the Earth on September 6 (see geomagnetic activity).
A partial halo CME (angular width around 220 degrees) was detected on September 5 first appearing in the LASCO C2 field of view at 19:24 UT. STEREO B EUVI data show that the CME source region was located on the far side of the Sun (filament eruption around N15E160 as seen from the Earth), so this CME did not have geomagnetic consequences.
A partial halo CME first appearing in the LASCO C2 field of view at 10:12UT on September 6 was associated with coronal dimmings and the C8.0 flare peaking at 08:14 UT in the NOAA AR 2157. It had the angular width around 140 degrees and the projected plane-of-the-sky speed around 350 km/s. The bulk of the CME material was directed significantly eastward of the Sun-Earth line, but no magnetic structure linked with this event was seen passing ACE.
The solar proton flux as measured by GOES and ACE was slowly rising since the end of September 1 in association with the full halo CME (see above). The flux above 10 MeV never crossed the SEP event threshold of 10 pfu but stabilized around 6 pfu on September 5, and started to decrease slowly on September 7.
| DAY | BEGIN | MAX | END | LOC | XRAY | OP | 10CM | TYPE | Cat | NOAA |
| 03 | 1320 | 1354 | 1423 | S14W18 | M2.5 | SF | 60 | 2155 | ||
| 06 | 1650 | 1709 | 1722 | S14E53 | M1.1 | SF | 45 | 2157 |
| LOC: approximate heliographic location | TYPE: radio burst type |
| XRAY: X-ray flare class | Cat: Catania sunspot group number |
| OP: optical flare class | NOAA: NOAA active region number |
| 10CM: peak 10 cm radio flux |
On September 1-5 the Earth was situated inside a slow solar wind flow, and the geomagnetic conditions were on the quiet to unsettled level. A week overview of the solar wind speed measured by ACE is given in the graph below.
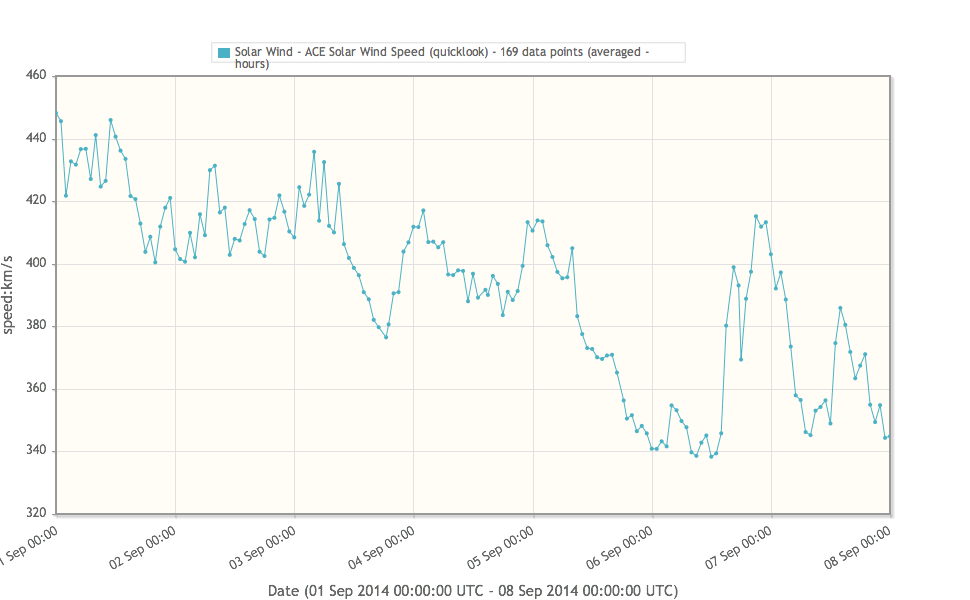
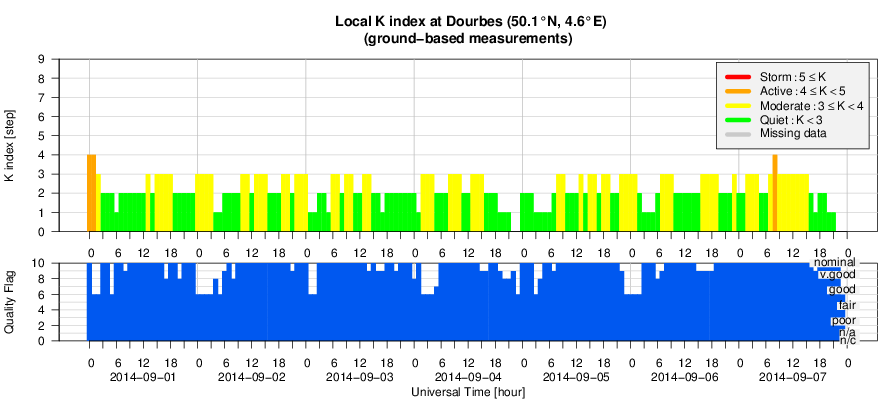
Early on September 6, the Earth entered an ICME probably corresponding to the partial halo CME detected on the Sun on September 2 (see Solar Activity). Even if the interplanetary magnetic field (IMF) magnitude reached 12 nT, the geomagnetic conditions remained quiet to unsettled (K smaller than 4) according to Dourbes and NOAA (and only one interval of K = 4 was reported by IZMIRAN on September 6) as the solar wind speed was low (below 450 km/s) and the southward IMF was never strong enough and long-lasting as can be seen in the overview of the solar wind parameters plotted below.
Disturbed solar wind conditions were observed until the end of the week.
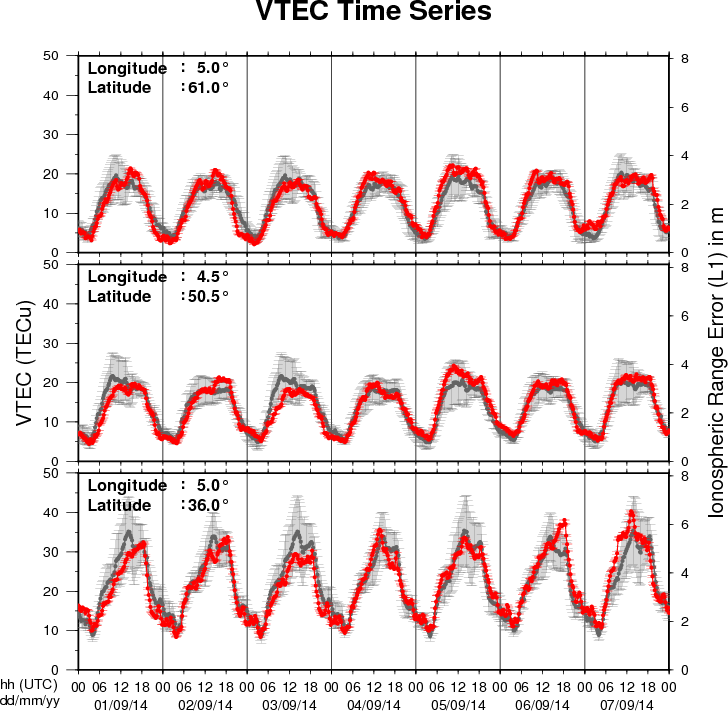
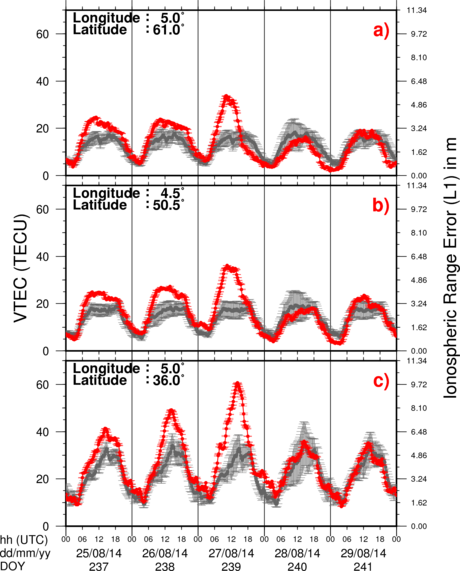
The figure shows the time evolution of the Vertical Total Electron Content (VTEC) (in red) during the last week at three locations:
a) in the northern part of Europe(N61°, 5°E)
b) above Brussels(N50.5°, 4.5°E)
c) in the southern part of Europe(N36°, 5°E)
This figure also shows (in grey) the normal ionospheric behaviour expected based on the median VTEC from the 15 previous days.
The VTEC is expressed in TECu (with TECu=10^16 electrons per square meter) and is directly related to the signal propagation delay due to the ionosphere (in figure: delay on GPS L1 frequency).
The Sun's radiation ionizes the Earth's upper atmosphere, the ionosphere, located from about 60km to 1000km above the Earth's surface.The ionization process in the ionosphere produces ions and free electrons. These electrons perturb the propagation of the GNSS (Global Navigation Satellite System) signals by inducing a so-called ionospheric delay.
See http://stce.be/newsletter/GNSS_final.pdf for some more explanations ; for detailed information, see http://gnss.be/ionosphere_tutorial.php
Start : 2014-09-15 - End : 2014-09-20
The 'Geospace Revisited' conference aims at revisiting
long-standing issues of geospace dynamic phenomena. New data from
space missions like Cluster, THEMIS and the more recent Van Allen
Probes, along with measurements from ground-based magnetometer
arrays around the globe, processed with new methods and combined
with theory and simulations are expected to shed light on the
complex interplay of particles, fields and waves in geospace, and
in particular the inner magnetosphere (radiation belts and ring
current).
Website:
http://geospacerev.space.noa.gr/index.php
Start : 2014-11-12
This conference aims to bring together researchers, engineers,
users in the area of Big Data in the Space sector.
The focus is on the whole data lifecycle, ranging from data
acquisition by spaceborne and ground-based sensors to data
management, analysis and exploitation in the domains of Earth
Observation, Space Science, Space Engineering, Space Weather,
etc.
Special emphasis will be put on highlighting synergies and
cross-fertilization opportunities from domains like Climate Change,
Solid Earth Science, Planetary Sciences, Life Science,
Astrophysics, High Energy Physics, Social Sciences, etc.
We expect this conference to:
* contribute towards a common "Big Data from Space" scientific
and programmatic framework
* widen competences and expertise of universities, labs and
industrial actors
* foster networking of experts and users towards better access
and sharing of data, tools and resources
* leverage innovation, spin-in, spin off of technologies, and
business development arising from research and industry
progress
Website:
http://congrexprojects.com/2014-events/BigDatafromSpace/objectives
Start : 2014-11-17 - End : 2014-11-21
The 11th Edition of the European Space Weather Week will take
place on 17-21nd November 2014 in Liège, Belgium.
The ESWW will again adopt the central aim of bringing together
the diverse groups in Europe working on different aspects of Space
Weather. This includes but isn't limited to the scientific
community, the engineering community, applications developers,
service providers and service end users.
The meeting organisation is coordinated by the Belgian
Solar-Terrestrial Centre of Excellence (STCE), ESA and the Space
Weather Working Team. The local organisation is done by the
STCE.
Website:
http://www.stce.be/esww11/
Start : 2014-12-15 - End : 2014-12-19
The AGU Fall Meeting is the largest worldwide conference in the
geophysical sciences, attracting more than 22,000 Earth and space
scientists, educators, students, and other leaders. For 46 years,
energized and passionate Earth and space scientists from around the
world gather at the AGU Fall Meeting to connect with colleagues,
broaden their knowledge base, and embrace the joy of science. The
2014 meeting takes place Monday 15 - Friday 19 December 2014.
Several sessions about space weather are foreseen:
*
When and Why Does Space weather Forecasting Fail?
*
Addressing Operational Space Weather Needs
*
Near Real Time Data for Earth Science and Space Weather
Applications
*
Understanding Hemispheric Asymmetry and Space Weather
*
Connection of Solar Events With the Variability of Space
Environments
*
Bz from the Sun to the Earth: Observations and Modeling
*
Solar Sources and Heliospheric Consequences of Coronal Mass
Ejections in Solar Cycle 24
*
Advances in Ionospheric Forecasting - Modeling, Observations, and
Validation
Abstract Submission Deadline: August 6, 2014
Website:
http://fallmeeting.agu.org/2014/
Start : 2015-04-20 - End : 2015-04-24
This gathering was born out of the desire to collect in one
place the latest technologies required for advancement of science
in the discipline of Solar and Space Physics. In doing so, it was
recognized that the two 1998 volumes of 'Measurement Techniques in
Space Plasmas' (Particles and Fields) have been a valuable
reference and resource for advanced students and scientists who
wish to know the fundamentals of measurement techniques and
technology.
Website:
https://mtssp.msfc.nasa.gov/
Start : 2015-06-22 - End : 2015-07-02
We invite contributions on novel inversion methods with
application across the geosciences. Of particular interest are 3D
imaging, joint inversion of geodetic, geophysical and geochemical
datasets, and multi-disciplinary interpretation approaches such as
integration of gravity, EM and seismic data or thermo-mechanical
modelling studies constrained by physical parameters.
Modelling of Space Weather Effects: Solar, Magnetospheric and
Earth Resistivity Constraints (IAGA, IAMAS)
In this symposium we welcome contributions on all aspects of the
modelling of space weather and its effects, from the Sun to Earth.
This includes the modelling of the various interactions between
travelling solar storms and the solar wind, magnetosphere,
ionosphere and solid Earth and the validation of models through
measurements. Contributions on models developed to aid end-users,
such as satellite and power grid operators, survive the impact of
space weather are also encouraged.
Website:
http://www.iugg2015prague.com/joint-inter-association-symposia.htm#JA
Presentation given during a users' visit about the STCE operational space weather services and products.
http://www.spaceweather.eu/en/repository/show?id=534
Presentation given during a users' visit about the STCE operational space weather services and products.
http://www.spaceweather.eu/en/repository/show?id=535
Presentation given during a users' visit about the STCE operational space weather services and products.
http://www.spaceweather.eu/en/repository/show?id=536
Presentation given during a users' visit about the STCE operational space weather services and products.
http://www.spaceweather.eu/en/repository/show?id=537
Presentation given during a users' visit about the STCE operational space weather services and products.
http://www.spaceweather.eu/en/repository/show?id=538
Presentation given during a users' visit about the STCE operational space weather services and products.
http://www.spaceweather.eu/en/repository/show?id=539
Presentation given during a users' visit about the STCE operational space weather services and products.
http://www.spaceweather.eu/en/repository/show?id=540
http://www.spaceweather.eu/en/repository/show?id=541