
The Solar-Terrestrial Centre of Excellence (STCE) is a collaborative network of the Belgian Institute for Space Aeronomy, the Royal Observatory of Belgium and the Royal Meteorological Institute of Belgium.
|
Published by the STCE - this issue : 7 Aug 2015. The Solar-Terrestrial Centre of Excellence (STCE) is a collaborative network of the Belgian Institute for Space Aeronomy, the Royal Observatory of Belgium and the Royal Meteorological Institute of Belgium. |
| Archive of the newsletters | Subscribe to this newsletter by mail |
Solar activity has been very low over the last few weeks, with the last big solar flare already dating back to 25 June. That day, NOAA 2371 produced the last and strongest of its series of 6 M-class flares. The M7.9 flare peaked at 08:16UT and its space weather effects were extensively discussed in the 3 July 2015 Newsletter (see http://www.stce.be/newsletter/pdf/2015/STCEnews20150703.pdf).
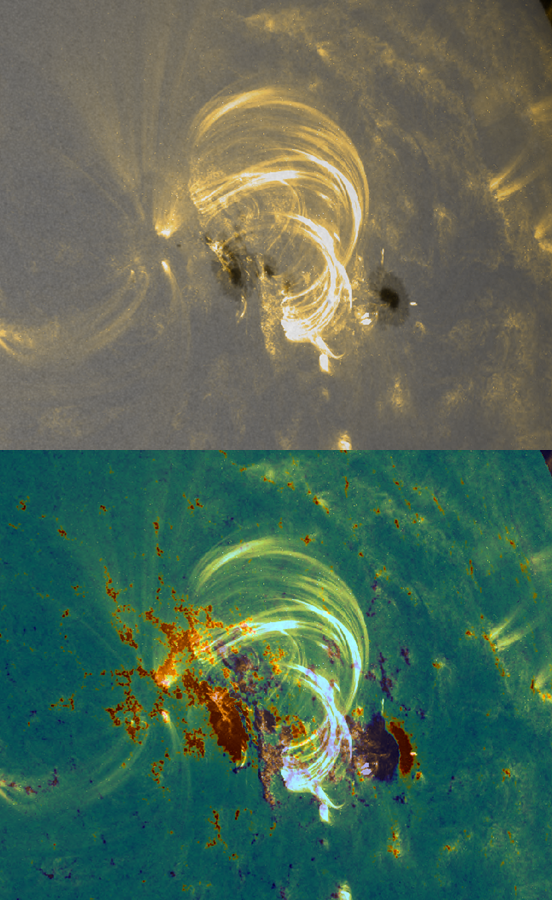
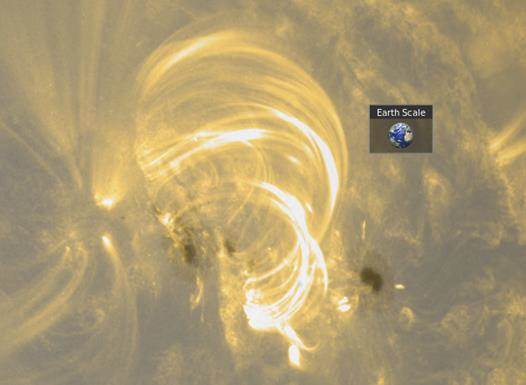
The most amazing aspect of this eruption were the complex series of post-flare coronal loops that accompanied this event. The above pictures were taken on 11:21UT. An extreme ultra-violet (EUV) SDO/AIA 171 image (http://sdo.gsfc.nasa.gov/) has been laid over resp. an SDO/HMI white light image (top) and a magnetogram (bottom; red is positive polarity, blue is negative). It shows that the flare took place mostly in the trailing portion of the sunspot group, with the footpoints of the coronal loops anchored in the opposite polarity patches of which this area was made up. The coronal loops are huge. The picture below shows a zoom on the EUV image overlaid on the white light image, with the Earth sized to the same scale. The main spots are large enough to accomodate one Earth at least, but it would require several Earths to fit the entire height of the coronal loops!
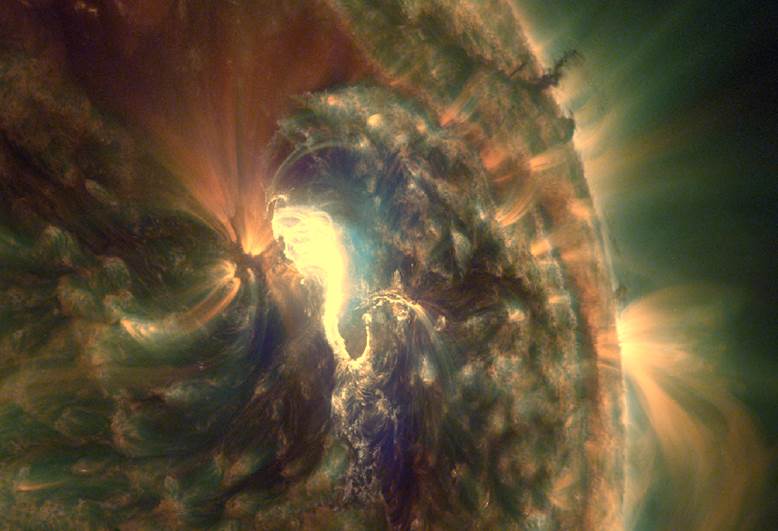
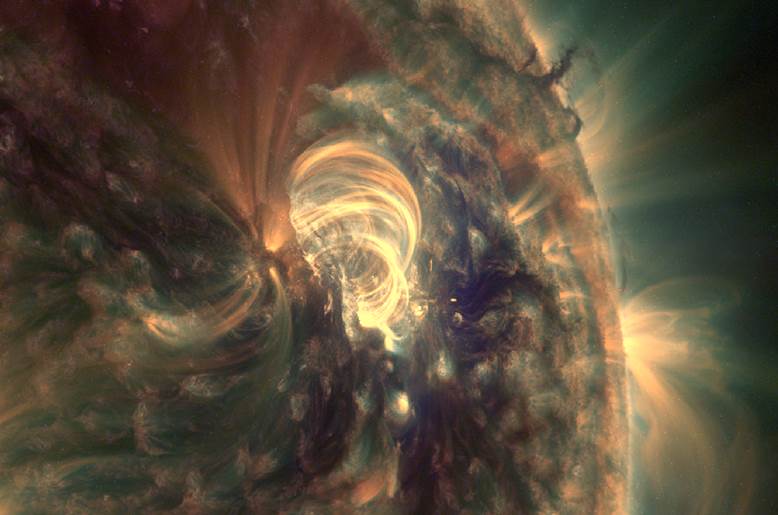
The images below are stills from the movie at https://youtu.be/hkRFDr4uCeE These are combination images (http://helioviewer.org/) from SDO/AIA 171, 193 and 131, showing essentially the hot parts of the eruption. The yellow-orange colors denote temperatures of about 700.000 degrees, the blue hues show very hot areas with temperatures of several million degrees. The top image was taken at 08:40UT and shows the flare in progress as well as some coronal dimming to the southwest. The bottom image was taken at 11:21UT and shows the complexity of the arcade. The coronal loops continued to grow and remained visible for the rest of the day as the magnetic fields kept on restructuring.
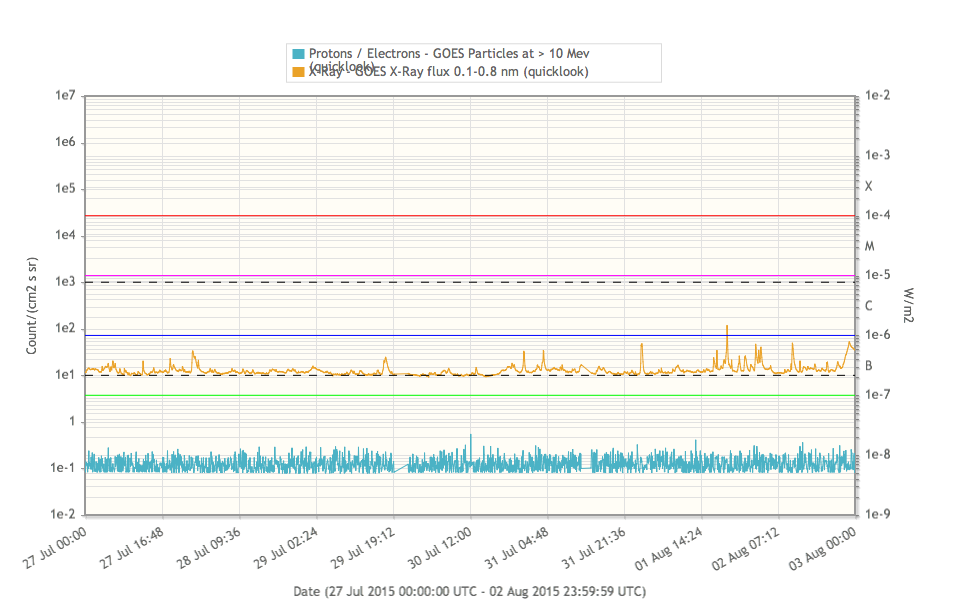
Solar activity was very low during the full week, only 1 C-class flare was observed (on August 1 from NOAA AR 2390). The background X-ray flux measured by GOES was situated in the B-level. The proton flux, also measured by GOES, did not bring any surprises.
So, far this weeks review of solar activity.
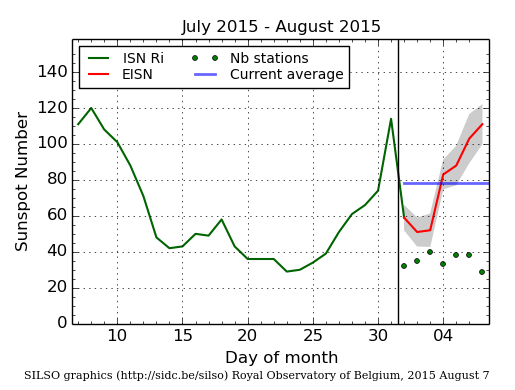
Daily Estimated International Sunspot Number (EISN, red curve with shaded error) derived by a simplified method from real-time data from the worldwide SILSO network. It extends the official Sunspot Number from the full processing of the preceding month (green line). The plot shows the last 30 days (~ one solar rotation). The horizontal blue line shows the current monthly average, while the green dots give the number of stations included in the calculation of the EISN for each day.
Solar flare activity fluctuated between very low and low during the week.
In order to view the activity of this week in more detail, we suggest to go to the following website from which all the daily (normal and difference) movies can be accessed: http://proba2.oma.be/ssa
This page also lists the recorded flaring events.
A weekly overview movie can be found here (SWAP week 279).
http://proba2.oma.be/swap/data/mpg/movies/weekly_movies/weekly_movie_2015_07_27.mp4
Details about some of this week’s events, can be found further below.
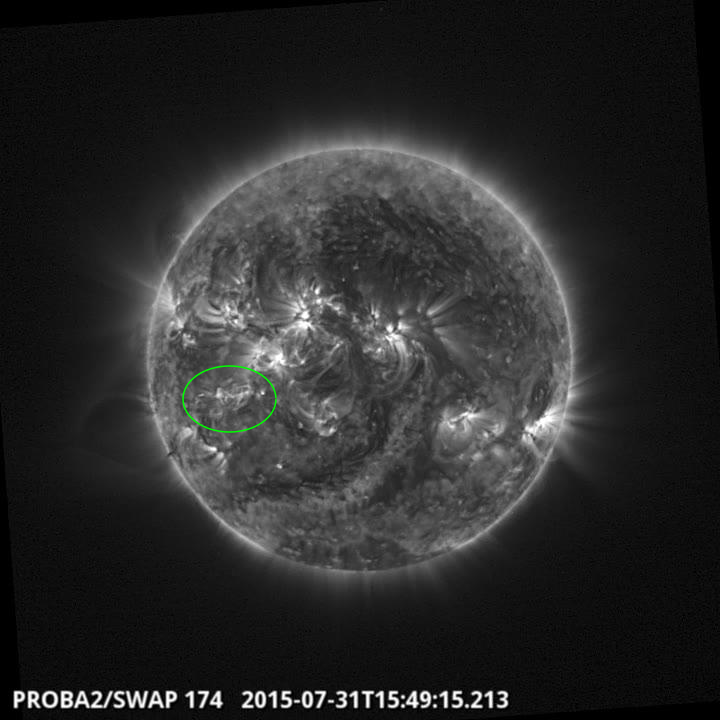
Jet the south east quad @ 15:49 SWAP image
Find a movie of the event here (SWAP movie)
http://proba2.oma.be/swap/data/mpg/movies/2015/07/20150731_swap_movie.mp4
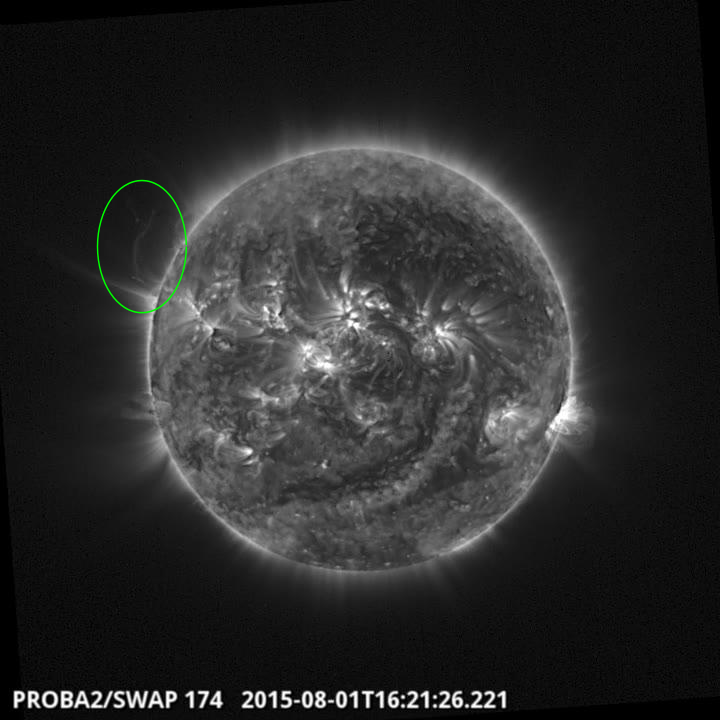
Plasma dynamics on the east limb @ 16:21 SWAP image
Find a movie of the event here (SWAP movie)
http://proba2.oma.be/swap/data/mpg/movies/20150801_swap_diff.mp4
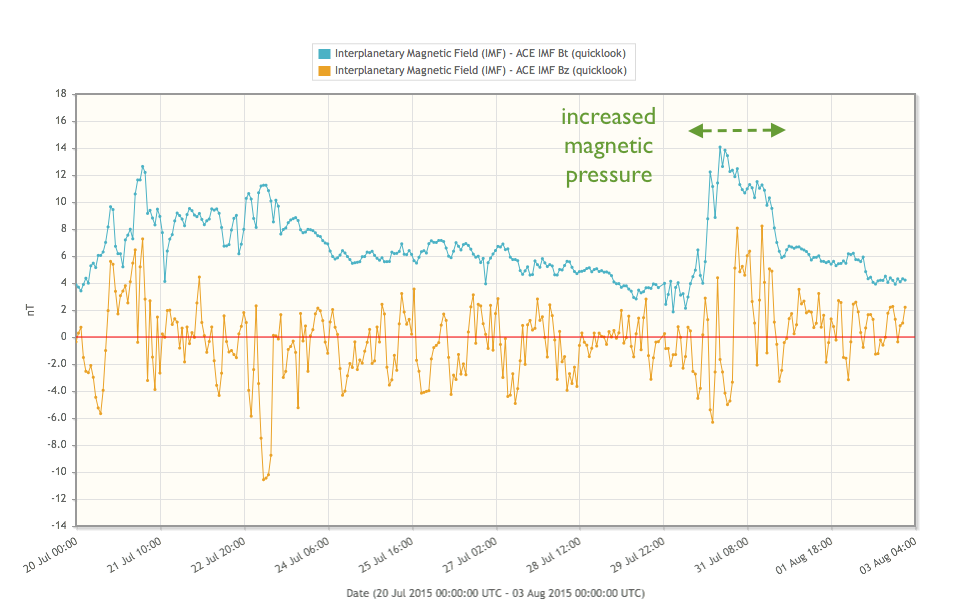
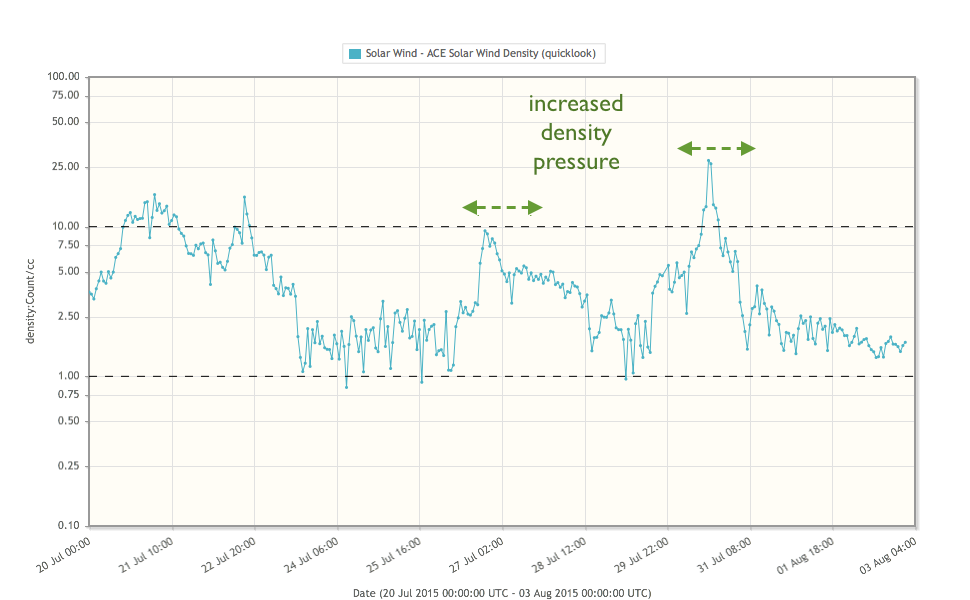
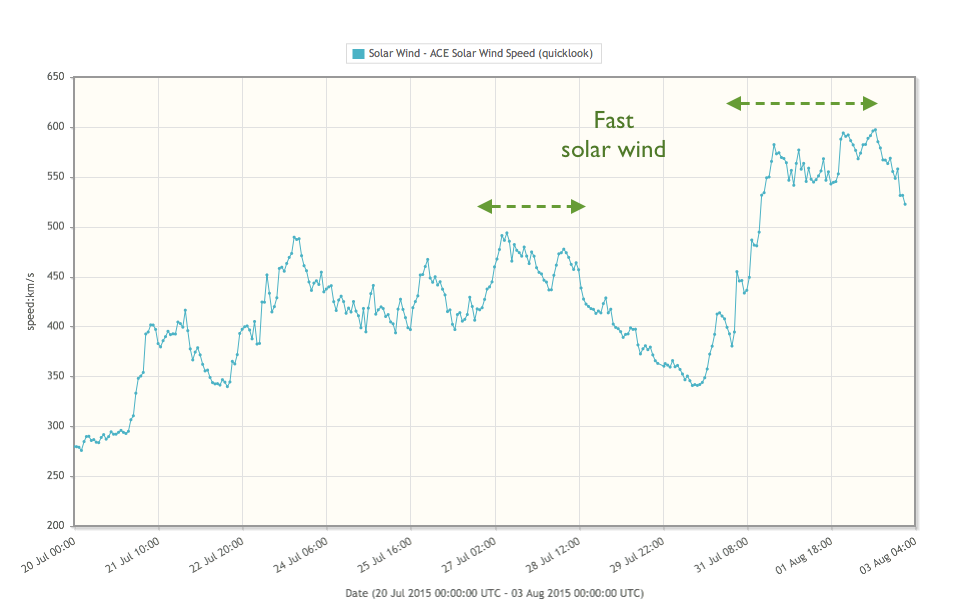
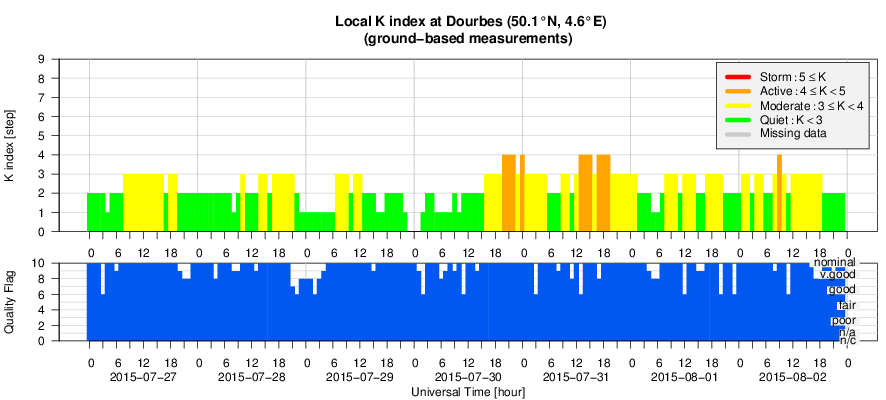
A fast speed stream caused active geomagnetic conditions on July 27, a following fast speed stream resulted in similar active conditions on August 30-31. It was the combination of a fast solar wind with increased density and magnetic pressure that was able to disturb the earth magnetic shield.
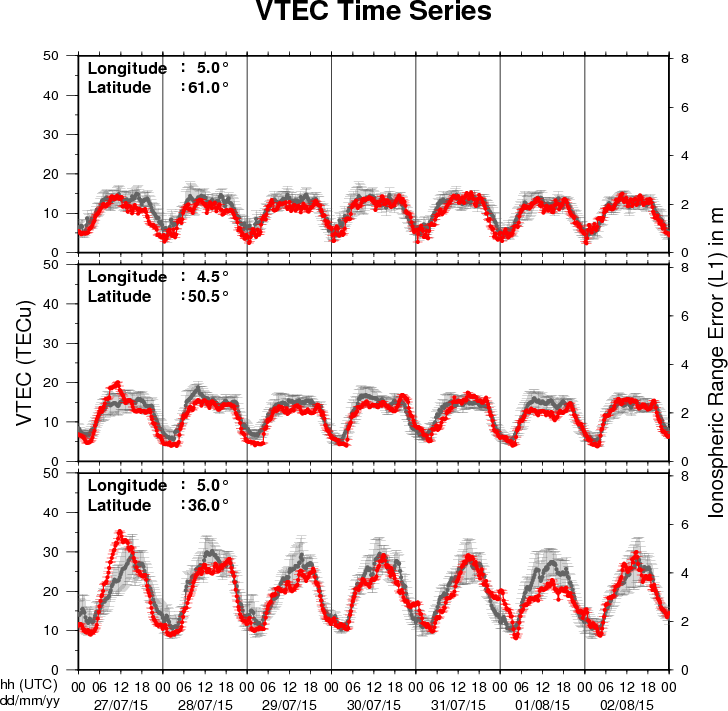
The figure shows the time evolution of the Vertical Total Electron Content (VTEC) (in red) during the last week at three locations:
a) in the northern part of Europe(N61°, 5°E)
b) above Brussels(N50.5°, 4.5°E)
c) in the southern part of Europe(N36°, 5°E)
This figure also shows (in grey) the normal ionospheric behaviour expected based on the median VTEC from the 15 previous days.
The VTEC is expressed in TECu (with TECu=10^16 electrons per square meter) and is directly related to the signal propagation delay due to the ionosphere (in figure: delay on GPS L1 frequency).
The Sun's radiation ionizes the Earth's upper atmosphere, the ionosphere, located from about 60km to 1000km above the Earth's surface.The ionization process in the ionosphere produces ions and free electrons. These electrons perturb the propagation of the GNSS (Global Navigation Satellite System) signals by inducing a so-called ionospheric delay.
See http://stce.be/newsletter/GNSS_final.pdf for some more explanations ; for detailed information, see http://gnss.be/ionosphere_tutorial.php
Start : 2015-08-22 - End : 2015-08-23
On August 21, 2017, a total eclipse of the Sun will cross the
United States from coast to coast, giving tens of millions of
people in a 70-mile-wide path from Oregon to South Carolina a
chance to see the solar corona and experience "darkness at midday."
Outside the path of totality, all of North America will experience
a partial eclipse. This event, the first total solar eclipse to
touch the US mainland since 1979 and the first to span the
continent since 1918, presents a unique opportunity to excite
people about science and connect them personally to the cosmos, as
well as to conduct several important scientific observations. We
are a working group dedicated to the science and public outreach of
this unique event.
The next Eclipse 2017 workshop will take place in Portland,
Oregon, on Saturday and Sunday, August 22 and 23, 2015, at the
Oregon Museum of Science and Industry, hosted by the director Jim
Todd. Saturday's morning session will be open to the public at
large, with presentations to inform the public about the total
solar eclipse of 2017. The Saturday afternoon and Sunday sessions
will follow a schedule similar to those at previous workshops with
presentations alternating with smaller group discussions, and a
final presentation of small group results.
Website:
https://aas.org/education/outreach/eclipse-2017
Start : 2015-08-24 - End : 2015-08-28
Following the success of previous CESRA summer schools, Glasgow
University is hosting the 2015 CESRA radio summer school on the
24-28th August 2015. The Glasgow CESRA Summer School 2015 is your
chance to learn about the exciting world of solar radio
physics.
The school is open to solar radio physicists including PhD
students and early career researchers. The school will cover the
essential elements of theory, modelling and data analysis and will
feature lectures and tutorials. Students will have the opportunity
to meet and discuss research topics with their peers together in an
informal atmosphere.
Website:
http://www.astro.gla.ac.uk/cesra2015
Start : 2015-10-26 - End : 2015-10-29
Erupting prominences/filaments, surges, flares, and coronal mass
ejections (CMEs) are prominent examples of the dynamic Sun.
Multi-wavelength and multi-instrument observations have the
potential to reveal highly energetic physical processes on the Sun
reaching from the photosphere, over the chromosphere and the
transition region, to the corona and beyond. Solar physicists have
nowadays access to a suite of new ground-based observing facilities
including, for example, the 1.5-meter GREGOR solar telescope at the
Observatorio del Teide, Tenerife, Spain, the European Low Frequency
Array (LOFAR), the Atacama Large Millimeter/Submillimeter Array
(ALMA) in Chile, and the Coronal Multi-Channel Polarimeter for
Slovakia (COMP-S) at Lomnicky Peak Observatory. A powerful fleet of
space missions, for example, the Reuven Ramaty High Energy Solar
Spectroscopic Imager (RHESSI), the Japanese Hinode, and the Solar
Dynamics Observatory (SDO), adds more capabilities to investigate
magnetic fields, complex plasma flows, and accelerated particle,
and thermal properties of solar eruptive events. In the tradition
of the series of »Potsdam Thinkshops«, we
invite instrument specialists, observers, modellers, and theorists
to exchange ideas, to stimulate discussion, to initiate future
collaborations among participants, and to attract new users of
instruments by showcasing the capabilities. The aim is to make
progress towards a comprehensive description of solar eruptive
events effectively aggregating their global properties as well as
their highly dynamic fine structure. Thinkshop 12 takes place at
the science park »Albert Einstein«, home to
AIP's Great Refractor and the Solar Observatory Einstein Tower at
the Telegraphenberg.
Website:
https://thinkshop.aip.de/12/cms/
Start : 2015-10-26 - End : 2015-10-29
The IRIS-5 workshop will be conducted at the Inter-University
Centre for Astronomy and Astrophysics (IUCAA), Pune, India from
October 26-29, 2015. This workshop is mainly aimed at the
participants who could not attend IRIS-4, which is being held at
Boulder, USA. Therefore, set up of the IRIS-5 workshop would be
essentially be very similar to that of IRIS-4.
The main aim of the workshop is to introduce the Interface
Region Imaging Spectrometer (IRIS) to students and young post docs.
This would be done through tutorials on IRIS data analysis, physics
of optically thick radiative transfer, MHD simulations of the solar
atmosphere related to IRIS and hydrodynamic simulations of flares.
There will be lectures as well as hands on sessions.
Website:
http://www.iucaa.ernet.in/~solar/Welcome.html
Start : 2015-11-09 - End : 2015-11-11
The fundamentally most important source of inner heliospheric
plasma physics and space weather is the active Sun, its solar
active region eruptions. Prediction of the evolution and influence
of solar active regions on solar storms in the near-Earth
environment is of particular interest to several forecasting
institutions, industrial stakeholders, and the public in
general.
State-of-the-art solar storm prediction tools are limited to
monitoring solar active regions, registering eruptions and mass
ejections while attempting, then, at extrapolating subsequent
evolution and spatio-temporal propagation: no realistic
physics-based and data-driven synthesis tool exists, which is
capable of predicting when a solar flare will be triggered, or when
a Coronal Mass Ejection will be launched into inter-planetary
space. In short, we are not yet able to answer the question: When
and why do solar storms launch?
Our meeting will be focused around initiation of space weather
events at the Sun. We will discuss and develop three major
challenges, and we aim to develop a draft resolution road-map for
those challenges during the meeting.
Website:
https://indico.nbi.ku.dk/conferenceDisplay.py?confId=817
Start : 2015-11-13 - End : 2015-11-13
With the launch of NASA's Solar Dynamics Observatory (SDO)
mission on 02/11/2010, researchers in solar physics have entered
the era of Big Data. The Atmospheric Imaging Assembly (AIA)
instrument on SDO provides imaging data and the Helioseismic and
Magnetic Imager (HMI) instrument on SDO provides magnetic field
data. Both instruments record data at a high spatial resolution and
a time cadence, amounting to about 1 Petabyte of scientific data
each year. The Big Data challenges in Solar Astronomy are expected
to grow even further with the inauguration of the NSF funded Daniel
K. Inouye Solar Telescope (DKIST), currently under construction in
Hawaii. This telescope is expected to generate: 3-5 Petabytes of
data per year.
Start : 2016-06-27 - End : 2016-07-01
Website:
http://www.issibern.ch/program/workshops.html
The STCE Annual Report 2013 is a compilation of the activities done in 2013 within the frame of the Solar-Terrestrial Centre of Excellence (STCE). This report continues the style from the previous edition. Hence, as it is targeting a more general public, it presents only a selection of the 2013-activities in easy-to-digest summaries. These summaries emphasize the intense collaboration between the institutes at the Space Pole, as well as with our external partners. We hope you enjoy this report, which features articles on solar and space weather activity, the Open Doors at the Space Pole, the 10th European Space Weather Week, a new value for the solar constant, quality assessment of ozonesonde data, BRAMS, PICASSO, ionospheric monitoring, and much more... Happy reading!
http://www.spaceweather.eu/en/repository/show?id=584
Application for the annual prize Science Communication awarded by the Koninklijke Vlaamse Academie van België voor Wetenschappen en Kunsten.
http://www.spaceweather.eu/en/repository/show?id=585
Report on the eHEROES deliverable 'Hitchhikers' guide to space'.
http://www.spaceweather.eu/en/repository/show?id=586
Report on the first period of the FP7 project eHEROES
http://www.spaceweather.eu/en/repository/show?id=587
Report of the second and final period of the FP7 project eHEROES
http://www.spaceweather.eu/en/repository/show?id=588
Report on the eHEROES deliverable 'The Space Weather News'.
http://www.spaceweather.eu/en/repository/show?id=589
Report on the FP7 project eHEROES deliverable Information and Education
http://www.spaceweather.eu/en/repository/show?id=590
Report on the FP7 project eHEROES summer school
http://www.spaceweather.eu/en/repository/show?id=591