
The Solar-Terrestrial Centre of Excellence (STCE) is a collaborative network of the Belgian Institute for Space Aeronomy, the Royal Observatory of Belgium and the Royal Meteorological Institute of Belgium.
|
Published by the STCE - this issue : 4 Sep 2015. The Solar-Terrestrial Centre of Excellence (STCE) is a collaborative network of the Belgian Institute for Space Aeronomy, the Royal Observatory of Belgium and the Royal Meteorological Institute of Belgium. |
| Archive of the newsletters | Subscribe to this newsletter by mail |
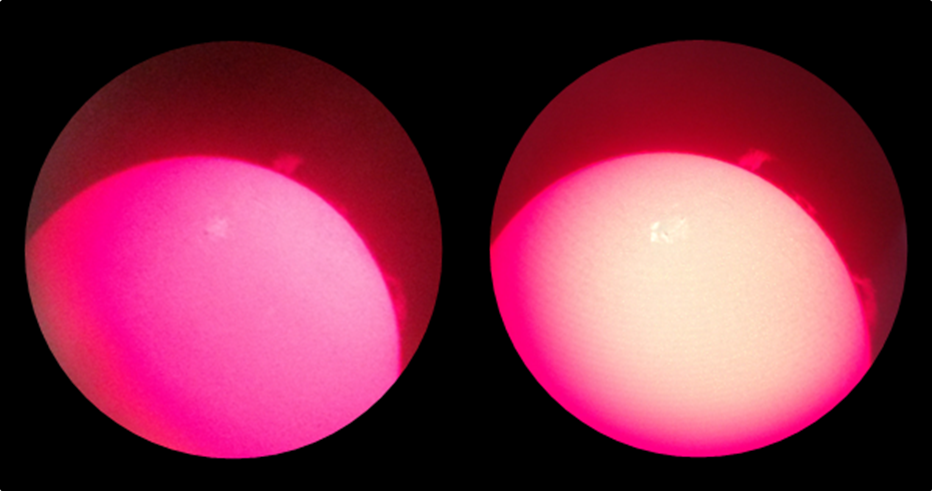
NOAA 2403, an active region visible during the last 2 weeks of August, has been one of the largest and most complex sunspot groups so far this year. Its maximum surface area was 7 times that of the Earth, and its mixed magnetic polarities were the source of numerous small and moderate solar flares. No wonder that many astronomers took the time for a photoshoot of this marvellous sunspot group!
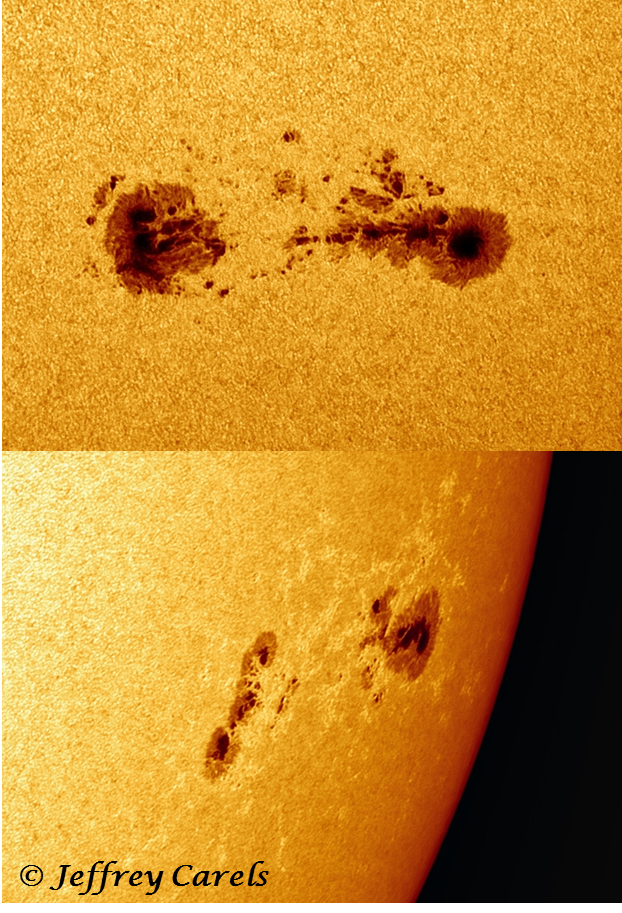
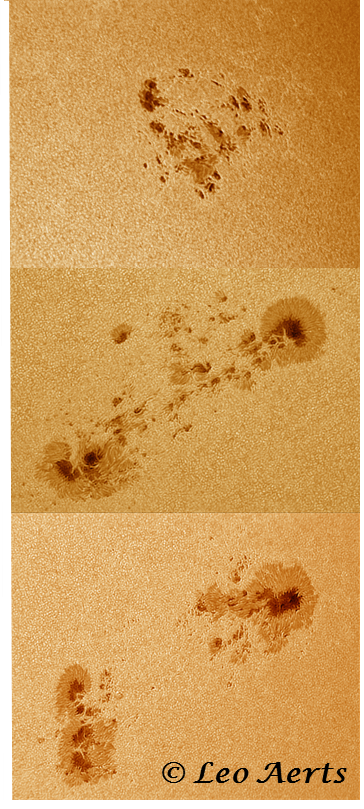
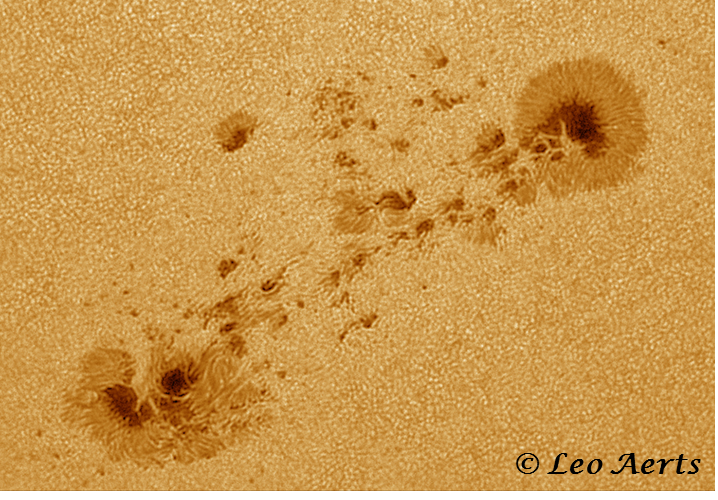
The impressive pictures above were taken by Jeffrey Carels from the Belgian Solar Section who imaged NOAA 2403 on 24 (top) and 28 August (bottom) using only a 10cm refractor. The astonishing images below were acquired by renowned astrophotographer Leo Aerts who used a 14cm Schmidt-Cassegrain with red filter. The images show the evolution of the group from a pile of small sunspots on 20 August, over a mature active region on 23 August, to an open structured bipolar group on 26 August. Using solar eclipse glasses, the group was visible with the naked (unaided) eye during this period (23-26 August).
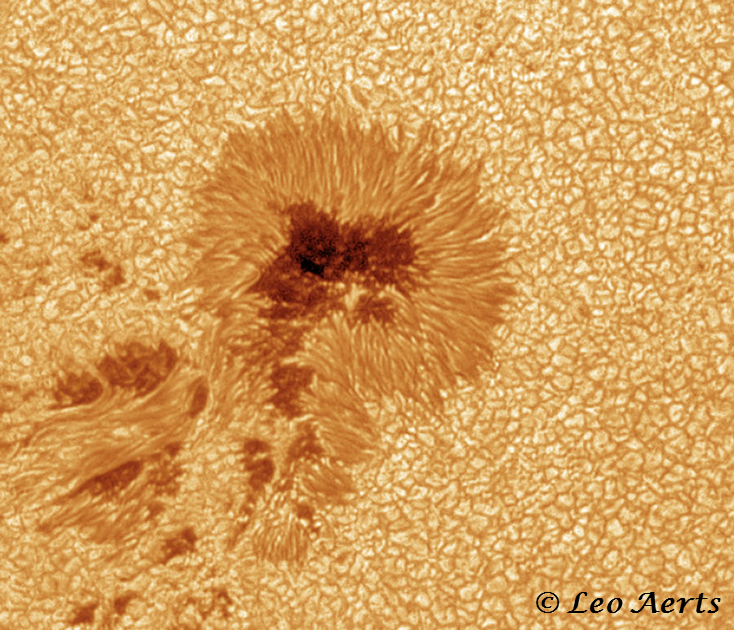
Leo Aerts also took this amazing picture of NOAA 2403's leading portion, showing very fine details in the umbra and penumbra of the spots, as well as the solar granulation (the polygonal cells outside the sunspots).
NOAA 2403 produced no less than 85 C-class and 11 M-class flares, making it one of the most flare-active regions of the current solar cycle. A small 4 cm H-alpha telescope shows the inner solar atmosphere and provides already a good view on the eruptive processes on the solar surface. One of the M-class flares on 21 August (M1.4 peaking at 09:48UT) was imaged using just such a small telescope and a handheld GSM. The image to the left shows the undisturbed region at 08:41UT, where the image to the right shows the flare at its maximum at 09:48UT. The flare is clearly located to the west (left in pictures below) of NOAA 2403's leading portion. A movie from NSO's GONG H-alpha network (http://halpha.nso.edu/) can be found at http://www.stce.be/news/317/M1_21Aug15_GONG.wmv (09:36-10:46UT).
A jaw-dropping high-resolution H-alpha movie of the aftermath of the M1.4 flare was made by the Dutch astrophotographer codenamed "Neo", using a 15 cm refractor telescope modified for H-alpha viewing. The clip lasts 2 seconds and covers 22 minutes of observation time. It can be admired at http://www.astroforum.nl/showthread.php/159736-De-zon-AR2403-en-Class-M-flares-timelapse
Solar flare activity fluctuated between low and moderate during the week.
In order to view the activity of this week in more detail, we suggest to go to the following website from which all the daily (normal and difference) movies can be accessed: http://proba2.oma.be/ssa.
This page also lists the recorded flaring events.
A weekly overview movie can be found here: http://proba2.sidc.be/swap/data/mpg/movies/weekly_movies/weekly_movie_2015_08_24.mp4 (SWAP week 283).
Throughout the week AR 2403 has been very active, producing several M-class flares, the largest being an M5.6 flare on 2015-08-24 around 07h33 UT. SWAP nicely observed a succession of events in that region, see the annotated image below, and the daily SWAP movie from 2015-08-24:
http://proba2.sidc.be/swap/data/mpg/movies/20150824_swap_movie.mp4
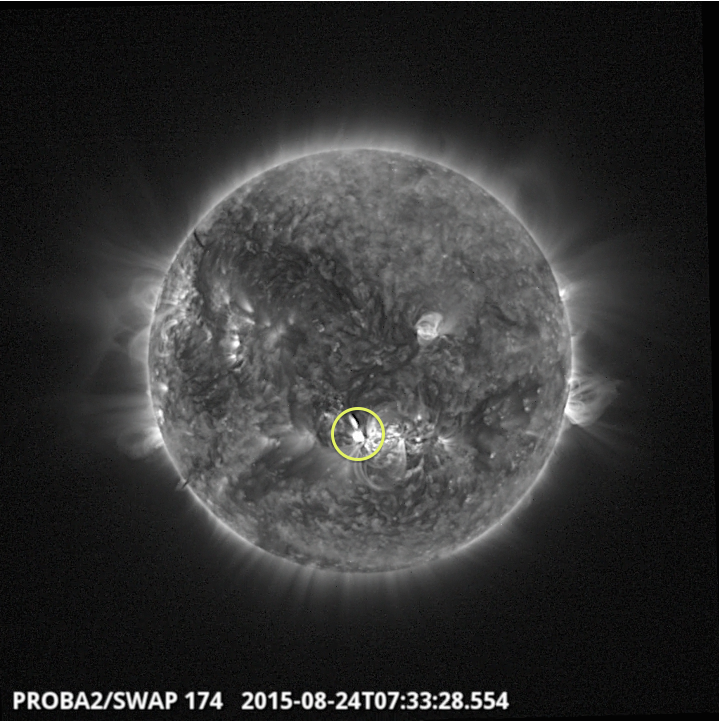
Solar activity was dominated by AR 2403 which was the only (significant) region on disk, as it remained active while transitting the Western hemisphere. It produced 6 M flares: the largest an M5.6 flare peaking at 7:33UT on August 24, while all other flares were below M3 level. Several additional C flares were produced by the region.

A warning condition for proton events was maintained during most of the period, but proton levels remained at background values throughout the period.
Some of the flaring activity was eruptive but none resulted in significant Earth directed CME's. No (partial) CME's were detected over the period.
| DAY | BEGIN | MAX | END | LOC | XRAY | OP | 10CM | TYPE | Cat | NOAA |
| 24 | 0726 | 0733 | 0735 | S15W4 | M5.6 | 1B | 100 | III/3 | 2403 | |
| 24 | 1740 | 1746 | 1749 | M1.0 | 2403 | |||||
| 27 | 0448 | 0544 | 0603 | S14W45 | M2.9 | 1N | III/2 | 2403 | ||
| 28 | 1304 | 1316 | 1323 | S14W65 | M2.2 | 1F | 2403 | |||
| 28 | 1856 | 1903 | 1906 | S13W70 | M2.1 | 1N | 2403 | |||
| 30 | 0201 | 0330 | 0423 | M1.4 | 2403 |
| LOC: approximate heliographic location | TYPE: radio burst type |
| XRAY: X-ray flare class | Cat: Catania sunspot group number |
| OP: optical flare class | NOAA: NOAA active region number |
| 10CM: peak 10 cm radio flux |
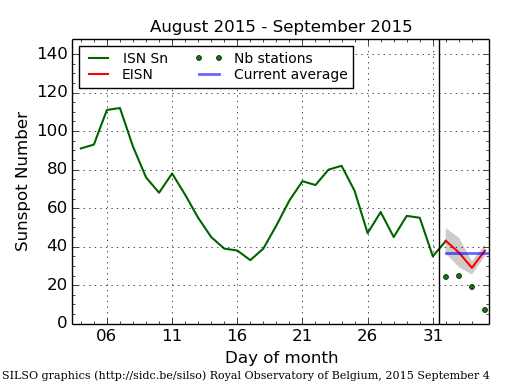
Daily Estimated International Sunspot Number (EISN, red curve with shaded error) derived by a simplified method from real-time data from the worldwide SILSO network. It extends the official Sunspot Number from the full processing of the preceding month (green line). The plot shows the last 30 days (~ one solar rotation). The horizontal blue line shows the current monthly average, while the green dots give the number of stations included in the calculation of the EISN for each day.
Solar wind conditions were recovering from a high speed stream from a positive polarity coronal hole at the start of the period. A possible impact from the weak (partial) halo CME of August 22 was expected on late august 25, but arrived August 26 without appreciable shock signatures or solar wind velocity increase. Nevertheless it caused a rise in total magnetic field up to 17nT and an extended period of continuous and pronounced negative Bz with peaks down to -15nT. These effects persisted through the sector boundary crossing around noon August 27 and up to the arrival of a high speed stream from a negative polarity coronal hole late August 28.
Geomagnetic conditions reached storm levels under the CME influence as well as under the compression region associated to the high speed stream arrival.
While local K Dourbes reached just minor storm levels (local K Dourbes 5) late August 26 at the start of the CME influence, planetary NOAA Kp reached major storm levels (Kp=7) at that occasion. In the wake of the CME local K Dourbes as well as the planetary NOAA Kp reached moderate storm levels (K=6). The high speed stream arrival in turn only caused active geomagnetic conditions locally (local K Dourbes 4) while again reaching major storm levels at planetary level (NOAA Kp 7).

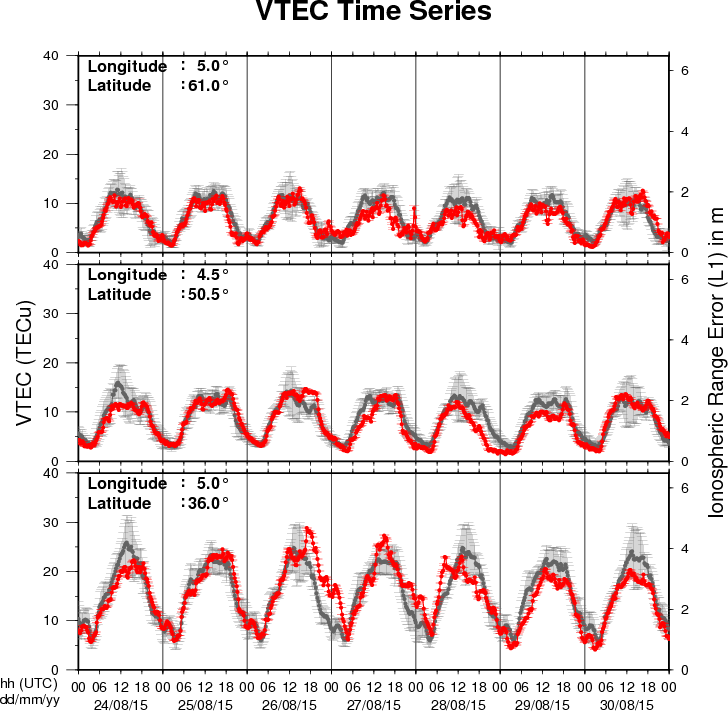
The figure shows the time evolution of the Vertical Total Electron Content (VTEC) (in red) during the last week at three locations:
a) in the northern part of Europe(N61°, 5°E)
b) above Brussels(N50.5°, 4.5°E)
c) in the southern part of Europe(N36°, 5°E)
This figure also shows (in grey) the normal ionospheric behaviour expected based on the median VTEC from the 15 previous days.
The VTEC is expressed in TECu (with TECu=10^16 electrons per square meter) and is directly related to the signal propagation delay due to the ionosphere (in figure: delay on GPS L1 frequency).
The Sun's radiation ionizes the Earth's upper atmosphere, the ionosphere, located from about 60km to 1000km above the Earth's surface.The ionization process in the ionosphere produces ions and free electrons. These electrons perturb the propagation of the GNSS (Global Navigation Satellite System) signals by inducing a so-called ionospheric delay.
See http://stce.be/newsletter/GNSS_final.pdf for some more explanations ; for detailed information, see http://gnss.be/ionosphere_tutorial.php
Start : 2015-10-26 - End : 2015-10-29
Erupting prominences/filaments, surges, flares, and coronal mass
ejections (CMEs) are prominent examples of the dynamic Sun.
Multi-wavelength and multi-instrument observations have the
potential to reveal highly energetic physical processes on the Sun
reaching from the photosphere, over the chromosphere and the
transition region, to the corona and beyond. Solar physicists have
nowadays access to a suite of new ground-based observing facilities
including, for example, the 1.5-meter GREGOR solar telescope at the
Observatorio del Teide, Tenerife, Spain, the European Low Frequency
Array (LOFAR), the Atacama Large Millimeter/Submillimeter Array
(ALMA) in Chile, and the Coronal Multi-Channel Polarimeter for
Slovakia (COMP-S) at Lomnicky Peak Observatory. A powerful fleet of
space missions, for example, the Reuven Ramaty High Energy Solar
Spectroscopic Imager (RHESSI), the Japanese Hinode, and the Solar
Dynamics Observatory (SDO), adds more capabilities to investigate
magnetic fields, complex plasma flows, and accelerated particle,
and thermal properties of solar eruptive events. In the tradition
of the series of »Potsdam Thinkshops«, we
invite instrument specialists, observers, modellers, and theorists
to exchange ideas, to stimulate discussion, to initiate future
collaborations among participants, and to attract new users of
instruments by showcasing the capabilities. The aim is to make
progress towards a comprehensive description of solar eruptive
events effectively aggregating their global properties as well as
their highly dynamic fine structure. Thinkshop 12 takes place at
the science park »Albert Einstein«, home to
AIP's Great Refractor and the Solar Observatory Einstein Tower at
the Telegraphenberg.
Website:
https://thinkshop.aip.de/12/cms/
Start : 2015-10-26 - End : 2015-10-29
The IRIS-5 workshop will be conducted at the Inter-University
Centre for Astronomy and Astrophysics (IUCAA), Pune, India from
October 26-29, 2015. This workshop is mainly aimed at the
participants who could not attend IRIS-4, which is being held at
Boulder, USA. Therefore, set up of the IRIS-5 workshop would be
essentially be very similar to that of IRIS-4.
The main aim of the workshop is to introduce the Interface
Region Imaging Spectrometer (IRIS) to students and young post docs.
This would be done through tutorials on IRIS data analysis, physics
of optically thick radiative transfer, MHD simulations of the solar
atmosphere related to IRIS and hydrodynamic simulations of flares.
There will be lectures as well as hands on sessions.
Website:
http://www.iucaa.ernet.in/~solar/Welcome.html
Start : 2015-11-09 - End : 2015-11-11
The fundamentally most important source of inner heliospheric
plasma physics and space weather is the active Sun, its solar
active region eruptions. Prediction of the evolution and influence
of solar active regions on solar storms in the near-Earth
environment is of particular interest to several forecasting
institutions, industrial stakeholders, and the public in
general.
State-of-the-art solar storm prediction tools are limited to
monitoring solar active regions, registering eruptions and mass
ejections while attempting, then, at extrapolating subsequent
evolution and spatio-temporal propagation: no realistic
physics-based and data-driven synthesis tool exists, which is
capable of predicting when a solar flare will be triggered, or when
a Coronal Mass Ejection will be launched into inter-planetary
space. In short, we are not yet able to answer the question: When
and why do solar storms launch?
Our meeting will be focused around initiation of space weather
events at the Sun. We will discuss and develop three major
challenges, and we aim to develop a draft resolution road-map for
those challenges during the meeting.
Website:
https://indico.nbi.ku.dk/conferenceDisplay.py?confId=817
Start : 2015-11-13 - End : 2015-11-13
With the launch of NASA's Solar Dynamics Observatory (SDO)
mission on 02/11/2010, researchers in solar physics have entered
the era of Big Data. The Atmospheric Imaging Assembly (AIA)
instrument on SDO provides imaging data and the Helioseismic and
Magnetic Imager (HMI) instrument on SDO provides magnetic field
data. Both instruments record data at a high spatial resolution and
a time cadence, amounting to about 1 Petabyte of scientific data
each year. The Big Data challenges in Solar Astronomy are expected
to grow even further with the inauguration of the NSF funded Daniel
K. Inouye Solar Telescope (DKIST), currently under construction in
Hawaii. This telescope is expected to generate: 3-5 Petabytes of
data per year.
Start : 2016-06-27 - End : 2016-07-01
Website:
http://www.issibern.ch/program/workshops.html
Report on the eHEROES deliverable 'Hitchhikers' guide to space'.
http://www.spaceweather.eu/en/repository/show?id=586
Report on the first period of the FP7 project eHEROES
http://www.spaceweather.eu/en/repository/show?id=587
Report of the second and final period of the FP7 project eHEROES
http://www.spaceweather.eu/en/repository/show?id=588
Report on the eHEROES deliverable 'The Space Weather News'.
http://www.spaceweather.eu/en/repository/show?id=589
Report on the FP7 project eHEROES deliverable Information and Education
http://www.spaceweather.eu/en/repository/show?id=590
Report on the FP7 project eHEROES summer school
http://www.spaceweather.eu/en/repository/show?id=591