
The Solar-Terrestrial Centre of Excellence (STCE) is a collaborative network of the Belgian Institute for Space Aeronomy, the Royal Observatory of Belgium and the Royal Meteorological Institute of Belgium.
|
Published by the STCE - this issue : 25 Sep 2015. The Solar-Terrestrial Centre of Excellence (STCE) is a collaborative network of the Belgian Institute for Space Aeronomy, the Royal Observatory of Belgium and the Royal Meteorological Institute of Belgium. |
| Archive of the newsletters | Subscribe to this newsletter by mail |
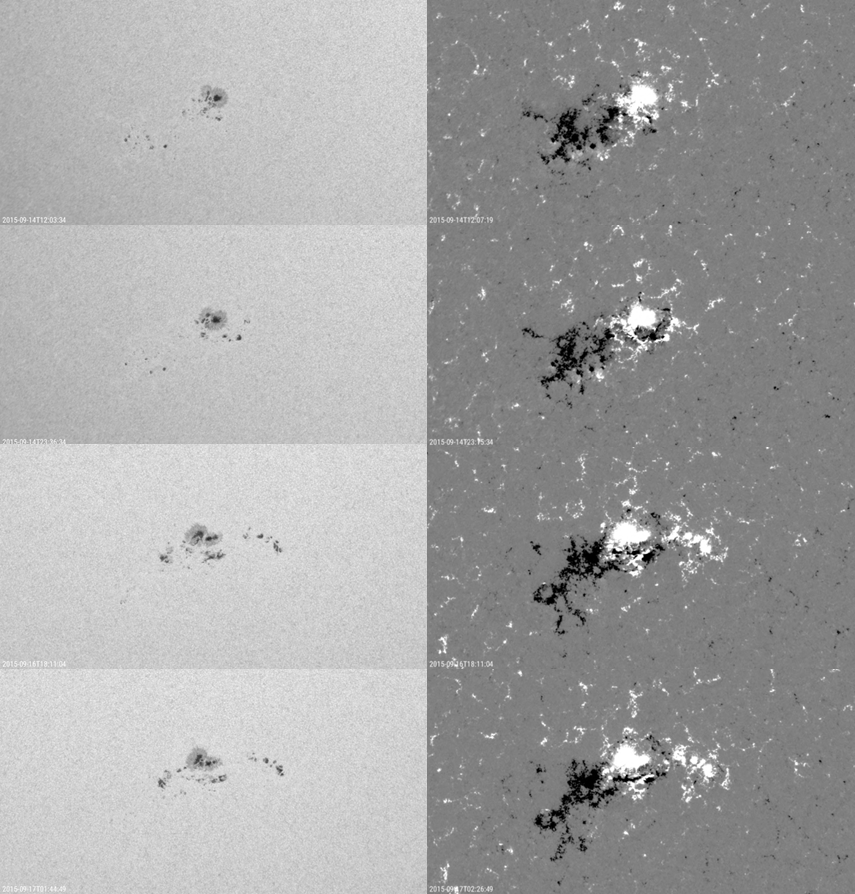
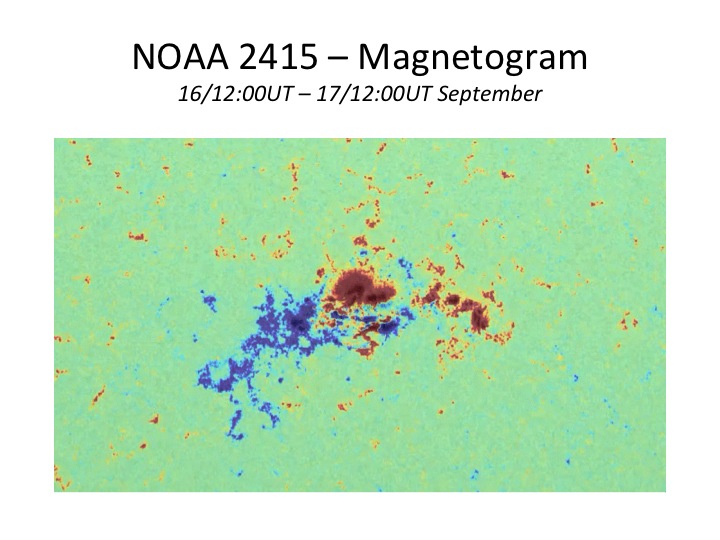
NOAA 2415 started out as a rather quiet and dull sunspot group, until during the afternoon of 14 September a bipolar magnetic flux emerged right in front (to the southwest) of NOAA 2415's main leading spot. During the next few hours and days, the newly bipolar region developed further, with the positive (white) polarity spots drifting away to the west. However, its negative (black) trailing spots remained very close to the original main spot (white), and started to interact with each other. This resulted in increasingly stronger flares on 16 and 17 September, culminating in a C9 and an M1 flare on 17 September (peaking resp. at 03:03UT and 09:40UT).
The images underneath show NOAA 2415 in white light and the corresponding magnetogram resp. on 14 September around 12:00UT, on 14 September around 23:30UT (just before a long image gap), on 16 September around 18:00UT and on 17 September around 02:00UT (just before the start of the C9 and M1 flares). White means positive polarity (magnetic field coming out of the solar surface), black means negative polarity (magnetic field returning into the solar surface).
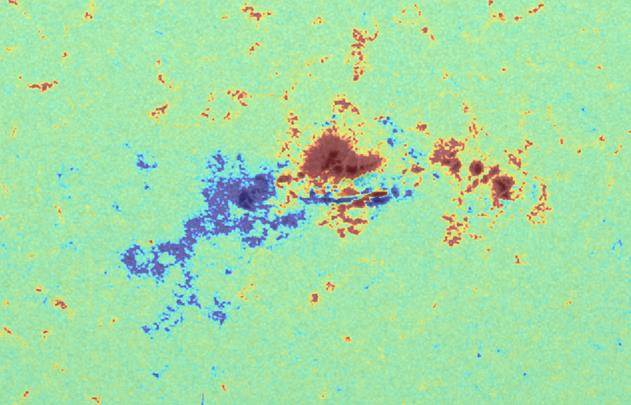
The image underneath shows a colorized version of the magnetogram overlaid on the white light image on 17 September around 04:00UT. A small delta can be seen to the southwest (lower right) of the main spot. The C9 flare had just taken place.
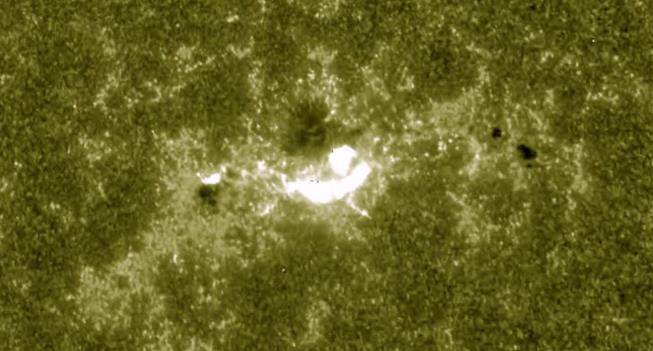
The image underneath shows the M1 flare near its maximum as seen through SDO's AIA 1600 filter (http://sdo.gsfc.nasa.gov/ ). The AIA 1600 pictures the Sun in the transition zone between the Sun's lower atmosphere and the corona (hot outer atmosphere) at temperatures of around 100.000 degrees. At the same time, it is also very sensitive for emission from the upper photosphere ("solar surface") near 5.000 degrees, which is the reason why one sees the sunspots very well too. A movie of the colorized magnetogram (30 minutes cadence) and AIA 1600 (5 minutes cadence) can be found at https://www.youtube.com/watch?v=YckB_jOZoh4
This kind of "collision" flares happen quite often and can be much stronger than the 17 September events. In fact, the strongest flare so far this solar cycle (SC24), i.e. the X6.9 flare from 09 August 2011, was also the result of two sunspot groups bumping into each other. In that particular case, the newly bipolar flux emerged behind the existing NOAA 1263 on 06 August, with the leading portion of the new flux colliding with the already existing opposite polarity trailing spots. One sometimes wonder how those sunspot groups get their driver's license!
If you want to promote your company or institute, its activities, products and services in an interactive way for the ESWW audience, the Space Weather Week Fair is your thing. Register for a fair stand and get a manned stand during the Fair event on Wednesday Nov 25, 16:30 - 18:00 and/or an unmanned stand for the whole week.
Fair - Wednesday 25th November 2015 - http://www.stce.be/esww12/program/fair.php
Registration for a fair stand: http://www.stce.be/esww12/registration.php
Since we have a limited number of stands, we adopt the first come, first served policy.
Solar flare activity fluctuated between very low and moderate during the week.
In order to view the activity of this week in more detail, we suggest to go to the following website from which all the daily (normal and difference) movies can be accessed:
http://proba2.oma.be/ssa
This page also lists the recorded flaring events.
A weekly overview movie can be found here (SWAP week 286).
http://proba2.oma.be/swap/data/mpg/movies/weekly_movies/weekly_movie_2015_09_14.mp4
Details about some of this week’s events, can be found further below.
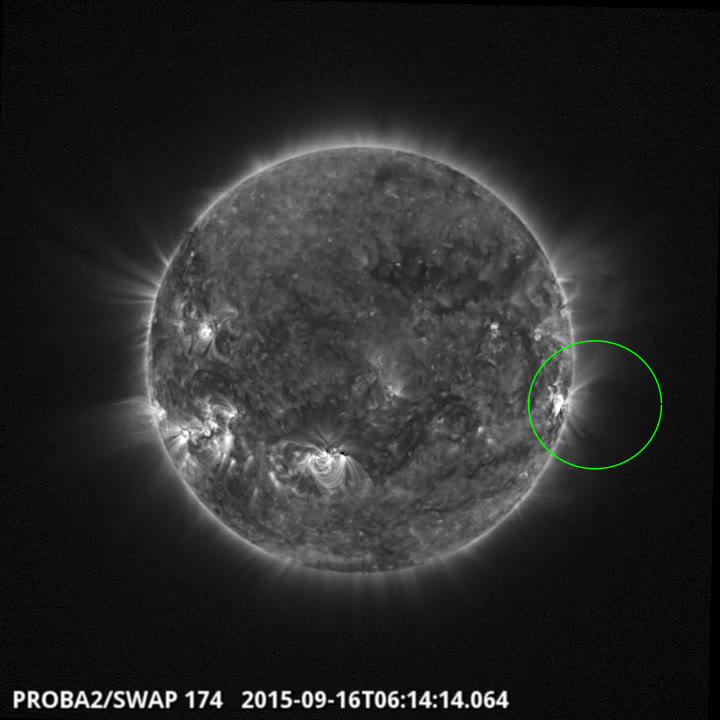
Eruption on the west limb @ 06:14 SWAP image
Find a movie of the event here (SWAP movie)
http://proba2.oma.be/swap/data/mpg/movies/20150916_swap_movie.mp4
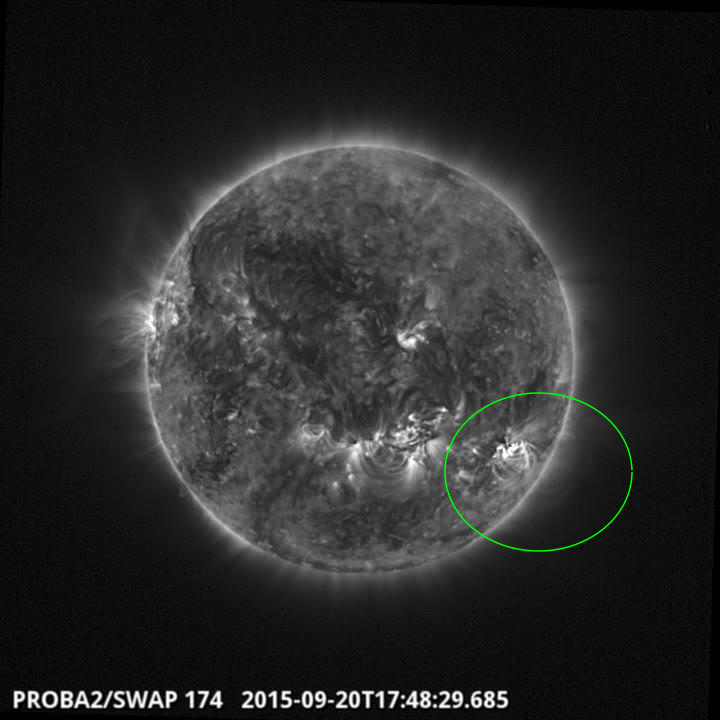
Eruption on the west limb @ 17:48 SWAP image
Find a movie of the event here (SWAP movie)
http://proba2.oma.be/swap/data/mpg/movies/20150920_swap_movie.mp4
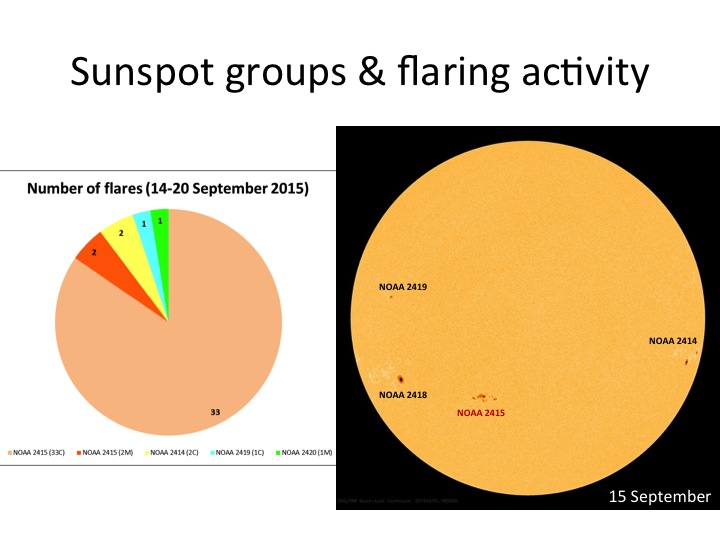
Solar activity was determined by NOAA 2415, a moderately sized sunspot group with a complex magnetic configuration.
NOAA AR 2415 produced 33 C- and 2 M-class flares: An M1.1 flare on 17 September peaking at 09:40UT, and an M2.1 flare on 20 September peaking at 18:03UT.
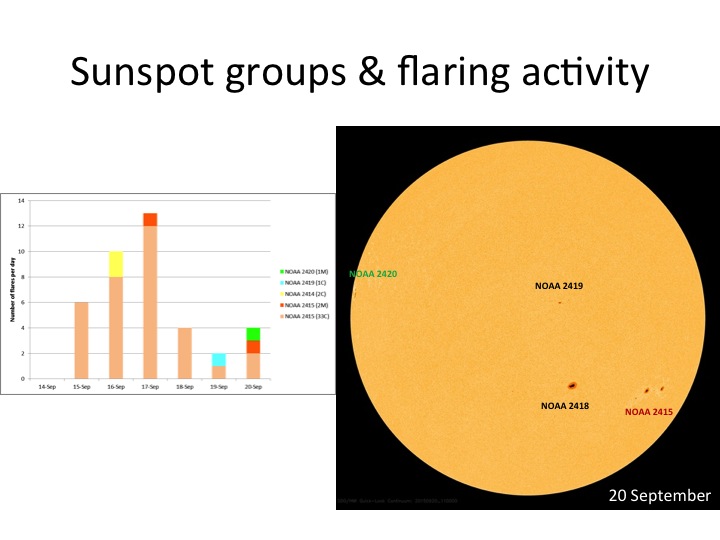
The following diagrams show when and how many >B9.9 flares happened. The white light images give an idea where the sunspot groups are located on the solar disk on September 15 and 20.
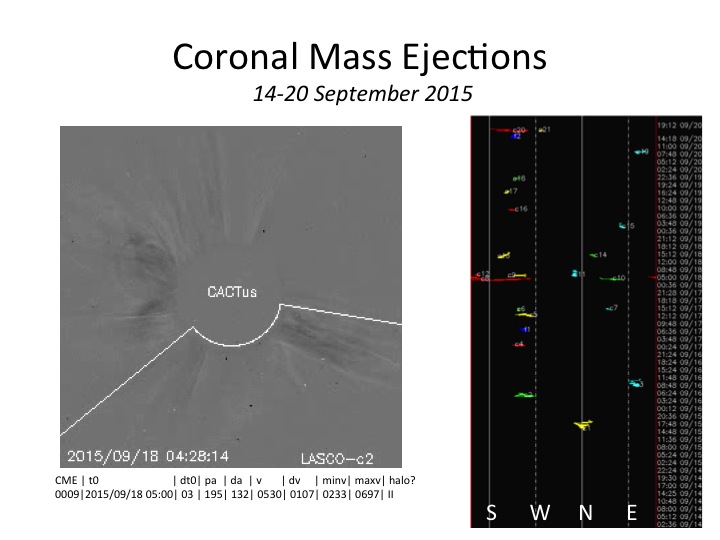
The M2.1 flare on 20 September was associated with a solid and fast (plane-of-the-sky (p-o-s) speed of 1250 km/s) coronal mass ejection (CME). In response to this M2 flare, proton flux levels were enhanced but stayed below the event threshold.
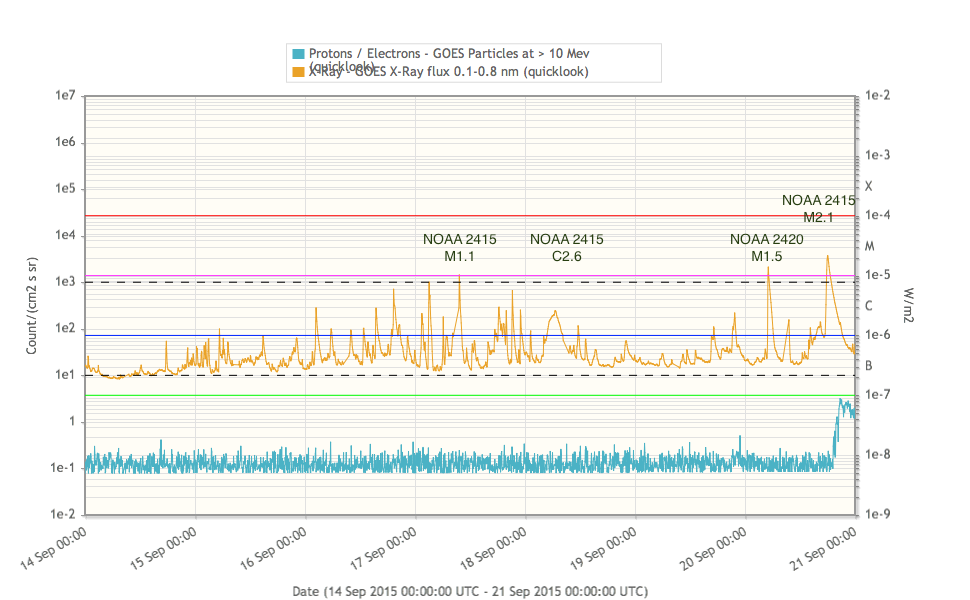
On 18 September, NOAA 2415 was the source of a long duration C2.6 flare, starting at 04:22UT, peaking at 06:31UT, and finally ending at 07:20UT. The associated CME had a p-o-s speed of 530 km/s and was expected to deliver a glancing blow late on 20 September.
NOAA 2414 and 2419 produced the remaining 3 low-level C-class flares of the period. NOAA 2420, while still rounding the northeast limb, produced this week's third M-class flare early on 20 September, peaking at 05:03UT.
Thanks to Jan Janssens, the forecaster on duty for providing input.
| DAY | BEGIN | MAX | END | LOC | XRAY | OP | 10CM | TYPE | Cat | NOAA |
| 17 | 0934 | 0940 | 0945 | S21W4 | M1.1 | SF | 31 | 2415 | ||
| 20 | 0455 | 0503 | 0517 | M1.5 | 2420 | |||||
| 20 | 1732 | 1803 | 1829 | S20W24 | M2.1 | 2N | 320 | VI/2III/1II/1 | 31 | 2415 |
| LOC: approximate heliographic location | TYPE: radio burst type |
| XRAY: X-ray flare class | Cat: Catania sunspot group number |
| OP: optical flare class | NOAA: NOAA active region number |
| 10CM: peak 10 cm radio flux |
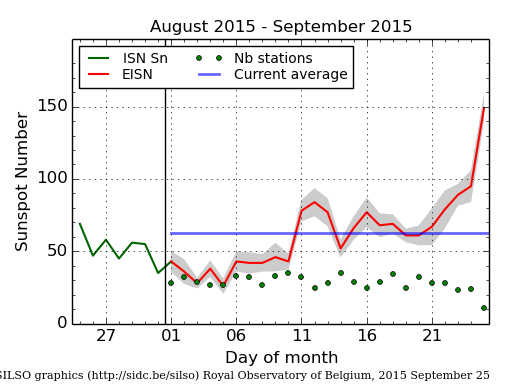
The daily Estimated International Sunspot Number (EISN, red curve with shaded error) derived by a simplified method from real-time data from the worldwide SILSO network. It extends the official Sunspot Number from the full processing of the preceding month (green line). The plot shows the last 30 days (~ one solar rotation). The horizontal blue line shows the current monthly average, while the green dots give the number of stations included in the calculation of the EISN for each day.
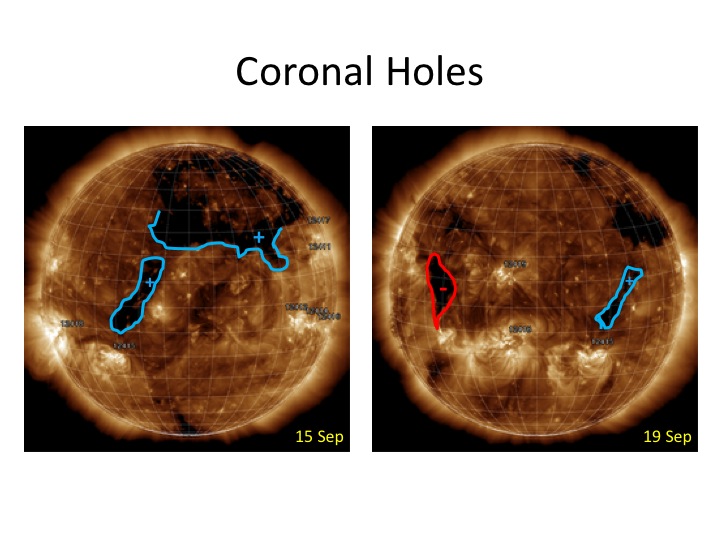
During the first half of the week, Earth was under the influence of the solar wind stream of a northern coronal hole (CH) - left picture.
Thanks to Jan Janssens, the forecaster on duty for the provided input.
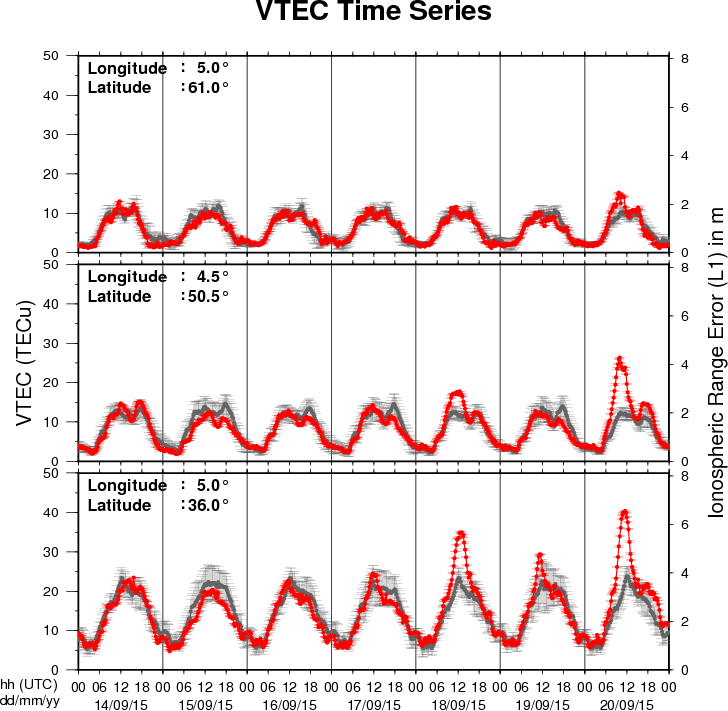
The figure shows the time evolution of the Vertical Total Electron Content (VTEC) (in red) during the last week at three locations:
a) in the northern part of Europe(N61°, 5°E)
b) above Brussels(N50.5°, 4.5°E)
c) in the southern part of Europe(N36°, 5°E)
This figure also shows (in grey) the normal ionospheric behaviour expected based on the median VTEC from the 15 previous days.
The VTEC is expressed in TECu (with TECu=10^16 electrons per square meter) and is directly related to the signal propagation delay due to the ionosphere (in figure: delay on GPS L1 frequency).
The Sun's radiation ionizes the Earth's upper atmosphere, the ionosphere, located from about 60km to 1000km above the Earth's surface.The ionization process in the ionosphere produces ions and free electrons. These electrons perturb the propagation of the GNSS (Global Navigation Satellite System) signals by inducing a so-called ionospheric delay.
See http://stce.be/newsletter/GNSS_final.pdf for some more explanations ; for detailed information, see http://gnss.be/ionosphere_tutorial.php
Start : 2015-10-26 - End : 2015-10-29
Erupting prominences/filaments, surges, flares, and coronal mass
ejections (CMEs) are prominent examples of the dynamic Sun.
Multi-wavelength and multi-instrument observations have the
potential to reveal highly energetic physical processes on the Sun
reaching from the photosphere, over the chromosphere and the
transition region, to the corona and beyond. Solar physicists have
nowadays access to a suite of new ground-based observing facilities
including, for example, the 1.5-meter GREGOR solar telescope at the
Observatorio del Teide, Tenerife, Spain, the European Low Frequency
Array (LOFAR), the Atacama Large Millimeter/Submillimeter Array
(ALMA) in Chile, and the Coronal Multi-Channel Polarimeter for
Slovakia (COMP-S) at Lomnicky Peak Observatory. A powerful fleet of
space missions, for example, the Reuven Ramaty High Energy Solar
Spectroscopic Imager (RHESSI), the Japanese Hinode, and the Solar
Dynamics Observatory (SDO), adds more capabilities to investigate
magnetic fields, complex plasma flows, and accelerated particle,
and thermal properties of solar eruptive events. In the tradition
of the series of »Potsdam Thinkshops«, we
invite instrument specialists, observers, modellers, and theorists
to exchange ideas, to stimulate discussion, to initiate future
collaborations among participants, and to attract new users of
instruments by showcasing the capabilities. The aim is to make
progress towards a comprehensive description of solar eruptive
events effectively aggregating their global properties as well as
their highly dynamic fine structure. Thinkshop 12 takes place at
the science park »Albert Einstein«, home to
AIP's Great Refractor and the Solar Observatory Einstein Tower at
the Telegraphenberg.
Website:
https://thinkshop.aip.de/12/cms/
Start : 2015-10-26 - End : 2015-10-29
The IRIS-5 workshop will be conducted at the Inter-University
Centre for Astronomy and Astrophysics (IUCAA), Pune, India from
October 26-29, 2015. This workshop is mainly aimed at the
participants who could not attend IRIS-4, which is being held at
Boulder, USA. Therefore, set up of the IRIS-5 workshop would be
essentially be very similar to that of IRIS-4.
The main aim of the workshop is to introduce the Interface
Region Imaging Spectrometer (IRIS) to students and young post docs.
This would be done through tutorials on IRIS data analysis, physics
of optically thick radiative transfer, MHD simulations of the solar
atmosphere related to IRIS and hydrodynamic simulations of flares.
There will be lectures as well as hands on sessions.
Website:
http://www.iucaa.ernet.in/~solar/Welcome.html
Start : 2015-11-09 - End : 2015-11-11
The fundamentally most important source of inner heliospheric
plasma physics and space weather is the active Sun, its solar
active region eruptions. Prediction of the evolution and influence
of solar active regions on solar storms in the near-Earth
environment is of particular interest to several forecasting
institutions, industrial stakeholders, and the public in
general.
State-of-the-art solar storm prediction tools are limited to
monitoring solar active regions, registering eruptions and mass
ejections while attempting, then, at extrapolating subsequent
evolution and spatio-temporal propagation: no realistic
physics-based and data-driven synthesis tool exists, which is
capable of predicting when a solar flare will be triggered, or when
a Coronal Mass Ejection will be launched into inter-planetary
space. In short, we are not yet able to answer the question: When
and why do solar storms launch?
Our meeting will be focused around initiation of space weather
events at the Sun. We will discuss and develop three major
challenges, and we aim to develop a draft resolution road-map for
those challenges during the meeting.
Website:
https://indico.nbi.ku.dk/conferenceDisplay.py?confId=817
Start : 2015-11-13 - End : 2015-11-13
With the launch of NASA's Solar Dynamics Observatory (SDO)
mission on 02/11/2010, researchers in solar physics have entered
the era of Big Data. The Atmospheric Imaging Assembly (AIA)
instrument on SDO provides imaging data and the Helioseismic and
Magnetic Imager (HMI) instrument on SDO provides magnetic field
data. Both instruments record data at a high spatial resolution and
a time cadence, amounting to about 1 Petabyte of scientific data
each year. The Big Data challenges in Solar Astronomy are expected
to grow even further with the inauguration of the NSF funded Daniel
K. Inouye Solar Telescope (DKIST), currently under construction in
Hawaii. This telescope is expected to generate: 3-5 Petabytes of
data per year.
Start : 2016-06-27 - End : 2016-07-01
Website:
http://www.issibern.ch/program/workshops.html