
The Solar-Terrestrial Centre of Excellence (STCE) is a collaborative network of the Belgian Institute for Space Aeronomy, the Royal Observatory of Belgium and the Royal Meteorological Institute of Belgium.
|
Published by the STCE - this issue : 9 Oct 2015. The Solar-Terrestrial Centre of Excellence (STCE) is a collaborative network of the Belgian Institute for Space Aeronomy, the Royal Observatory of Belgium and the Royal Meteorological Institute of Belgium. |
| Archive of the newsletters | Subscribe to this newsletter by mail |
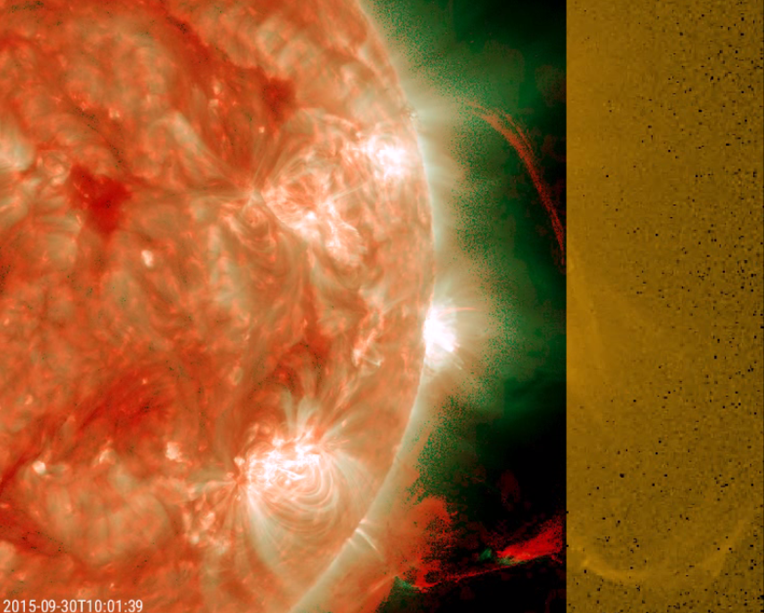
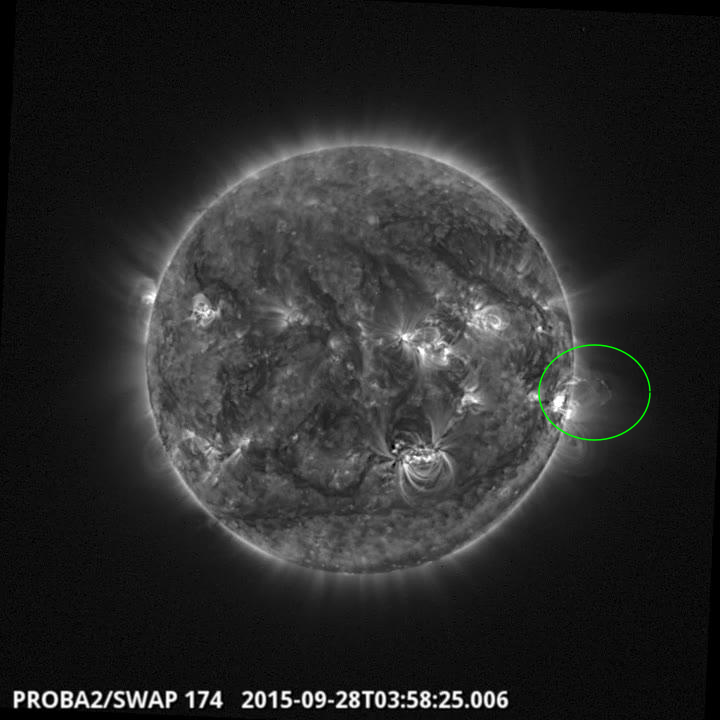
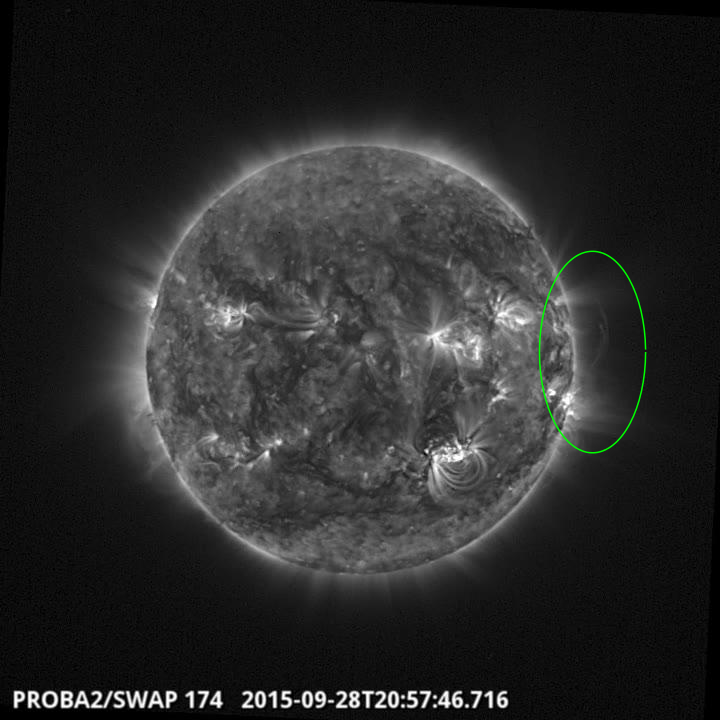
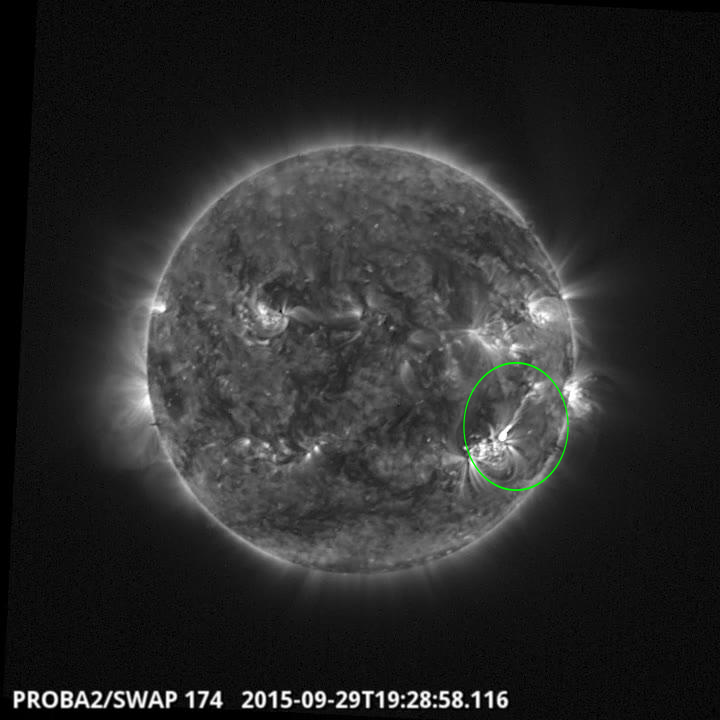
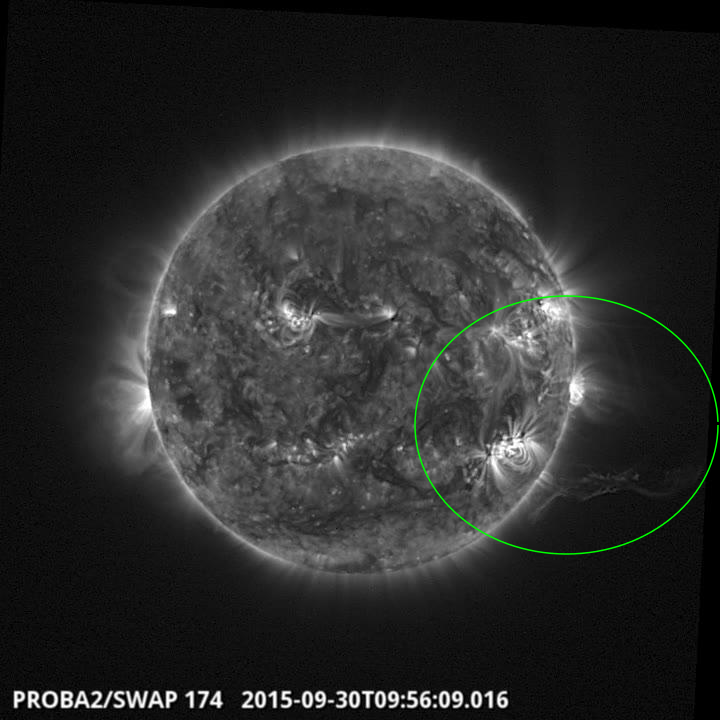
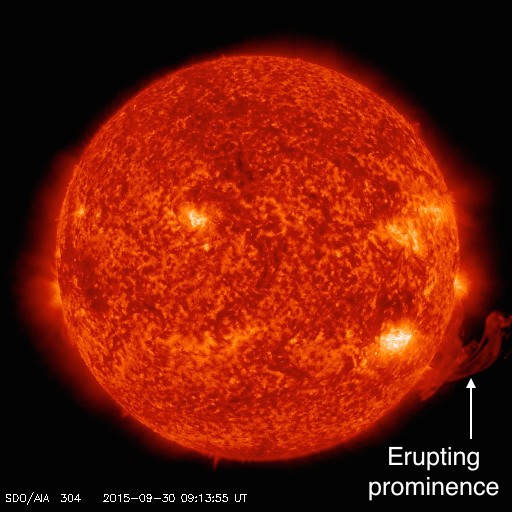
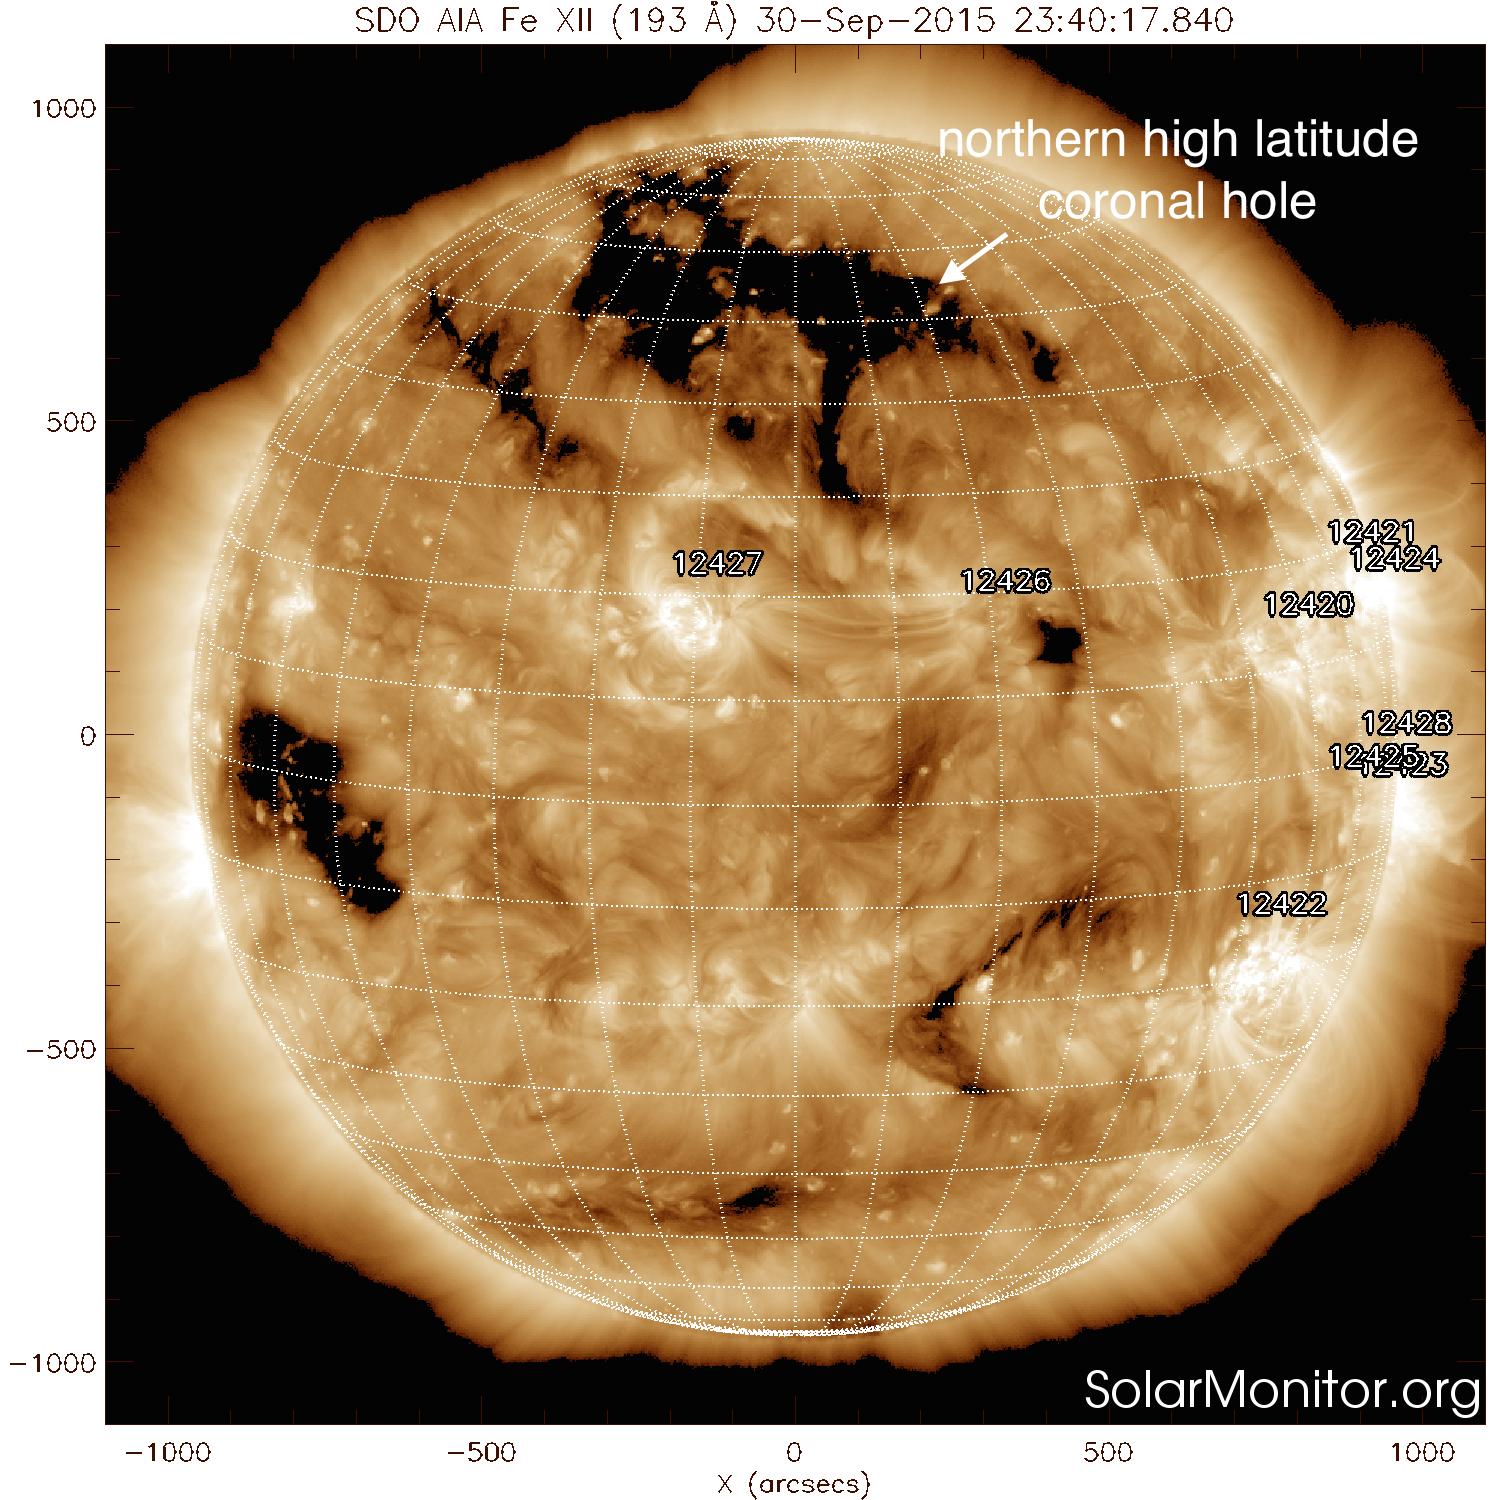
On 30 September, a prominence near the southwest solar limb got ejected into space. Prominences are clouds of plasma (charged particles) which are suspended in the corona, squeezed between large magnetic fields of opposite polarity, but denser and cooler than the surrounding coronal plasma. The structure had been visible during the last 2 weeks, before the surrounding magnetic field became unstable and ejected it into space starting around 07:30UT.
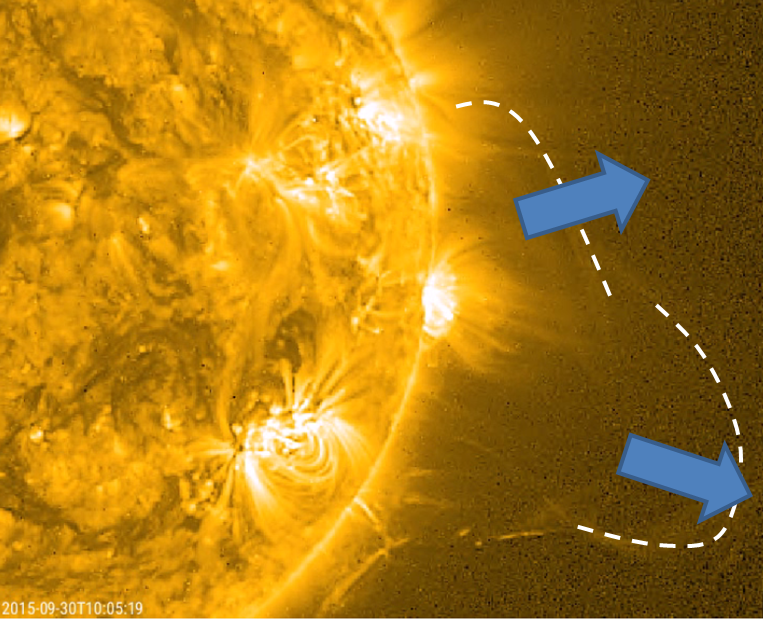
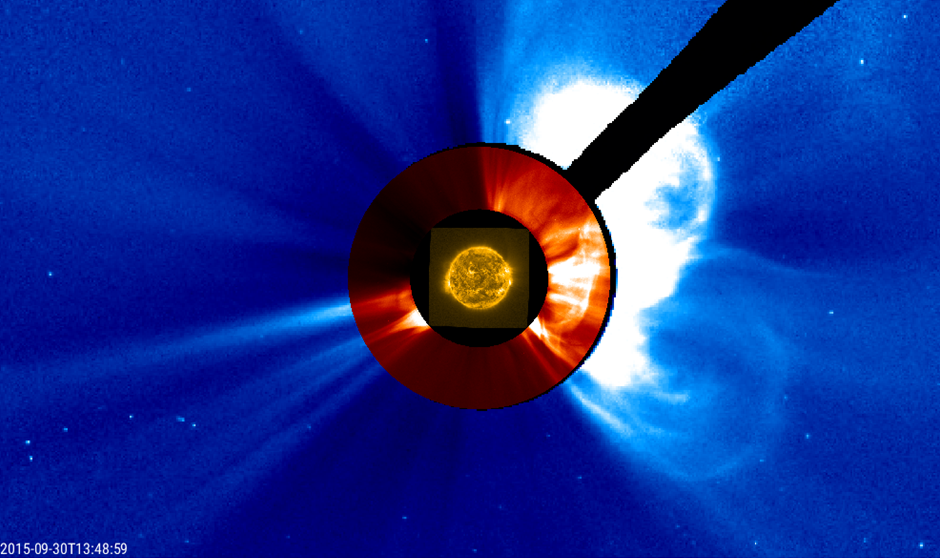
As can be seen in the widefield PROBA2/SWAP image above, the escaping material seems to have triggered more reconnections in the corona, with material raining down near the northwest solar limb. Hence, the first coronal mass ejection (CME) is quickly followed by another CME this time directed to the northwest. CACTus (http://www.sidc.oma.be/cactus/) combined the two CMEs seen in SOHO's coronagraphs (image below) into one 150-degrees-wide partial halo CME, but they can clearly be distinguished from each other, both in direction and timing. The first CME became visible at 09:24UT and was headed in the southwest direction, the second CME became visible around 10:36UT and was headed to the northwest. Both CMEs were slow, with a speed of around 330 km/s, and they were not directed to Earth.
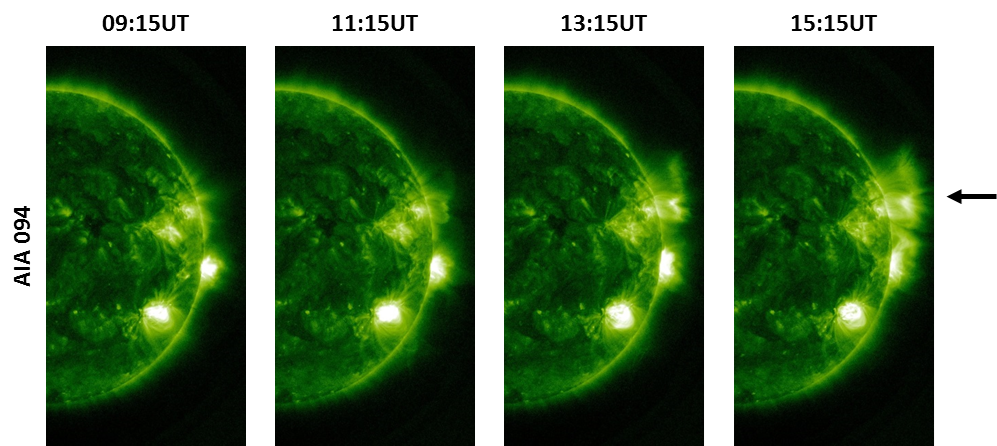
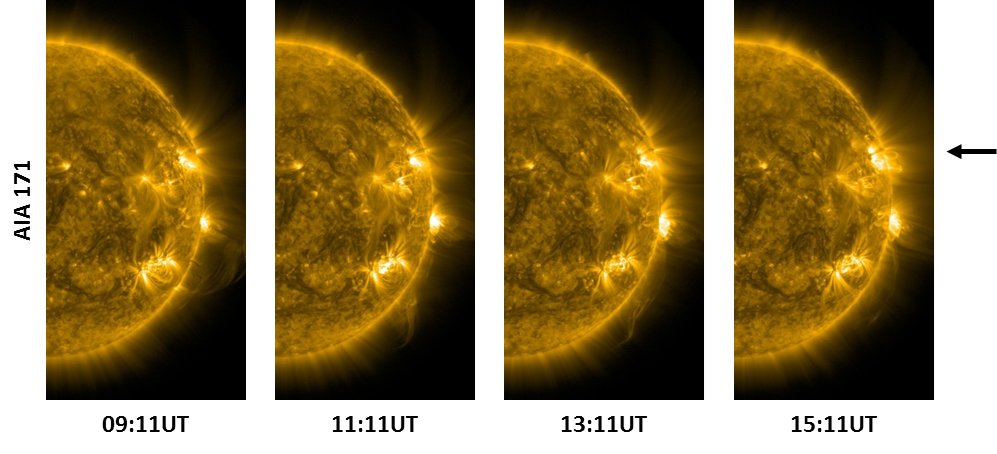
The most impressive features were observed in the aftermath of the eruption. Indeed, over the northwestern footpoint one can see supra-arcade downflows, i.e. sunward moving voids often seen above developing post-eruption coronal loops. The downflows became visible in SDO's AIA 094 filter starting around 12:00UT. This filter shows the corona at temperatures of several million degrees, and the features are not visible in lower temperature filters such as SDO/AIA 171 (700.000 degrees) or PROBA2/SWAP (about 1 million degrees). The appearance of these structures add to the complexity of the eruption as a whole.
The movie at https://youtu.be/QexI-qEqsL0 first shows the eruption in extreme ultraviolet (resp. first a combo from AIA193/304 and SWAP; then purely SWAP), followed by two clips combining the PROBA2/SWAP images with coronagraphic imagery from SOHO/LASCO, finally ending with AIA094 (full disk) and a AIA094/171 combo (zoom) of the supra-arcade downflows.
Credits - Data and imagery for the movie clips were taken from SDO/AIA (http://sdo.gsfc.nasa.gov/data/aiahmi/), PROBA2/SWAP (http://proba2.oma.be/ssa), SOHO/LASCO (http://sohowww.nascom.nasa.gov/home.html), and (J)Helioviewer (http://helioviewer.org/).
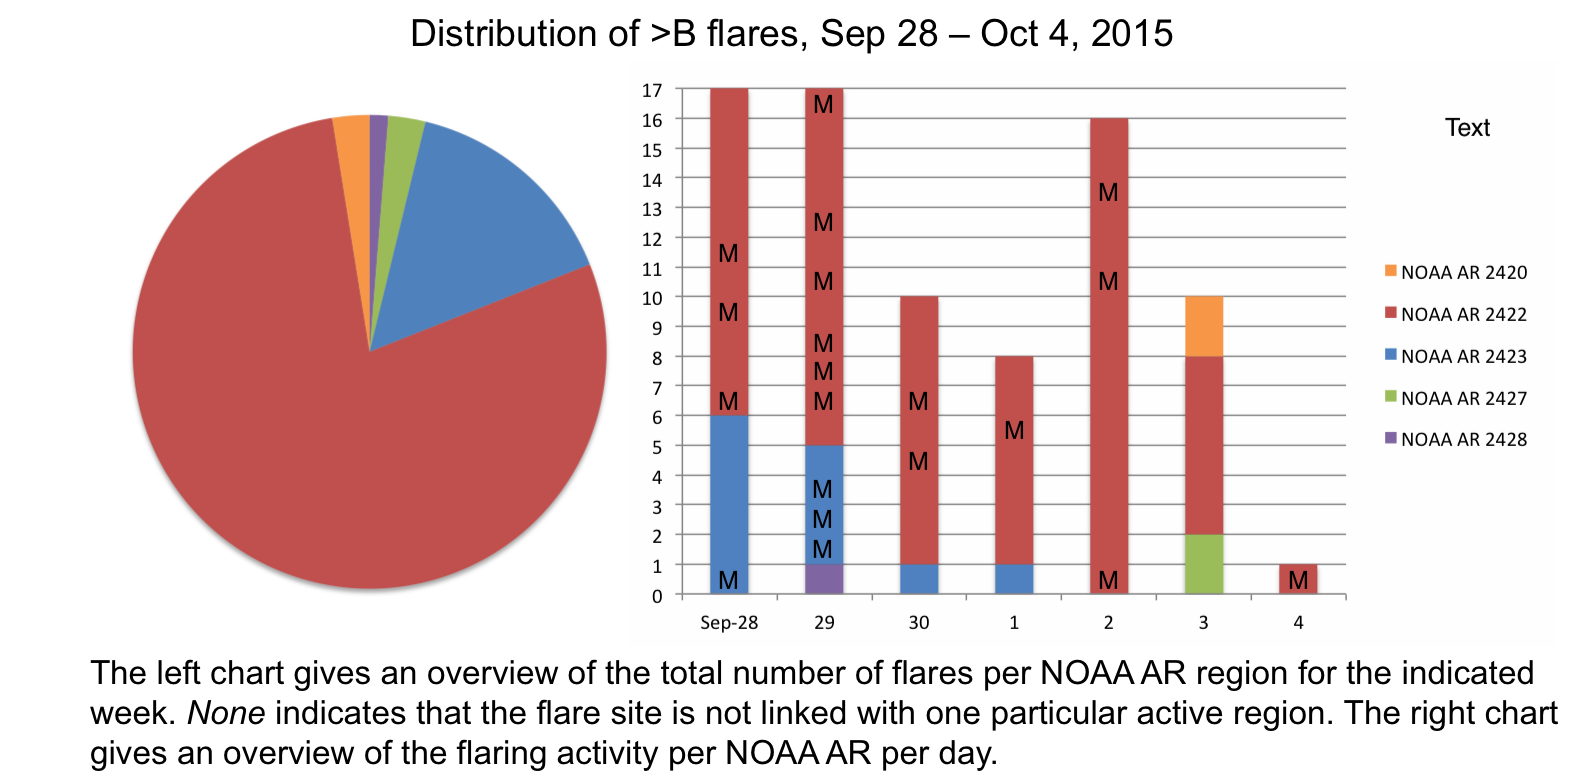
Solar flare activity fluctuated between low and moderate during the week.
In order to view the activity of this week in more detail, we suggest to go to the following website from which all the daily (normal and difference) movies can be accessed:
http://proba2.oma.be/ssa
This page also lists the recorded flaring events.
A weekly overview movie can be found here (SWAP week 288).
http://proba2.oma.be/swap/data/mpg/movies/weekly_movies/weekly_movie_2015_09_28.mp4
Details about some of this week’s events, can be found further below.
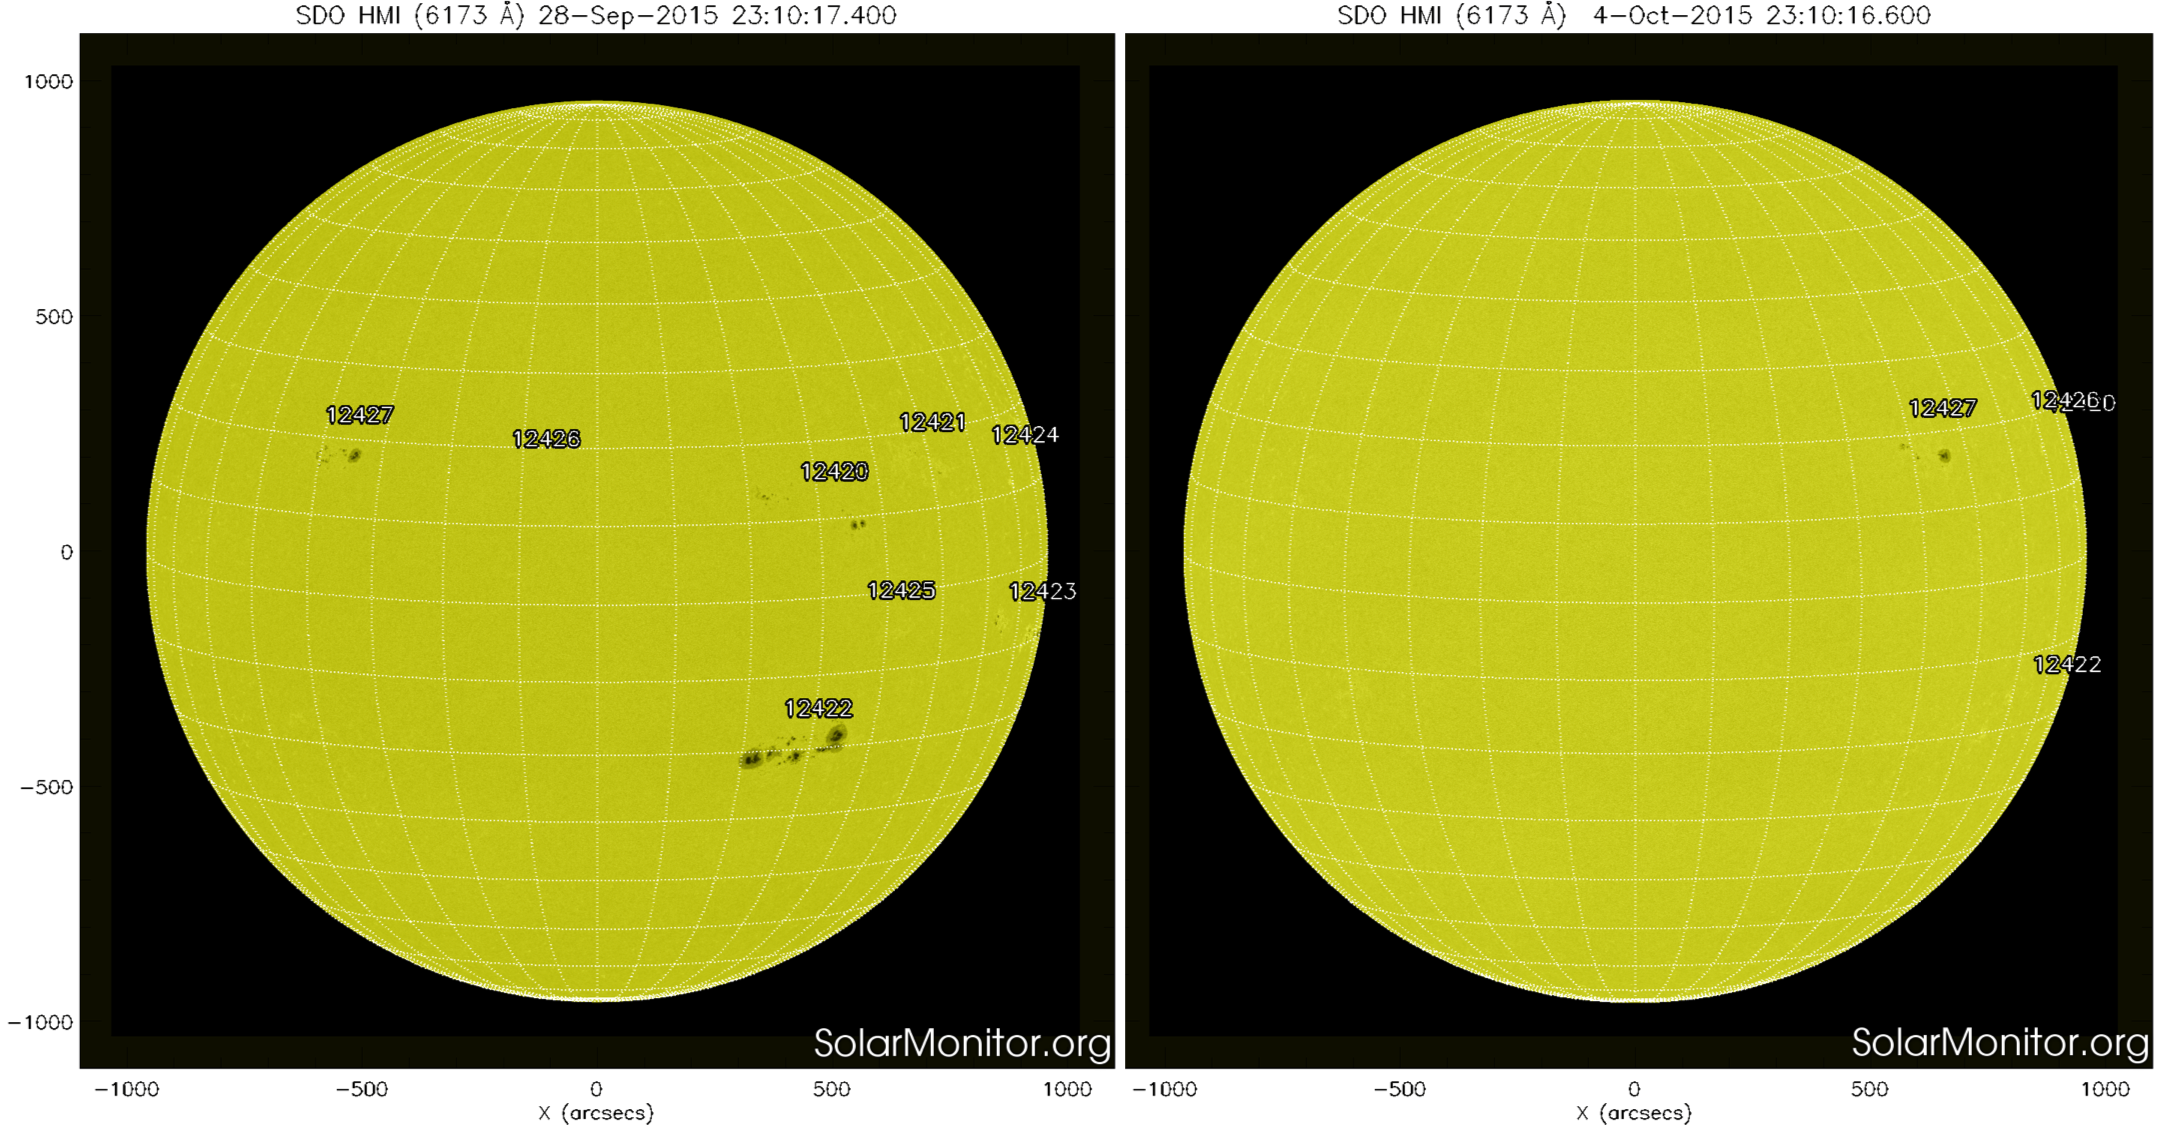
The initial erupting prominence from the limb was apparently linked to a second prominence near AR
12422, which itself subsequently erupted at the end of the day.
| DAY | BEGIN | MAX | END | LOC | XRAY | OP | 10CM | TYPE | Cat | NOAA |
| 28 | 0345 | 0355 | 0359 | S9W67 | M3.6 | SF | V/2III/3 | 36 | 2423 | |
| 28 | 0727 | 0735 | 0746 | S22W20 | M1.1 | 1N | 39 | 2422 | ||
| 28 | 1301 | 1318 | 1329 | S22W24 | M1.1 | 1N | 39 | 2422 | ||
| 28 | 1453 | 1458 | 1503 | M7.6 | 100 | 39 | 2422 | |||
| 29 | 0311 | 0316 | 0331 | S8W78 | M1.2 | SF | 36 | 2423 | ||
| 29 | 0341 | 0343 | 0353 | S20W36 | M1.1 | SF | 39 | 2422 | ||
| 29 | 0505 | 0516 | 0523 | S21W37 | M2.9 | SF | 39 | 2422 | ||
| 29 | 0533 | 0537 | 0539 | S9W82 | M1.2 | SF | 36 | 2423 | ||
| 29 | 0553 | 0556 | 0604 | M1.0 | 39 | 2422 | ||||
| 29 | 0639 | 0643 | 0646 | S20W34 | M1.4 | 1N | 39 | 2422 | ||
| 29 | 0846 | 0851 | 0855 | S10W77 | M1.3 | 1N | 36 | 2423 | ||
| 29 | 1109 | 1115 | 1120 | S21W37 | M1.6 | 1B | 39 | 2422 | ||
| 29 | 1920 | 1924 | 1927 | S20W36 | M1.1 | 1B | III/2 | 39 | 2422 | |
| 30 | 1049 | 1059 | 1113 | S22W46 | M1.3 | 1N | CTM/1 | 2422 | ||
| 30 | 1318 | 1320 | 1321 | S23W59 | M1.1 | 1N | 2422 | |||
| 01 | 1303 | 1310 | 1314 | S23W64 | M4.5 | SN | 2422 | |||
| 02 | 0006 | 0013 | 0017 | S19W67 | M5.5 | 1N | III/1 | 2422 | ||
| 02 | 1219 | 1226 | 1231 | M1.0 | 2422 | |||||
| 02 | 1708 | 1718 | 1723 | S19W76 | M1.0 | SF | 2422 | |||
| 04 | 0234 | 0241 | 0248 | M1.0 | 2422 |
| LOC: approximate heliographic location | TYPE: radio burst type |
| XRAY: X-ray flare class | Cat: Catania sunspot group number |
| OP: optical flare class | NOAA: NOAA active region number |
| 10CM: peak 10 cm radio flux |
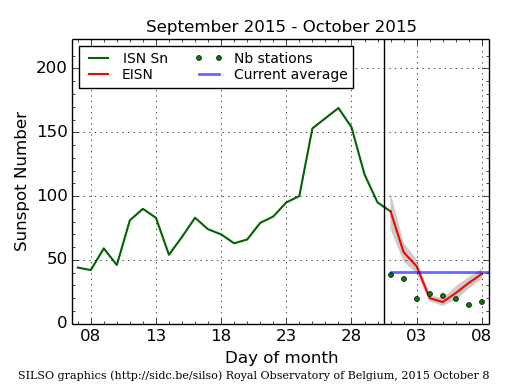
The daily Estimated International Sunspot Number (EISN, red curve with shaded error) derived by a simplified method from real-time data from the worldwide SILSO network. It extends the official Sunspot Number from the full processing of the preceding month (green line). The plot shows the last 30 days (~ one solar rotation). The horizontal blue line shows the current monthly average, while the green dots give the number of stations included in the calculation of the EISN for each day.
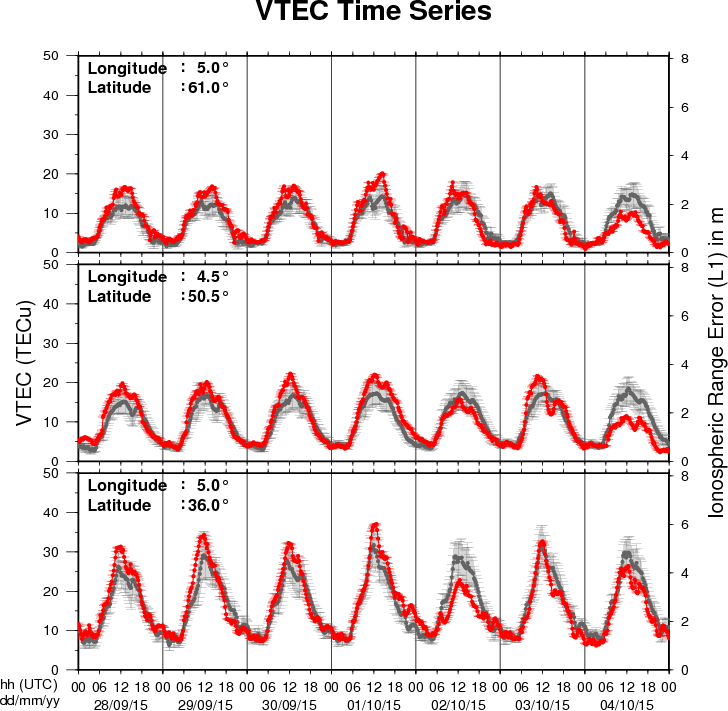
The figure shows the time evolution of the Vertical Total Electron Content (VTEC) (in red) during the last week at three locations:
a) in the northern part of Europe(N61°, 5°E)
b) above Brussels(N50.5°, 4.5°E)
c) in the southern part of Europe(N36°, 5°E)
This figure also shows (in grey) the normal ionospheric behaviour expected based on the median VTEC from the 15 previous days.
The VTEC is expressed in TECu (with TECu=10^16 electrons per square meter) and is directly related to the signal propagation delay due to the ionosphere (in figure: delay on GPS L1 frequency).
The Sun's radiation ionizes the Earth's upper atmosphere, the ionosphere, located from about 60km to 1000km above the Earth's surface.The ionization process in the ionosphere produces ions and free electrons. These electrons perturb the propagation of the GNSS (Global Navigation Satellite System) signals by inducing a so-called ionospheric delay.
See http://stce.be/newsletter/GNSS_final.pdf for some more explanations ; for detailed information, see http://gnss.be/ionosphere_tutorial.php
Start : 2015-10-26 - End : 2015-10-29
Erupting prominences/filaments, surges, flares, and coronal mass
ejections (CMEs) are prominent examples of the dynamic Sun.
Multi-wavelength and multi-instrument observations have the
potential to reveal highly energetic physical processes on the Sun
reaching from the photosphere, over the chromosphere and the
transition region, to the corona and beyond. Solar physicists have
nowadays access to a suite of new ground-based observing facilities
including, for example, the 1.5-meter GREGOR solar telescope at the
Observatorio del Teide, Tenerife, Spain, the European Low Frequency
Array (LOFAR), the Atacama Large Millimeter/Submillimeter Array
(ALMA) in Chile, and the Coronal Multi-Channel Polarimeter for
Slovakia (COMP-S) at Lomnicky Peak Observatory. A powerful fleet of
space missions, for example, the Reuven Ramaty High Energy Solar
Spectroscopic Imager (RHESSI), the Japanese Hinode, and the Solar
Dynamics Observatory (SDO), adds more capabilities to investigate
magnetic fields, complex plasma flows, and accelerated particle,
and thermal properties of solar eruptive events. In the tradition
of the series of »Potsdam Thinkshops«, we
invite instrument specialists, observers, modellers, and theorists
to exchange ideas, to stimulate discussion, to initiate future
collaborations among participants, and to attract new users of
instruments by showcasing the capabilities. The aim is to make
progress towards a comprehensive description of solar eruptive
events effectively aggregating their global properties as well as
their highly dynamic fine structure. Thinkshop 12 takes place at
the science park »Albert Einstein«, home to
AIP's Great Refractor and the Solar Observatory Einstein Tower at
the Telegraphenberg.
Website:
https://thinkshop.aip.de/12/cms/
Start : 2015-10-26 - End : 2015-10-29
The IRIS-5 workshop will be conducted at the Inter-University
Centre for Astronomy and Astrophysics (IUCAA), Pune, India from
October 26-29, 2015. This workshop is mainly aimed at the
participants who could not attend IRIS-4, which is being held at
Boulder, USA. Therefore, set up of the IRIS-5 workshop would be
essentially be very similar to that of IRIS-4.
The main aim of the workshop is to introduce the Interface
Region Imaging Spectrometer (IRIS) to students and young post docs.
This would be done through tutorials on IRIS data analysis, physics
of optically thick radiative transfer, MHD simulations of the solar
atmosphere related to IRIS and hydrodynamic simulations of flares.
There will be lectures as well as hands on sessions.
Website:
http://www.iucaa.ernet.in/~solar/Welcome.html
Start : 2015-11-09 - End : 2015-11-11
The fundamentally most important source of inner heliospheric
plasma physics and space weather is the active Sun, its solar
active region eruptions. Prediction of the evolution and influence
of solar active regions on solar storms in the near-Earth
environment is of particular interest to several forecasting
institutions, industrial stakeholders, and the public in
general.
State-of-the-art solar storm prediction tools are limited to
monitoring solar active regions, registering eruptions and mass
ejections while attempting, then, at extrapolating subsequent
evolution and spatio-temporal propagation: no realistic
physics-based and data-driven synthesis tool exists, which is
capable of predicting when a solar flare will be triggered, or when
a Coronal Mass Ejection will be launched into inter-planetary
space. In short, we are not yet able to answer the question: When
and why do solar storms launch?
Our meeting will be focused around initiation of space weather
events at the Sun. We will discuss and develop three major
challenges, and we aim to develop a draft resolution road-map for
those challenges during the meeting.
Website:
https://indico.nbi.ku.dk/conferenceDisplay.py?confId=817
Start : 2015-11-13 - End : 2015-11-13
With the launch of NASA's Solar Dynamics Observatory (SDO)
mission on 02/11/2010, researchers in solar physics have entered
the era of Big Data. The Atmospheric Imaging Assembly (AIA)
instrument on SDO provides imaging data and the Helioseismic and
Magnetic Imager (HMI) instrument on SDO provides magnetic field
data. Both instruments record data at a high spatial resolution and
a time cadence, amounting to about 1 Petabyte of scientific data
each year. The Big Data challenges in Solar Astronomy are expected
to grow even further with the inauguration of the NSF funded Daniel
K. Inouye Solar Telescope (DKIST), currently under construction in
Hawaii. This telescope is expected to generate: 3-5 Petabytes of
data per year.
Start : 2016-06-27 - End : 2016-07-01
Website:
http://www.issibern.ch/program/workshops.html