
The Solar-Terrestrial Centre of Excellence (STCE) is a collaborative network of the Belgian Institute for Space Aeronomy, the Royal Observatory of Belgium and the Royal Meteorological Institute of Belgium.
|
Published by the STCE - this issue : 16 Oct 2015. The Solar-Terrestrial Centre of Excellence (STCE) is a collaborative network of the Belgian Institute for Space Aeronomy, the Royal Observatory of Belgium and the Royal Meteorological Institute of Belgium. |
| Archive of the newsletters | Subscribe to this newsletter by mail |
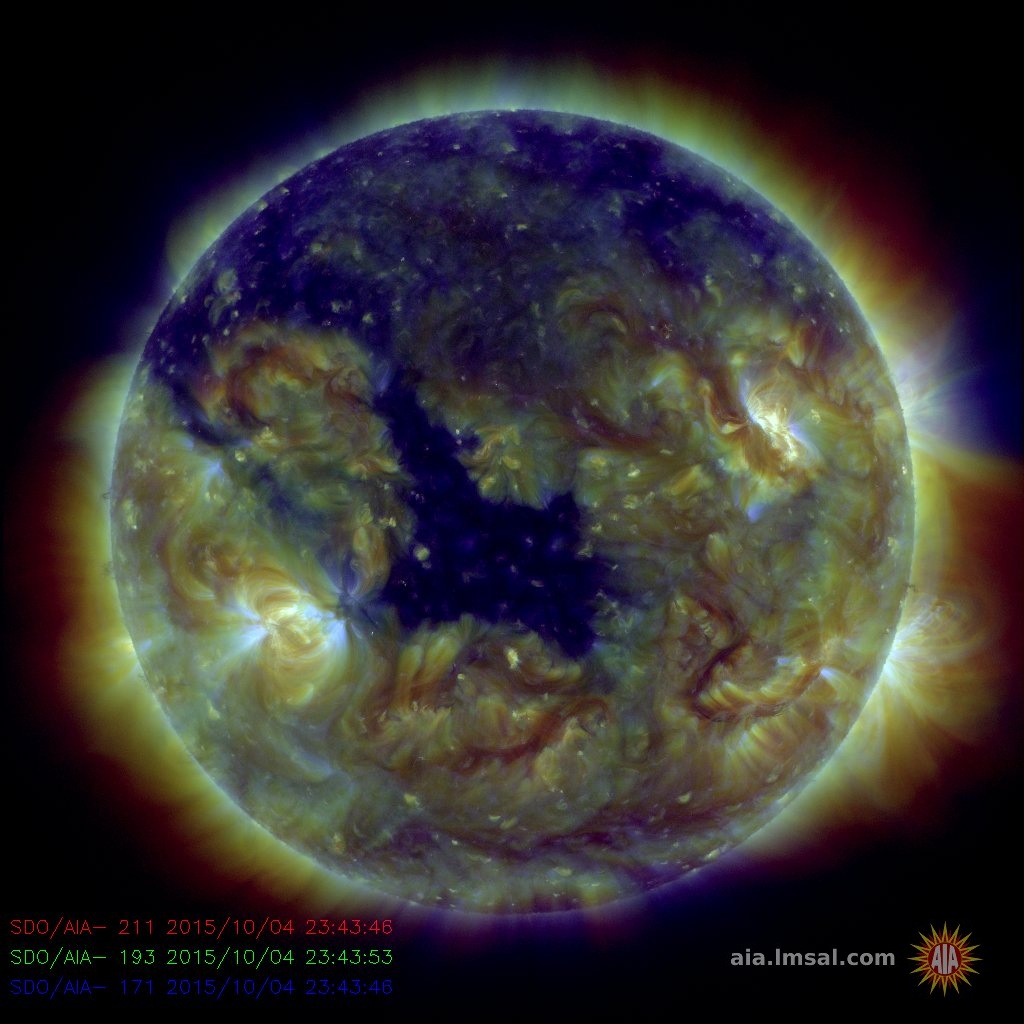
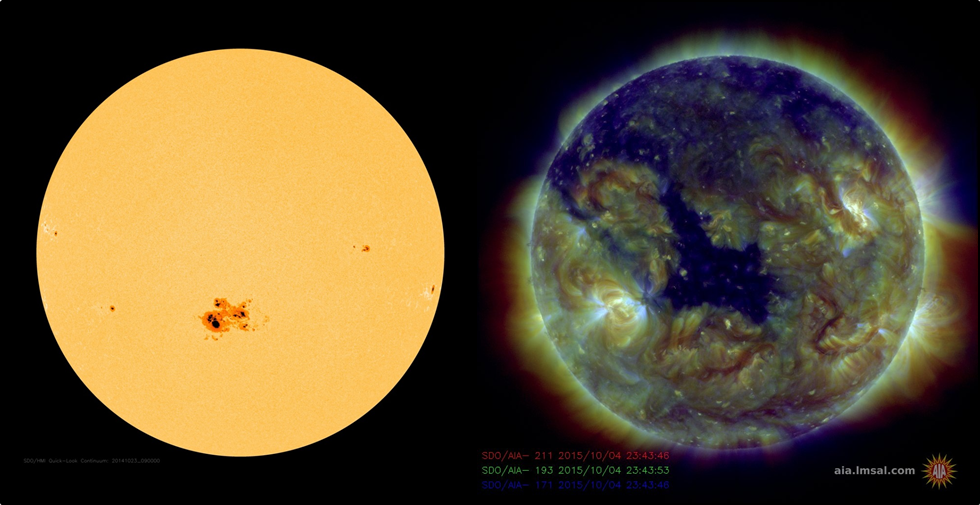
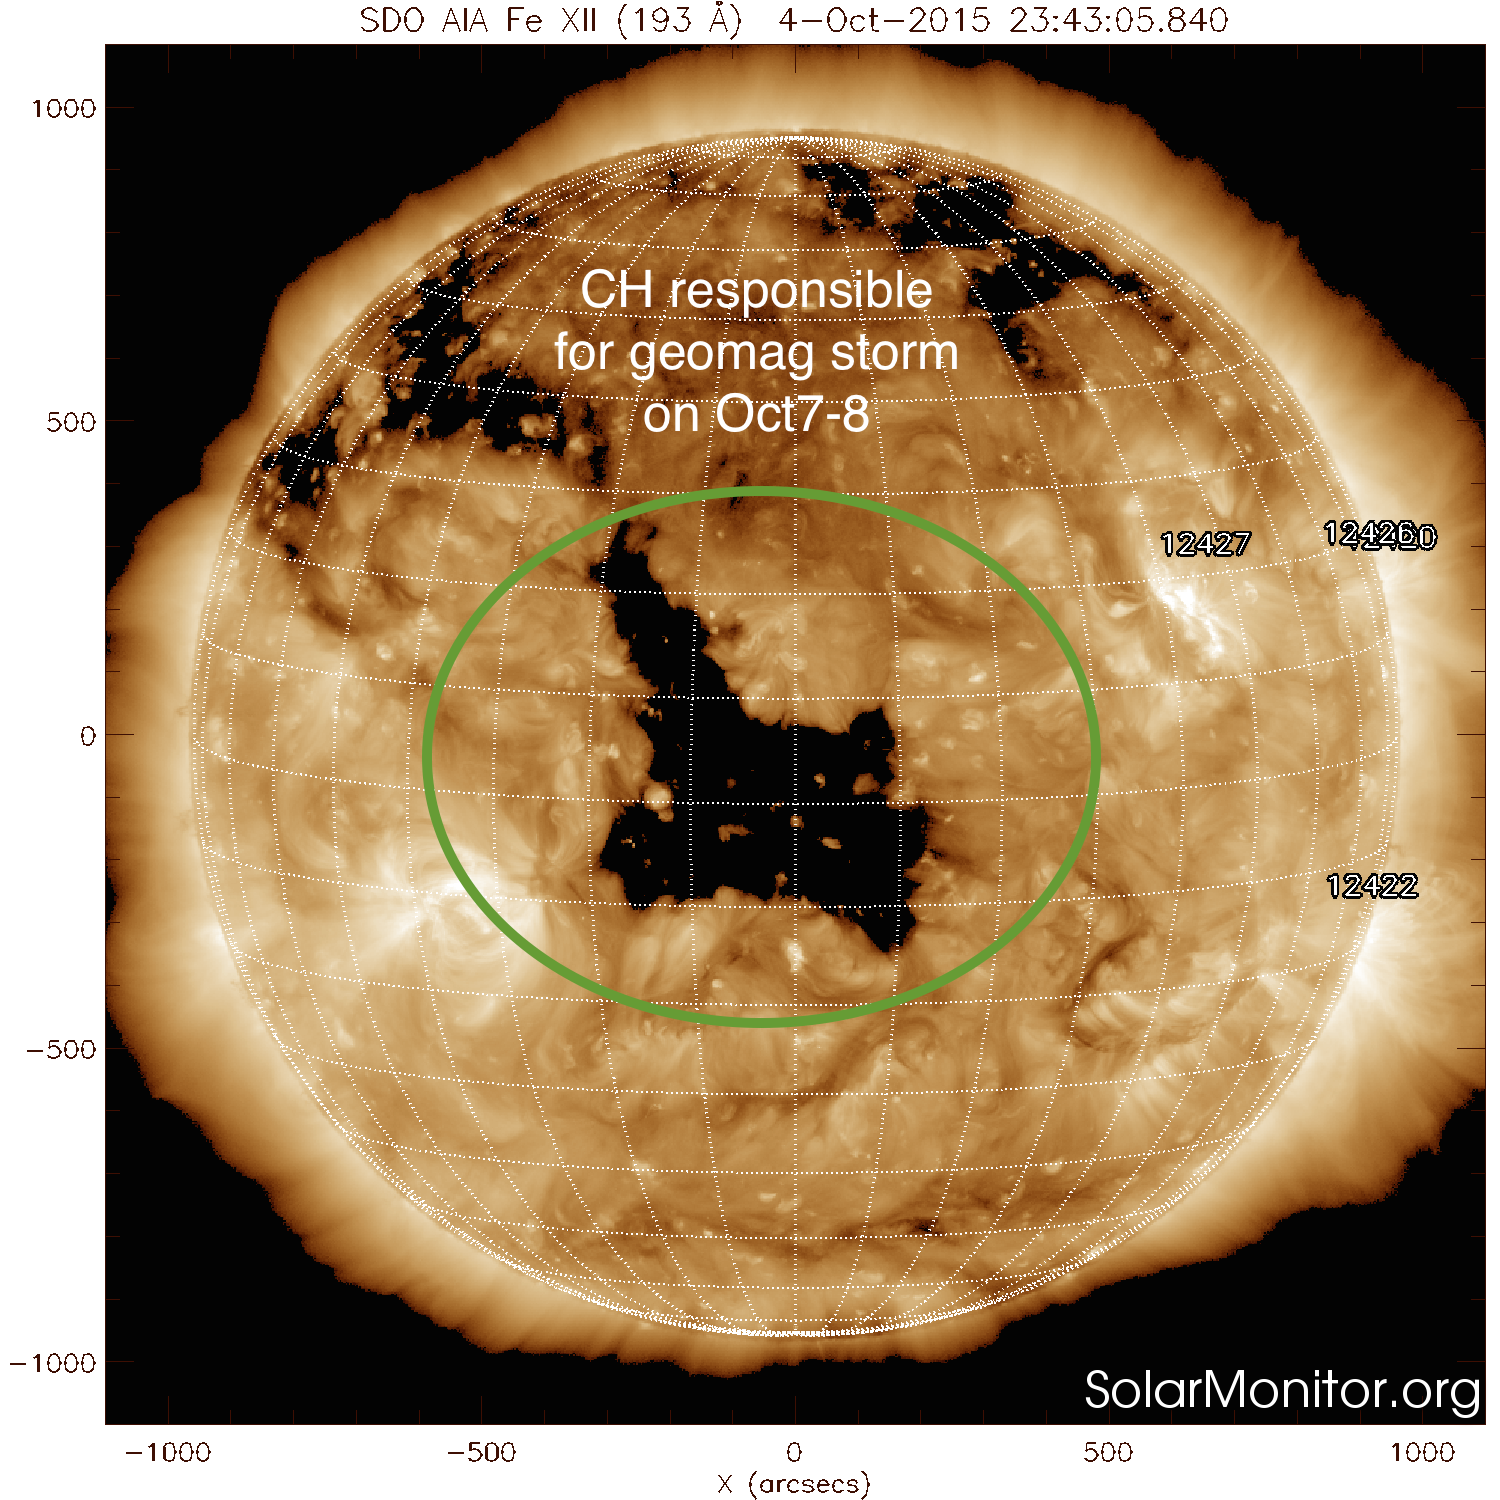
On 04 October, a rather large trans-equatorial coronal hole (CH) transited the Sun's central meridian. According to LMSAL data (http://sdowww.lmsal.com/suntoday/# ), it had a surface area of nearly 150 times that of the Earth. For comparison: NOAA 2192, the largest sunspot group so far this solar cycle, was about 9 times smaller!
Already three days later, around noon on 07 October, the high speed stream of this CH arrived at Earth. The solar wind speed gradually increased to a swift 800 km/s, and values greater than 600 km/s were recorded for nearly 3 days. The graph below (courtesy from ACE Science Center at http://www.srl.caltech.edu/ACE/ASC/ ) shows the evolution of the wind speed from 6 till 10 October 2015 (day-of-year 279 till 283). The maximum (5-minutes average) speed was 817 km/s on 08 October at 08:20UT. ACE, the Advanced Composition Explorer satellite, was launched on 25 August 1997 and is providing measurements of the solar wind from the L1 Lagrange point (https://en.wikipedia.org/wiki/Lagrangian_point ) already for 18 years.
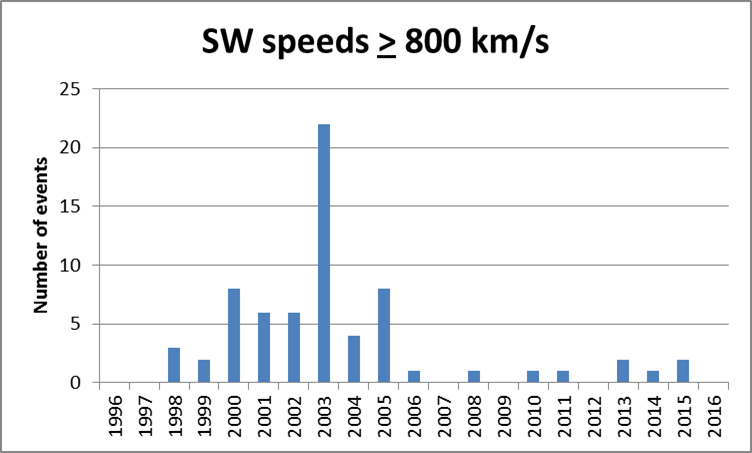
It is quite rare that solar wind speeds near the Earth reach 800 km/s or more. A quick analysis of the quick-look data at ASC (http://www.srl.caltech.edu/ACE/ASC/browse/view_browse_data.html ) is quite revealing in this respect. As it turns out, this was only the 2nd time this year that solar wind speeds reached these high values, and only the 7th time so far this solar cycle. Rare indeed! The highest solar wind speed recorded at Earth so far this solar cycle was on 13 January 2014 when a value of 907 km/s was recorded. Since the start of the ACE measurements, 2003 stands out both in number as in top speeds with resp. more than 20 events and more than 1100 km/s. The latter was related to the Halloween events.
What are the chances for flares? - Will my solar panels of my satellite in a geostationairy orbit be damaged? - Should I ware my proton-proof jacket? You can make jokes, but Space Weather is indeed serious business impacting our daily lives.
Live at ESWW12!
Check http://www.stce.be/esww12/liveforecast.php
Solar flare activity fluctuated between low and quiet during the week.
In order to view the activity of this week in more detail, we suggest to go to the following website from which all the daily (normal and difference) movies can be accessed: http://proba2.oma.be/ssa
This page also lists the recorded flaring events.
A weekly overview movie can be found here: http://proba2.sidc.be/swap/data/mpg/movies/weekly_movies/weekly_movie_2015_10_05.mp4 (SWAP week 289).
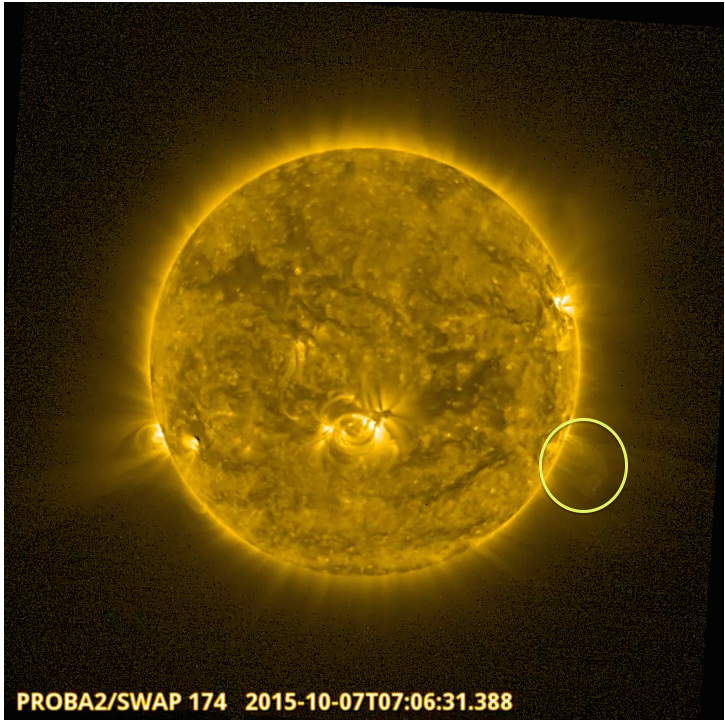
Solar activity was low this week, only one C-class flare occurred (on 2015-Oct-11 around 22:27 UT, on the East limb). SWAP also observed an eruption on the West limb on 2015-Oct-07 around 07:06 UT, see the annotated SWAP image below. A movie of the event can be found here: http://proba2.sidc.be/swap/data/mpg/movies/20151007_swap_movie.mp4 (SWAP daily movie).
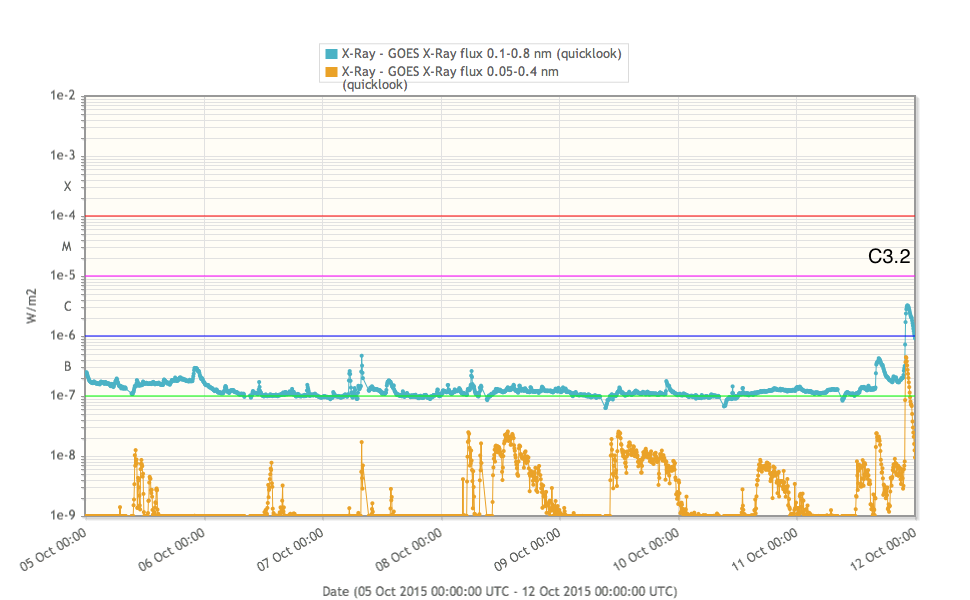
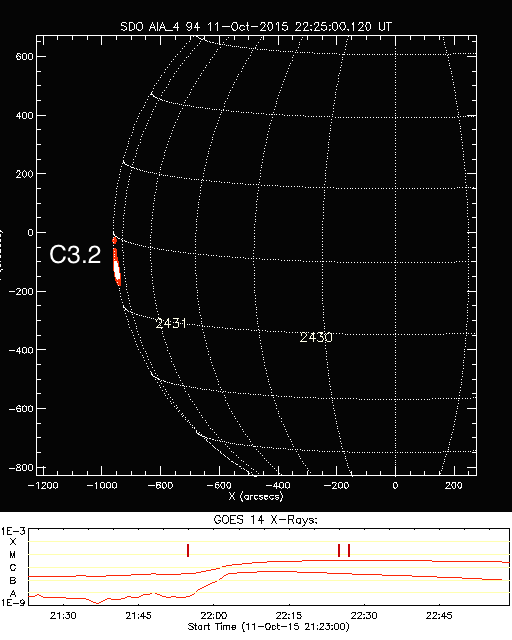
Solar activity was very low during the week. Only one C-class flare - C3.2, peaking at 22:29 UT on October 11 from a source behind the east limb.
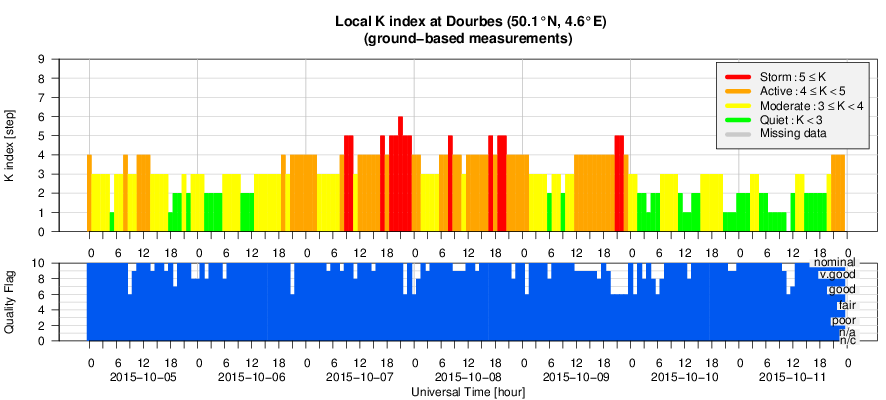
The Earth was under the influence of a fast speed solar wind stream emanating from an equatorial coronal hole (CH), from October 7 to October 10. It created major storm conditions at Dourbes (k reaching 6) and severe storm conditions at planetary levels (Kp = 7), on October 7 and 8. It decreased to active levels on October 9 (with isolated minor storm periods at Dourbes).
See 'A swiftly blowing wind'.
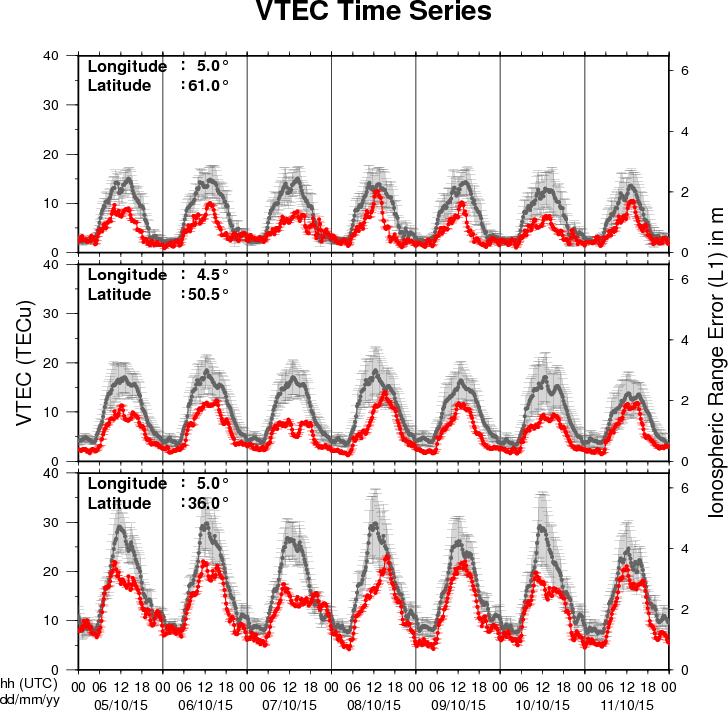
The figure shows the time evolution of the Vertical Total Electron Content (VTEC) (in red) during the last week at three locations:
a) in the northern part of Europe(N61°, 5°E)
b) above Brussels(N50.5°, 4.5°E)
c) in the southern part of Europe(N36°, 5°E)
This figure also shows (in grey) the normal ionospheric behaviour expected based on the median VTEC from the 15 previous days.
The VTEC is expressed in TECu (with TECu=10^16 electrons per square meter) and is directly related to the signal propagation delay due to the ionosphere (in figure: delay on GPS L1 frequency).
The Sun's radiation ionizes the Earth's upper atmosphere, the ionosphere, located from about 60km to 1000km above the Earth's surface.The ionization process in the ionosphere produces ions and free electrons. These electrons perturb the propagation of the GNSS (Global Navigation Satellite System) signals by inducing a so-called ionospheric delay.
See http://stce.be/newsletter/GNSS_final.pdf for some more explanations ; for detailed information, see http://gnss.be/ionosphere_tutorial.php
Start : 2015-10-26 - End : 2015-10-29
Erupting prominences/filaments, surges, flares, and coronal mass
ejections (CMEs) are prominent examples of the dynamic Sun.
Multi-wavelength and multi-instrument observations have the
potential to reveal highly energetic physical processes on the Sun
reaching from the photosphere, over the chromosphere and the
transition region, to the corona and beyond. Solar physicists have
nowadays access to a suite of new ground-based observing facilities
including, for example, the 1.5-meter GREGOR solar telescope at the
Observatorio del Teide, Tenerife, Spain, the European Low Frequency
Array (LOFAR), the Atacama Large Millimeter/Submillimeter Array
(ALMA) in Chile, and the Coronal Multi-Channel Polarimeter for
Slovakia (COMP-S) at Lomnicky Peak Observatory. A powerful fleet of
space missions, for example, the Reuven Ramaty High Energy Solar
Spectroscopic Imager (RHESSI), the Japanese Hinode, and the Solar
Dynamics Observatory (SDO), adds more capabilities to investigate
magnetic fields, complex plasma flows, and accelerated particle,
and thermal properties of solar eruptive events. In the tradition
of the series of »Potsdam Thinkshops«, we
invite instrument specialists, observers, modellers, and theorists
to exchange ideas, to stimulate discussion, to initiate future
collaborations among participants, and to attract new users of
instruments by showcasing the capabilities. The aim is to make
progress towards a comprehensive description of solar eruptive
events effectively aggregating their global properties as well as
their highly dynamic fine structure. Thinkshop 12 takes place at
the science park »Albert Einstein«, home to
AIP's Great Refractor and the Solar Observatory Einstein Tower at
the Telegraphenberg.
Website:
https://thinkshop.aip.de/12/cms/
Start : 2015-10-26 - End : 2015-10-29
The IRIS-5 workshop will be conducted at the Inter-University
Centre for Astronomy and Astrophysics (IUCAA), Pune, India from
October 26-29, 2015. This workshop is mainly aimed at the
participants who could not attend IRIS-4, which is being held at
Boulder, USA. Therefore, set up of the IRIS-5 workshop would be
essentially be very similar to that of IRIS-4.
The main aim of the workshop is to introduce the Interface
Region Imaging Spectrometer (IRIS) to students and young post docs.
This would be done through tutorials on IRIS data analysis, physics
of optically thick radiative transfer, MHD simulations of the solar
atmosphere related to IRIS and hydrodynamic simulations of flares.
There will be lectures as well as hands on sessions.
Website:
http://www.iucaa.ernet.in/~solar/Welcome.html
Start : 2015-11-09 - End : 2015-11-11
The fundamentally most important source of inner heliospheric
plasma physics and space weather is the active Sun, its solar
active region eruptions. Prediction of the evolution and influence
of solar active regions on solar storms in the near-Earth
environment is of particular interest to several forecasting
institutions, industrial stakeholders, and the public in
general.
State-of-the-art solar storm prediction tools are limited to
monitoring solar active regions, registering eruptions and mass
ejections while attempting, then, at extrapolating subsequent
evolution and spatio-temporal propagation: no realistic
physics-based and data-driven synthesis tool exists, which is
capable of predicting when a solar flare will be triggered, or when
a Coronal Mass Ejection will be launched into inter-planetary
space. In short, we are not yet able to answer the question: When
and why do solar storms launch?
Our meeting will be focused around initiation of space weather
events at the Sun. We will discuss and develop three major
challenges, and we aim to develop a draft resolution road-map for
those challenges during the meeting.
Website:
https://indico.nbi.ku.dk/conferenceDisplay.py?confId=817
Start : 2015-11-13 - End : 2015-11-13
With the launch of NASA's Solar Dynamics Observatory (SDO)
mission on 02/11/2010, researchers in solar physics have entered
the era of Big Data. The Atmospheric Imaging Assembly (AIA)
instrument on SDO provides imaging data and the Helioseismic and
Magnetic Imager (HMI) instrument on SDO provides magnetic field
data. Both instruments record data at a high spatial resolution and
a time cadence, amounting to about 1 Petabyte of scientific data
each year. The Big Data challenges in Solar Astronomy are expected
to grow even further with the inauguration of the NSF funded Daniel
K. Inouye Solar Telescope (DKIST), currently under construction in
Hawaii. This telescope is expected to generate: 3-5 Petabytes of
data per year.
Start : 2016-06-27 - End : 2016-07-01
Website:
http://www.issibern.ch/program/workshops.html