The Solar-Terrestrial Centre of Excellence (STCE) is a collaborative network of the Belgian Institute for Space Aeronomy, the Royal Observatory of Belgium and the Royal Meteorological Institute of Belgium.
|
Published by the STCE - this issue : 30 Oct 2015. The Solar-Terrestrial Centre of Excellence (STCE) is a collaborative network of the Belgian Institute for Space Aeronomy, the Royal Observatory of Belgium and the Royal Meteorological Institute of Belgium. |
| Archive of the newsletters | Subscribe to this newsletter by mail |
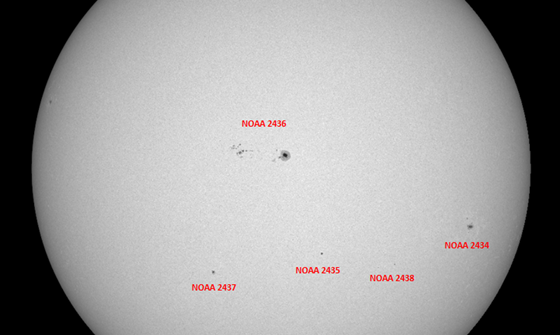
No, this news item is not going to make publicity for a social network!... Instead, it will simply take a closer look at some sunspot groups that at first sight seem to be clearly separated, but upon examination of their magnetic field configurations, are connected to each other after all.
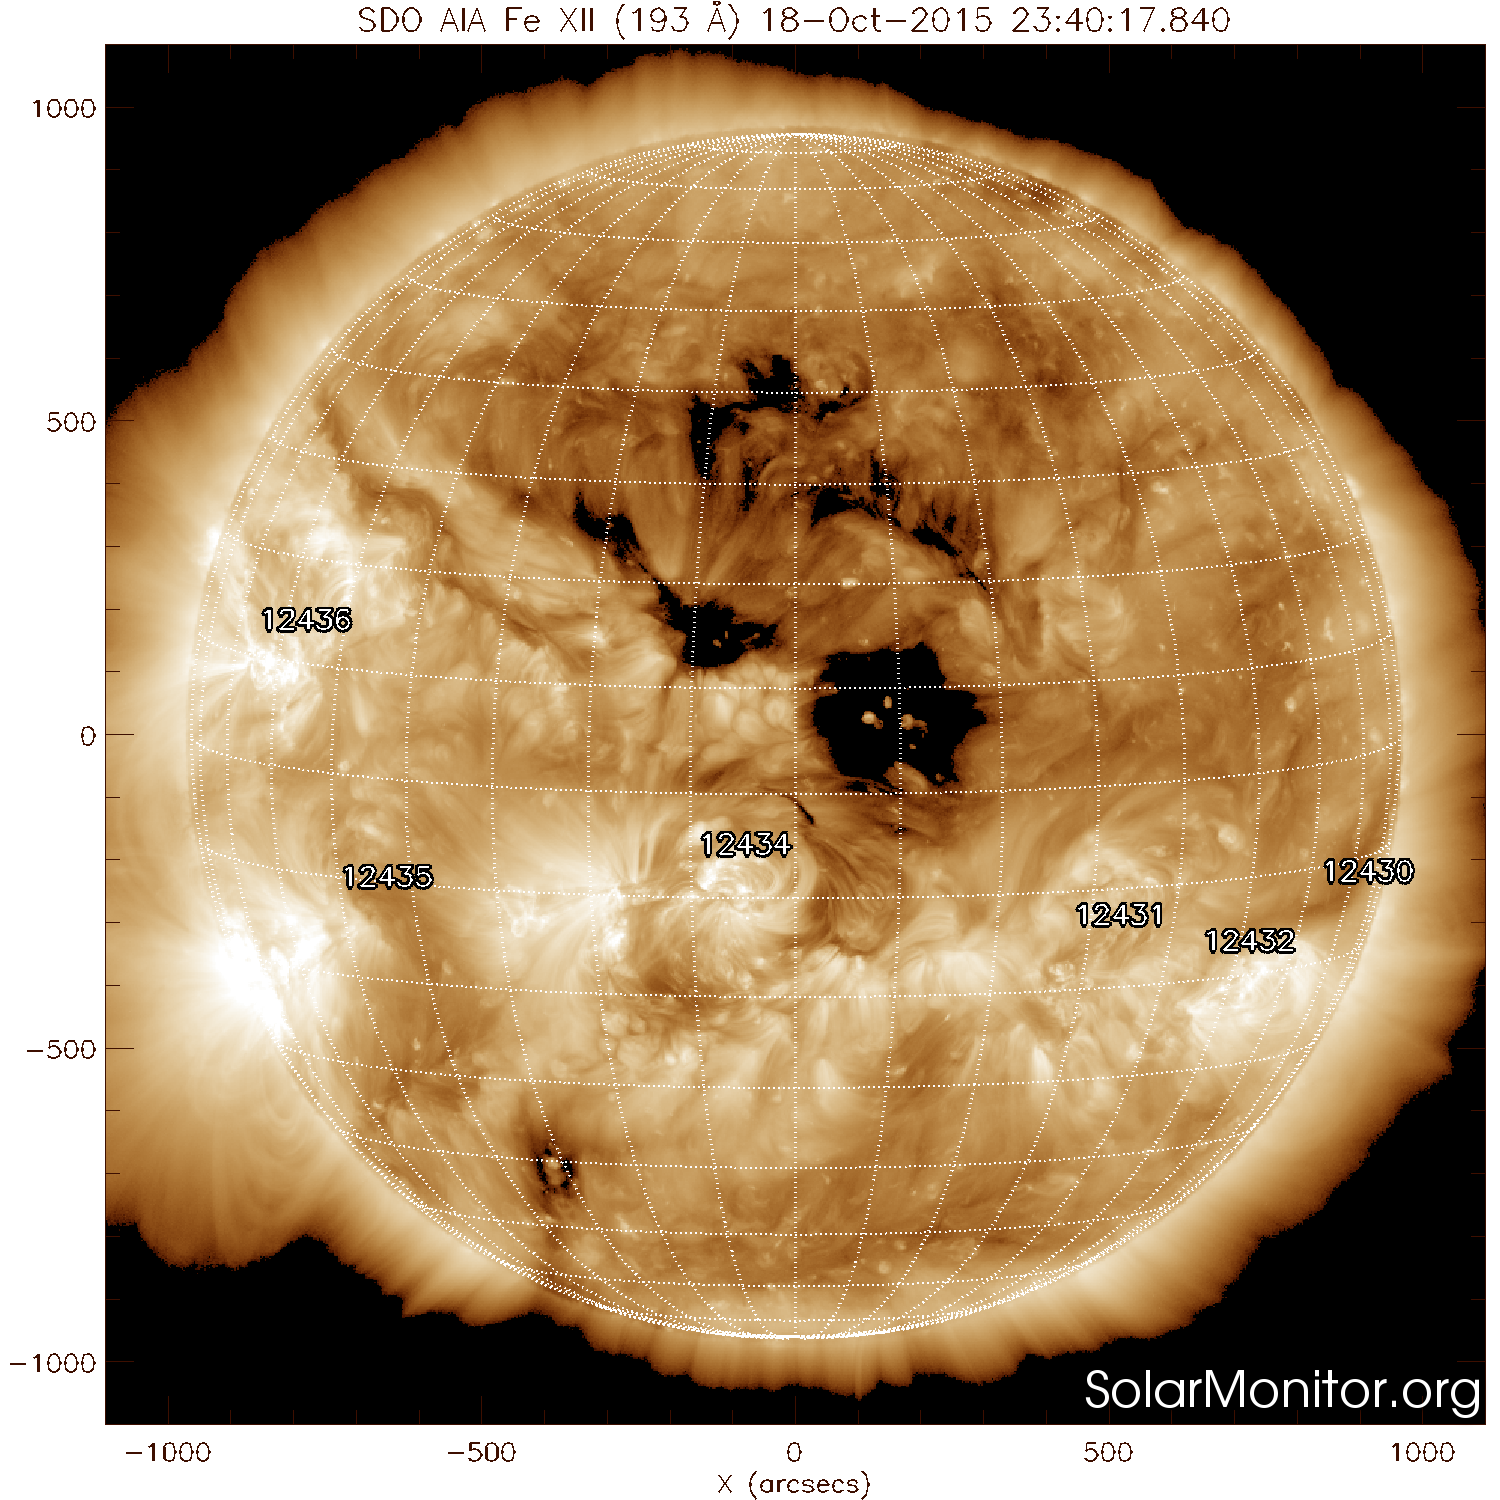
The picture underneath shows the Sun in white light on 23 October around 04:30UT, as imaged by SDO (http://sdo.gsfc.nasa.gov/). The NOAA number of each sunspot group has been indicated, with NOAA 2436 the most prominent region. The other groups of interest are quite simple and are located on the southern solar hemisphere.
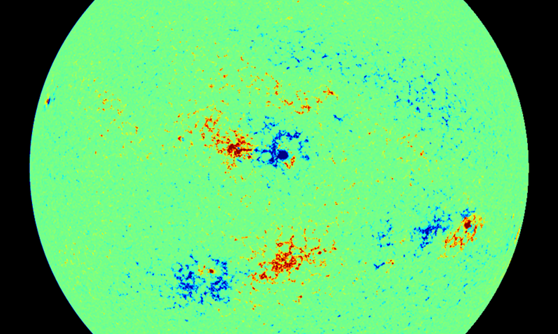
The magnetogram underneath shows that the magnetic fields are concentrated where there are sunpots, and quite dispersed in the other areas, i.e. in the spotless parts of the groups and outside the active regions. A reddish color means that the magnetic field lines are coming out of the solar surface (positive), whereas the bluish colors indicate field lines returning into the solar surface. It's a fun exercise to find the magnetic patches that correspond to the sunspots visible in white light.
SDO's view in extreme ultraviolet (EUV; AIA 171 filter at temperatures around 700.000 degrees) reveals dramatic differences compared to white light. The EUV image shows several bright patches, which do not always coincide with the location of the sunspots. This is in particular true for the groups on the southern hemisphere. There are also a large number of closed coronal loops visible, connecting patches of opposite magnetic polarity. These loops are indeed nothing else than magnetic flux tubes containing trapped "hot" charged particles and reaching all the way into the corona, the Sun's hot outer atmosphere. It's the presence of these particles that gives us an idea of the magnetic structure in the Sun's atmosphere. These coronal loops are quite common, and one can see for example a few loops between the leading and trailing portion of NOAA 2436 on the northern solar hemisphere.
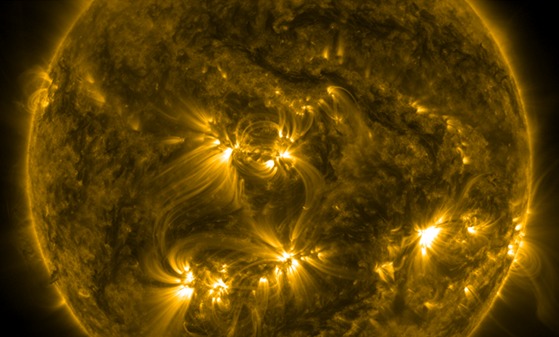
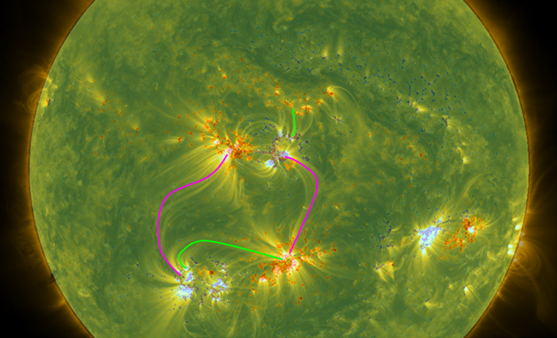
Amazingly, NOAA 2436 seems actually to be connected via coronal loops to NOAA 2437 and NOAA 2435 on the southern hemisphere, as indicated in pink on the combined magnetogram/AIA 171-image underneath. Moreover, the spotless trailing portion of NOAA 2437 is also connected to the leading portion of NOAA 2435 (annotated in green). The leading portion of NOAA 2436 is connected to opposite polarity patches to the north. This all makes the EUV (coronal) image a lot more complex than what one might have expected after a first look at the white light image. These "trans-equatorial" loops are no short-lived features, but were already present when the series of sunspot groups were rounding the east limb about a week earlier. At that time, they could be observed as delicate arches spanning the solar equator and connecting the two solar hemispheres with each other.
Each year, during the ESWW conference, people from all over the world gather in Belgium to discuss the newest insights in space weather and try to find appropriate answers to the challenges and threats that space weather imposes. The meeting in 2014 was the eleventh, with more than 400 participants. Several communities - scientists, navigation based industry, space agencies, engineers, forecast centers, energy suppliers, space tourism, etc. - are involved in space weather in some way. The ESWW offers the platform to exchange knowledge and to mingle.
In less than 25 days, we hope to welcome you to ESWW12, at the Belgian sea, in Oostende. If you registered already, thanks! If you didn’t, please don’t hesitate any longer.
We would like also to draw your attention to the registration deadline for the conference dinner: November 6 at the latest (Brussels time). After the walking dinner, the dinner participants are invited to the open bar and the casino tables. Try your black jack, poker and roulette luck with fake casino chips.
Solar flare activity fluctuated between very low and low during the week.
In order to view the activity of this week in more detail, we suggest to go to the following website from which all the daily (normal and difference) SWAP movies can be accessed: http://proba2.oma.be/ssa
This page also lists recorded flaring events.
A weekly overview movie can be found here: http://proba2.sidc.be/swap/data/mpg/movies/weekly_movies/weekly_movie_2015_10_19.mp4 (SWAP week 291).
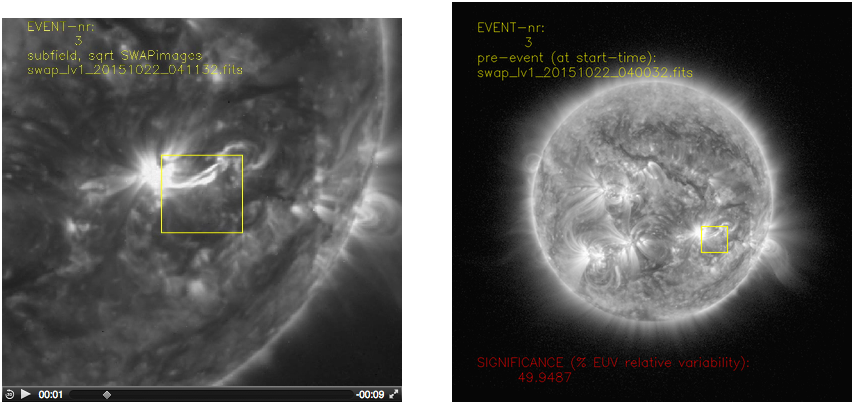
Solar activity was low this week. AR 2434 produced a long duration C-class flare on 2015-Oct-22 between 03:13 and 05:15 UT. Below we provide SWAP images from the time when this C-class flare occurred. The annotated snapshots are produced by the Solar Feature Automated Search Tool (SoFAST). This tool detects dynamic solar events in EUV images from SWAP in near real-time. The snapshots illustrate the location of the flare on the solar disk (right) and a zoomed image (left).
The complete SoFAST online event list and additional plots are available on http://www.sidc.be/sofast.
2015-Oct-22:
Long duration C4.4 flare
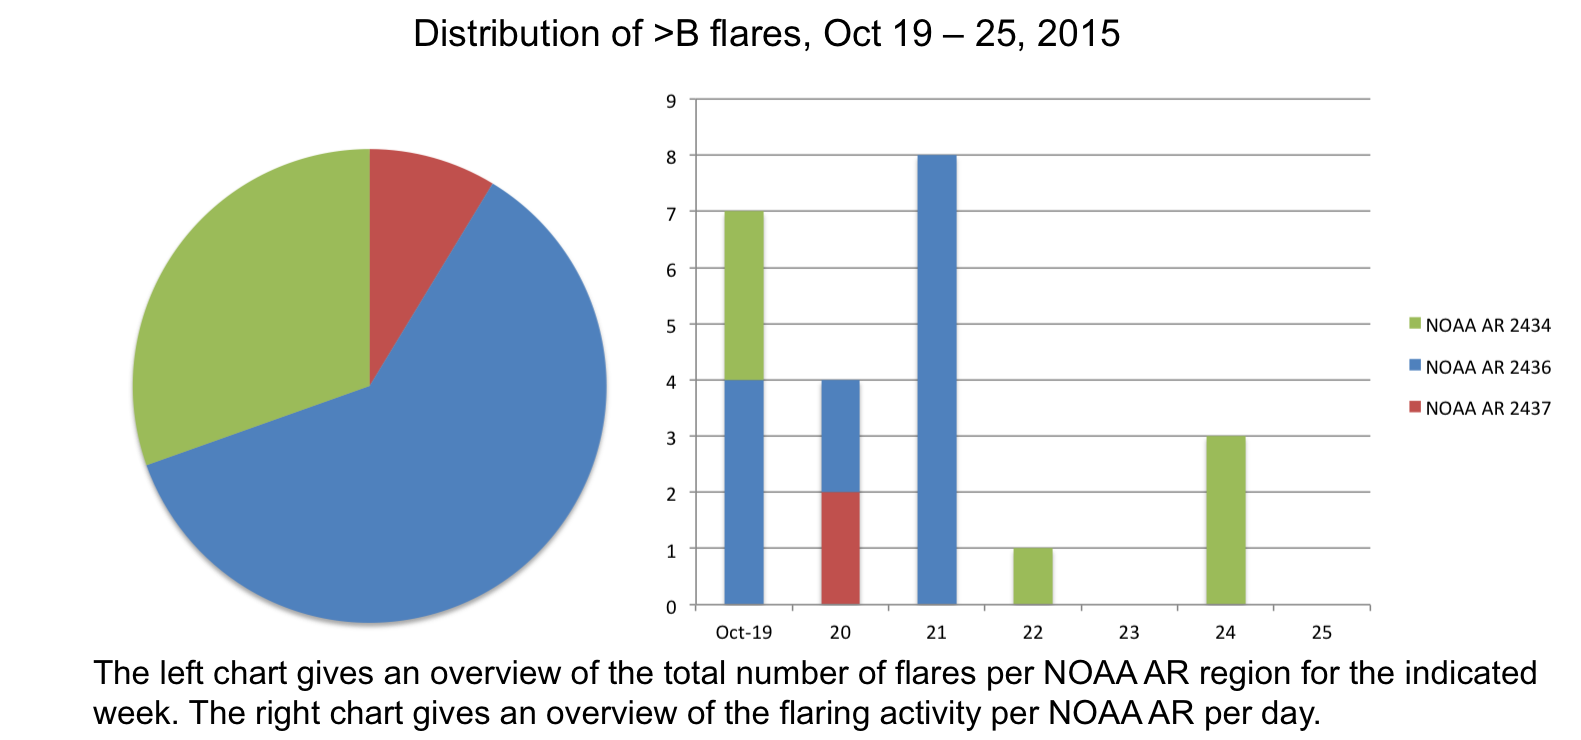
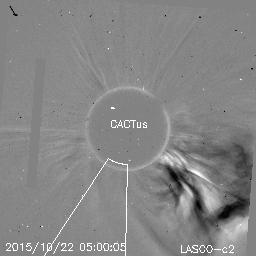
Solar activity was low to very low. NOAA 2434 and 2436 were the main players of the past week, with NOAA 2436 being the largest and most complex region. The other regions had a rather simple magnetic structure. Twenty-three C-flares were produced, with a C7.7 flare as strongest one originating from NOAA 2436 on October 21. NOAA 2434 produced a long duration C4.4 flare on October 22, accompanied by a CME. The CME propagated to the Southwest, but also had an Earth-directed component.
The solar wind was at nominal levels for the first two days. The flow of an equatorial coronal hole (see black area in picture of SDO AIA 193 below) arrived on October 21, resulting in increased speed and temperature values and an enhanced Interplanetary Magnetic Field (IMF).
On October 24 a shock was observed, indicating the arrival of the October 22 CME. The IMF magnitude reached 15 nT and the Bz component was mainly positive.
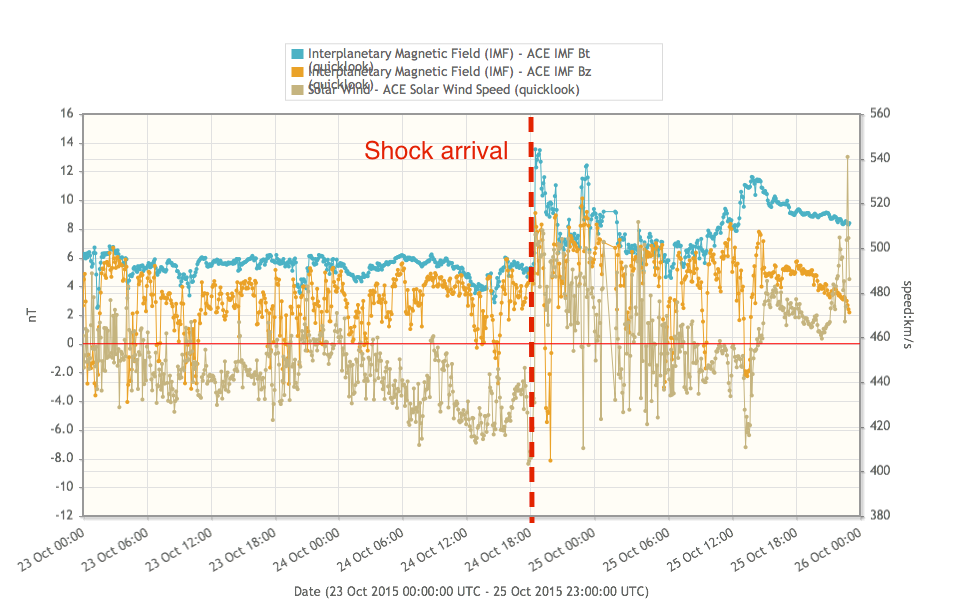
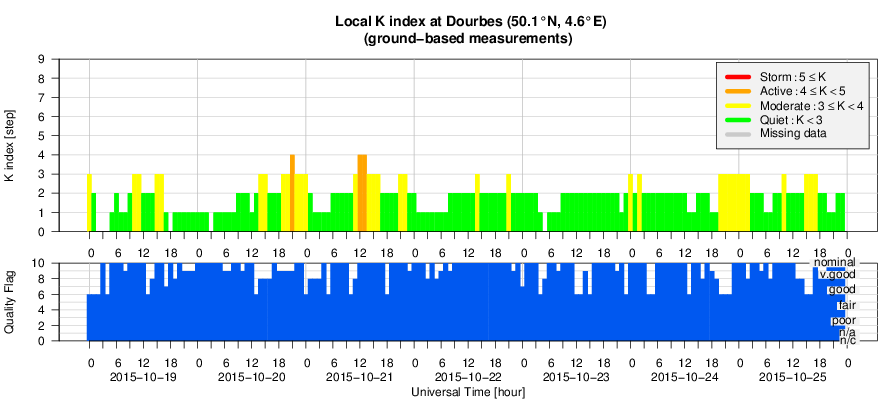
The phi angle of the IMF was variable through the whole period. Geomagnetic conditions were quiet to unsettled, with a few isolated time slots of active conditions.
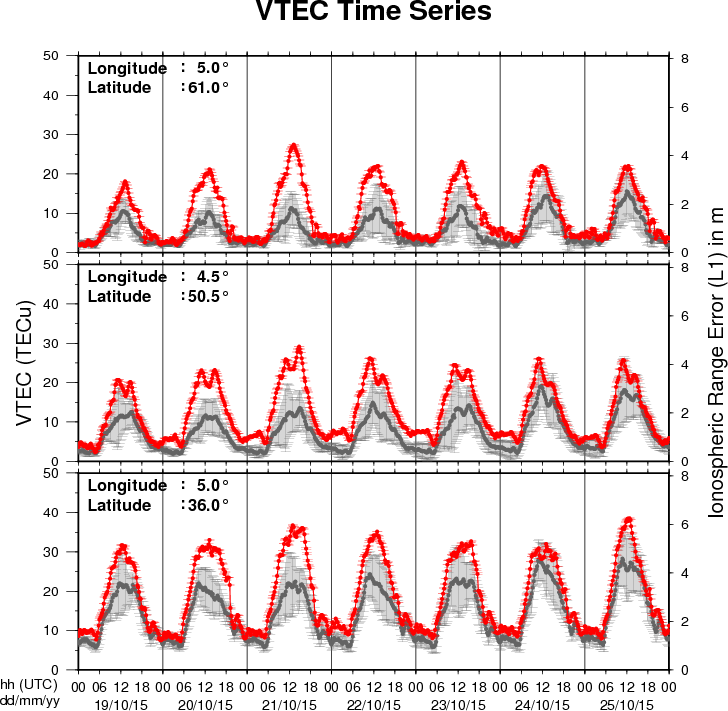
The figure shows the time evolution of the Vertical Total Electron Content (VTEC) (in red) during the last week at three locations:
a) in the northern part of Europe(N61°, 5°E)
b) above Brussels(N50.5°, 4.5°E)
c) in the southern part of Europe(N36°, 5°E)
This figure also shows (in grey) the normal ionospheric behaviour expected based on the median VTEC from the 15 previous days.
The VTEC is expressed in TECu (with TECu=10^16 electrons per square meter) and is directly related to the signal propagation delay due to the ionosphere (in figure: delay on GPS L1 frequency).
The Sun's radiation ionizes the Earth's upper atmosphere, the ionosphere, located from about 60km to 1000km above the Earth's surface.The ionization process in the ionosphere produces ions and free electrons. These electrons perturb the propagation of the GNSS (Global Navigation Satellite System) signals by inducing a so-called ionospheric delay.
See http://stce.be/newsletter/GNSS_final.pdf for some more explanations ; for detailed information, see http://gnss.be/ionosphere_tutorial.php
Start : 2015-11-09 - End : 2015-11-11
The fundamentally most important source of inner heliospheric
plasma physics and space weather is the active Sun, its solar
active region eruptions. Prediction of the evolution and influence
of solar active regions on solar storms in the near-Earth
environment is of particular interest to several forecasting
institutions, industrial stakeholders, and the public in
general.
State-of-the-art solar storm prediction tools are limited to
monitoring solar active regions, registering eruptions and mass
ejections while attempting, then, at extrapolating subsequent
evolution and spatio-temporal propagation: no realistic
physics-based and data-driven synthesis tool exists, which is
capable of predicting when a solar flare will be triggered, or when
a Coronal Mass Ejection will be launched into inter-planetary
space. In short, we are not yet able to answer the question: When
and why do solar storms launch?
Our meeting will be focused around initiation of space weather
events at the Sun. We will discuss and develop three major
challenges, and we aim to develop a draft resolution road-map for
those challenges during the meeting.
Website:
https://indico.nbi.ku.dk/conferenceDisplay.py?confId=817
Start : 2015-11-13 - End : 2015-11-13
With the launch of NASA's Solar Dynamics Observatory (SDO)
mission on 02/11/2010, researchers in solar physics have entered
the era of Big Data. The Atmospheric Imaging Assembly (AIA)
instrument on SDO provides imaging data and the Helioseismic and
Magnetic Imager (HMI) instrument on SDO provides magnetic field
data. Both instruments record data at a high spatial resolution and
a time cadence, amounting to about 1 Petabyte of scientific data
each year. The Big Data challenges in Solar Astronomy are expected
to grow even further with the inauguration of the NSF funded Daniel
K. Inouye Solar Telescope (DKIST), currently under construction in
Hawaii. This telescope is expected to generate: 3-5 Petabytes of
data per year.
Start : 2016-01-24 - End : 2016-01-29
Understanding and being able to forecast space weather is an
increasingly important aspect of our modern technology-reliant
society. This workshop will treat all aspects of space weather,
ranging from solar origins of transient events (CMEs, Flares, CIRs)
to their propagation through the heliosphere and effects on Earth
and planetary bodies, from particle energization to forecasting
particle environment and its effects on technological and
biological systems, as well as solar-cycle effects and coupling of
space weather to atmospheric response. Metrics to assess
predictions will also be discussed. The workshop is structured
along the lines of the COSPAR space weather pathways and will
include invited, contributed talks and posters, as well as panel
discussions and tutorials.
Website:
http://www.cessi.in/ssw/program.html
Start : 2016-06-27 - End : 2016-07-01
Website:
http://www.issibern.ch/program/workshops.html
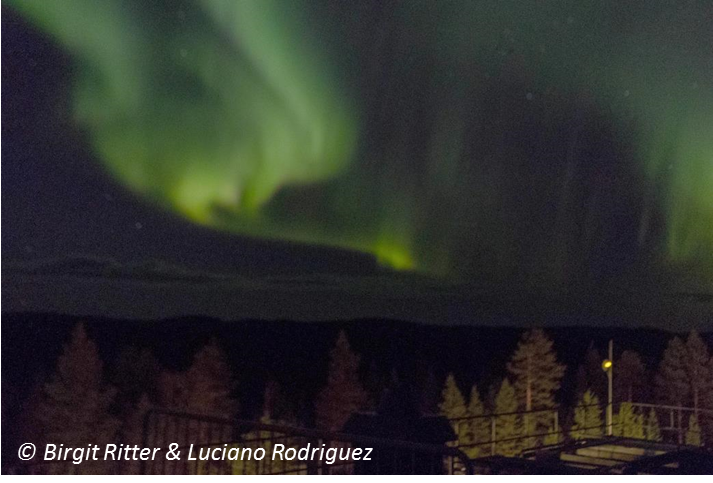
In the previous newsletter (dd. 23 October 2015), a picture on the aurora figured in the "review of geomagnetic activity". As it turns out, the picture was actually taken by Birgit Ritter, and subsequently processed by Luciano Rodriguez. So here once again this great picture, with the proper credits. The picture was taken from Kiruna (Sweden) on 15 October.