- Table of Content
- 1.A filament kis...
- 2.PROBA2 Observa...
- 3.Review of sola...
- 4.The Internatio...
- 5.Noticeable Sol...
- 6.Geomagnetic Ob...
- 7.Review of iono...
- 8.Future Events
2. PROBA2 Observations (9 Nov 2015 - 15 Nov 2015)
3. Review of solar and geomagnetic activity
4. The International Sunspot Number
5. Noticeable Solar Events (9 Nov 2015 - 15 Nov 2015)
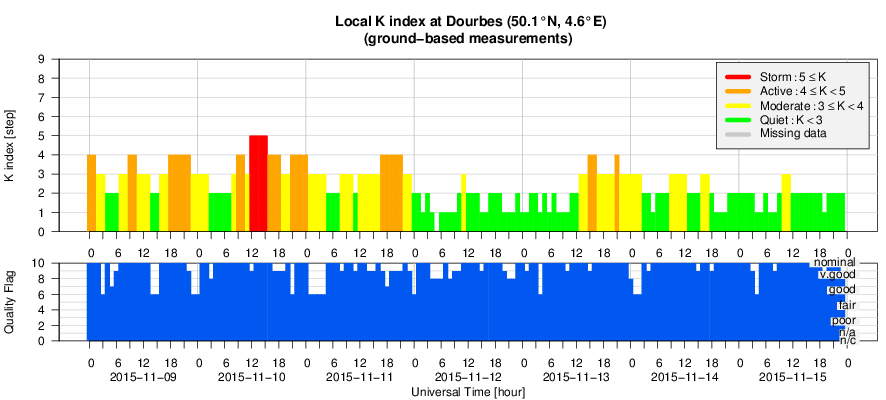
6. Geomagnetic Observations at Dourbes (9 Nov 2015 - 15 Nov 2015)
7. Review of ionospheric activity (9 Nov 2015 - 15 Nov 2015)
8. Future Events
A filament kisses the Sun goodbye!
Solar filaments are clouds of charged particles ("plasma") above the solar surface squeezed between magnetic regions of opposite polarity. Being cooler and denser than the plasma underneath and their surroundings, they appear as dark lines when seen on the solar disk and as bright blobs when seen near the solar limb (then they are called "prominences"). Special filters are required to observe these features, and one such a filter is the Hydrogen-alpha (H-alpha) line in the red part of the solar spectrum.
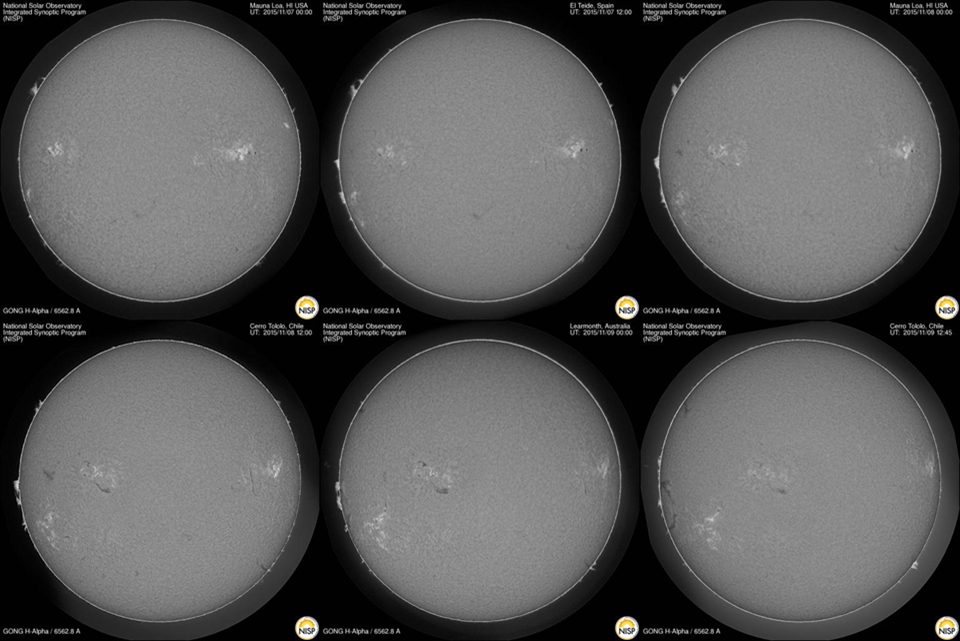
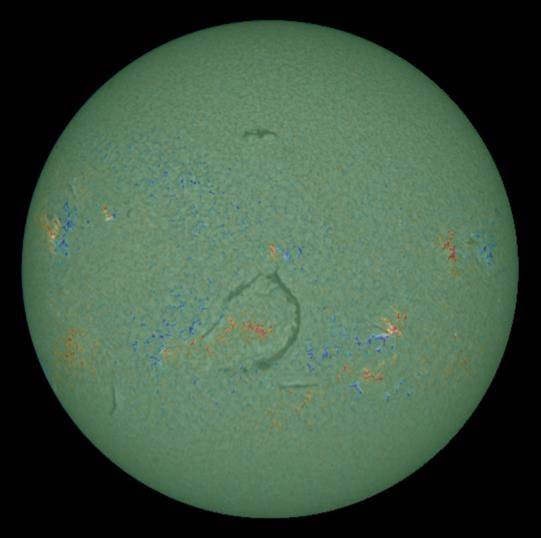
A prominence started to round the solar east limb on 07 November. This can be seen in the collage above running from 07 till 09 November (intervals of 12 hours). Initially it seemed to consist of a bunch of isolated chunks of "cold" plasma, but as it turned further onto the solar disk, the full extent of the filament became clear. It appeared to be a single J-shaped filament of about 800.000 km in length, open near its southeast end in H-alpha (in extreme ultraviolet, it appeared nearly closed). It was draped around a spotless region of positive magnetic polarity, and surrounded by areas of negative magnetic polarity. The impressive length, unusual shape, and magnetic configuration of this filament can be seen in the image underneath. It combines an H-alpha picture from GONG (http://halpha.nso.edu/) with a magnetogram from the Solar Dynamics Observatory (http://sdo.gsfc.nasa.gov/) on 14 November at 15:55UT. The reddish color indicates positive magnetic polarity (field lines coming out of the solar surface), the bluish color represents negative polarity (magnetic field lines returning to the solar interior).
Long filaments are known to eventually erupt, as the surrounding magnetic fields usually become unstable at some point. In this case though, only a small sunspot region to the north of the filament was visible (NOAA 2453), and negative coronal holes to the northeast and southeast. So it took a while before this filament erupted, first showing some instability to its top (near NOAA 2453), before erupting during the evening of 15 November starting from its southernmost footpoint, possibly the result of the interaction with another nearby filament. The curbed (western) part of the filament got ejected into space, with a part returning to the remaining northeastern part.
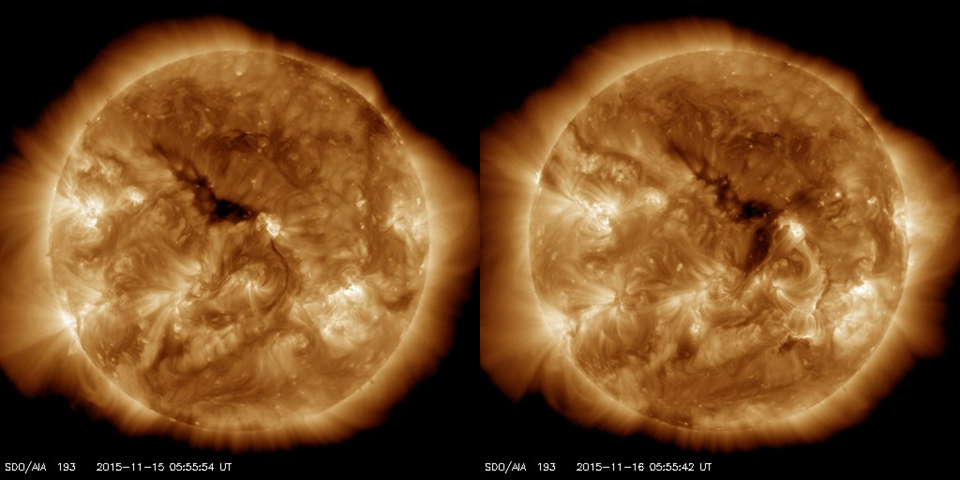
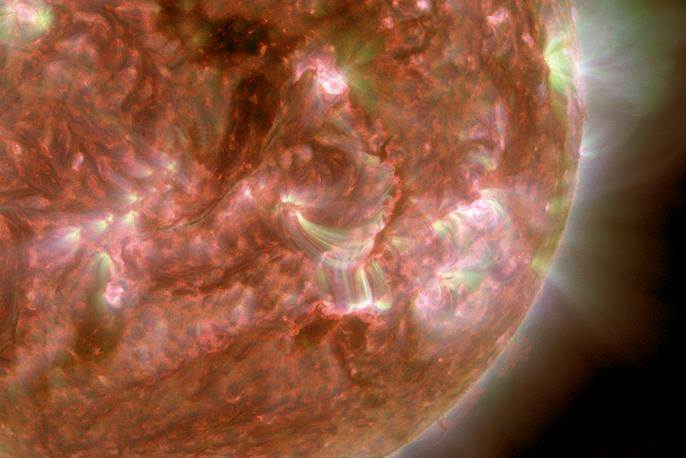
This movie at https://youtu.be/LIU-ac9JJis shows the eruption in H-alpha and in the extreme ultraviolet (combination of SDO/AIA 193, 171 and 304). The coronal loops and a transient coronal hole to the north in the AIA 193 testify of the material being ejected into space, as can be seen in the before/after eruption comparison underneath. The end of the movie also shows the eruption of the smaller filament to the southwest. It was also associated with a transient coronal hole and post-eruption coronal loops, and contributed considerably to the very complex coronal outlook. Coronal mass ejections related to both filament eruptions were observed.
PROBA2 Observations (9 Nov 2015 - 15 Nov 2015)
Solar Activity
Solar flare activity fluctuated between very low and moderate during the week.
In order to view the activity of this week in more detail, we suggest to go to the following website from which all the daily (normal and difference) movies can be accessed:
http://proba2.oma.be/ssa
This page also lists the recorded flaring events.
A weekly overview movie can be found here (SWAP week 294).
http://proba2.oma.be/swap/data/mpg/movies/weekly_movies/weekly_movie_2015_11_09.mp4
Details about some of this week's events, can be found further below.
Monday Nov 09
On Monday 2015Nov09 PROBA2 observed a NOAA M3.9 flare at 13:12 UT. This flare was
associated with a partial halo CME and a small rise in proton numbers.
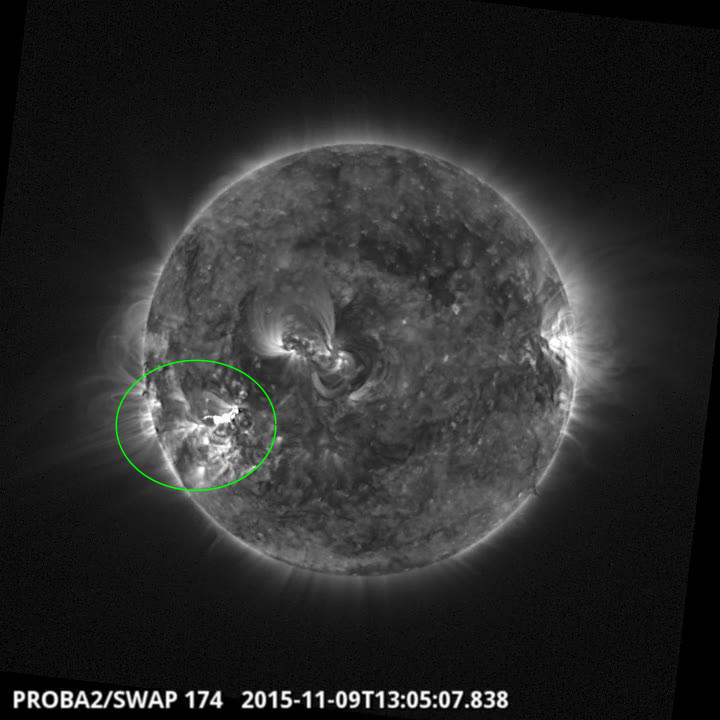
Eruption on the southeast quadrant @ 13:05 SWAP image
Find a movie of the events here (SWAP movie)
http://proba2.oma.be/swap/data/mpg/movies/20151109_swap_movie.mp4
Sunday Nov 15
On 2015Nov15 PROBA2 SWAP observed the eruption of a small filament channel near disk centre.
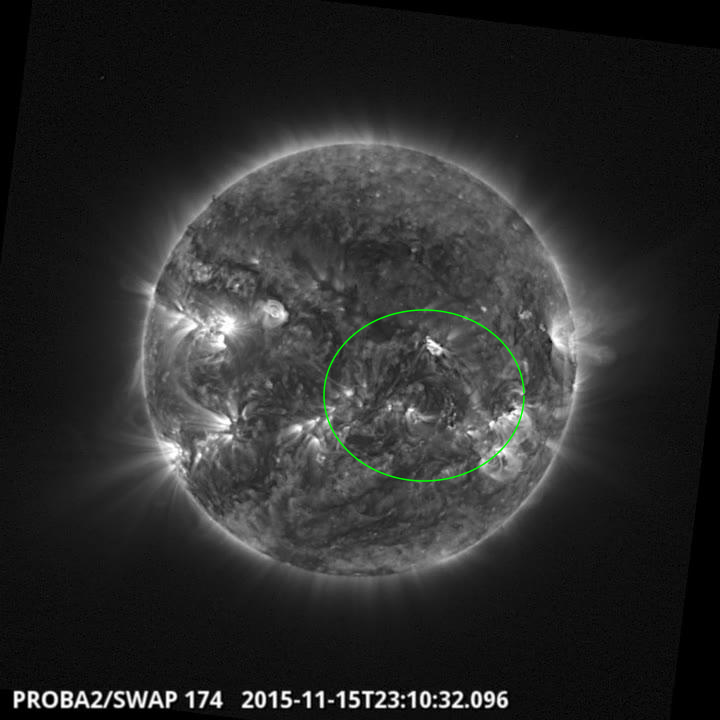
Filament eruption on the centre @ 23:10 SWAP image
Find a movie of the events here (SWAP movie)
http://proba2.oma.be/swap/data/mpg/movies/20151115_swap_movie.mp4
Review of solar and geomagnetic activity
Solar Activity
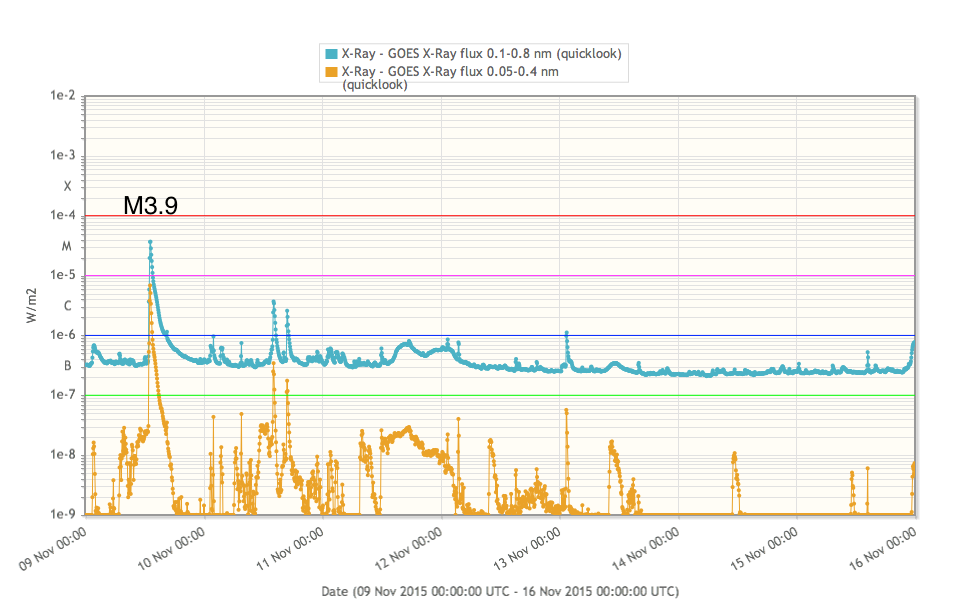
Over the past week solar flaring activity has been low. There have been 5 C-class flares and 1 M-class flare. NOAA Active Regions (ARs) 2449 and 2443 produced the most activity, while all other ARs remained stable producing little activity, with small amounts of flux emergence. AR 2449 produced the largest flare, an M3.9 flare, peaking at 13:12 UT on 2015-Nov-09.
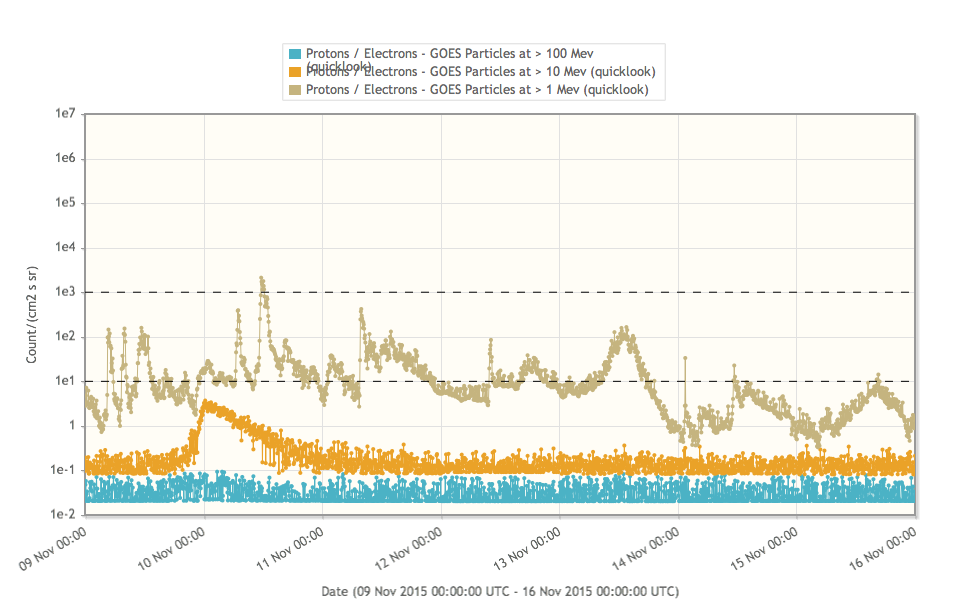
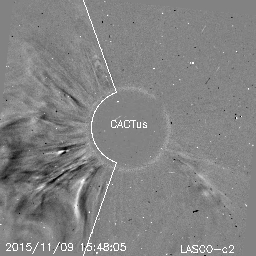
The greater than 10 MeV proton flux was enhanced by the M flare, and peaked around 3.5 pfu. The above-mentioned M flare had an associated partial halo Coronal Mass Ejection (CME), which was recorded by CACTUS at 14:00 UT on 2015-Nov-09.
The CME had a velocity of 585 km/s +/- 247 km/s. This was the only Earth directed CME recorded through the week. A couple of small filaments traversed the central latitudes of the solar disk throughout the week and showed some signs of activity mid-week. Both regions eventually erupted late on 2015-Nov-15 and early 2015-Nov-16.
Geomagnetic Activity
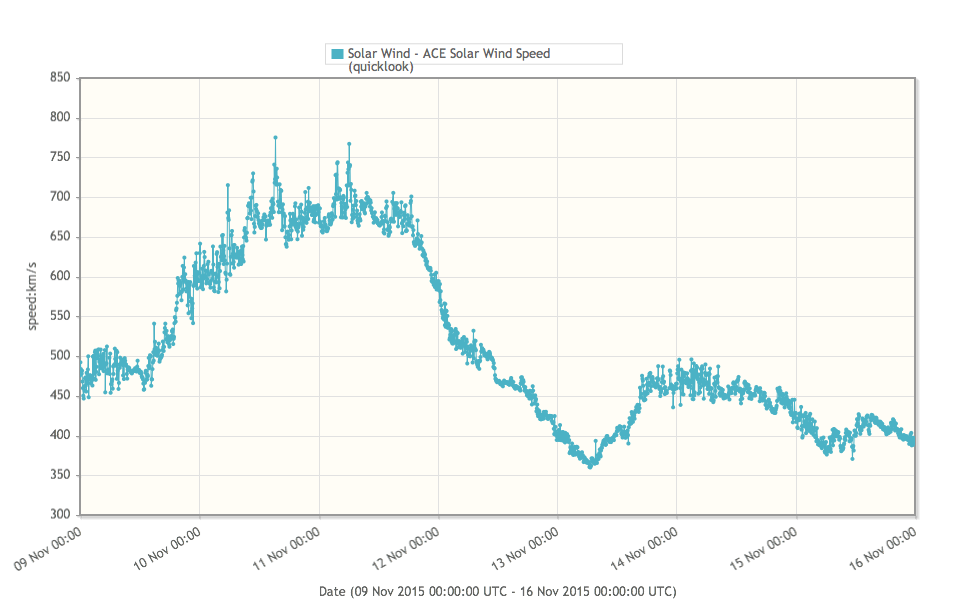
The solar wind speed was relatively high, at 700 km /s, early in the week on 2015-Nov-10 and 11. This was created by a High Speed Stream (HSS) related to a positive Coronal Hole (CH), located in the North West. The speed decreased mid-week and then remained low at around 420 km /s, with a small increase on 2015-Nov-14 created by another HSS.
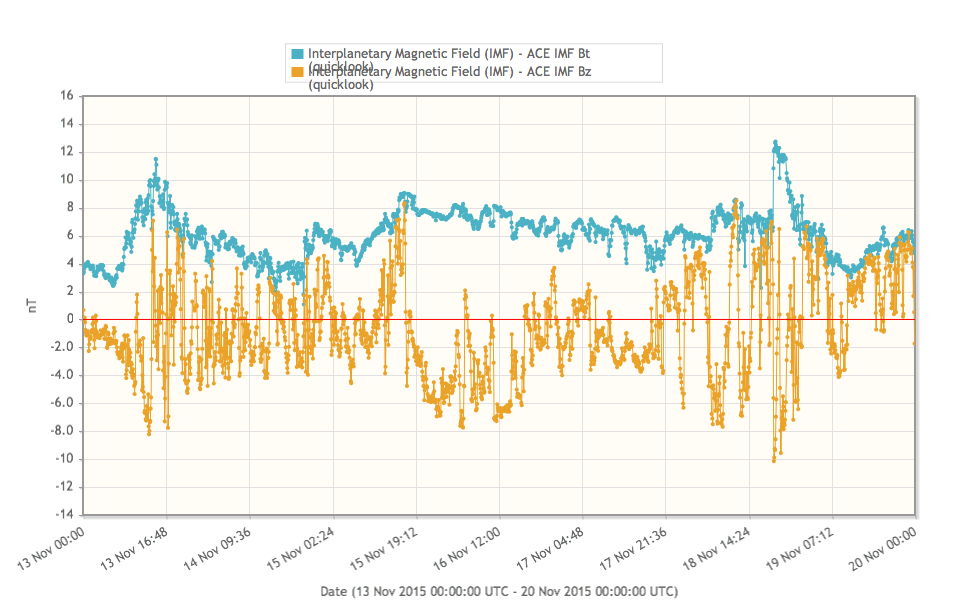
Similarly the total magnetic field strength began the week high around 10 nT, and peaked again on 2015-Nov-13. The Bz oscillated between positive and negative throughout this period.
As a result of the HSS and increased field strength, geo-activity was active early in the week and reached storm levels, peaking at Kp 6 on 2015-Nov-10. Geo-activity also reached storm levels (Kp 5) around 18:00 UT on 2015-Nov-11, which was possibly caused by the trailing edge of the HSS or a glancing blow from the CME generated on 2015-Nov-09.
The International Sunspot Number
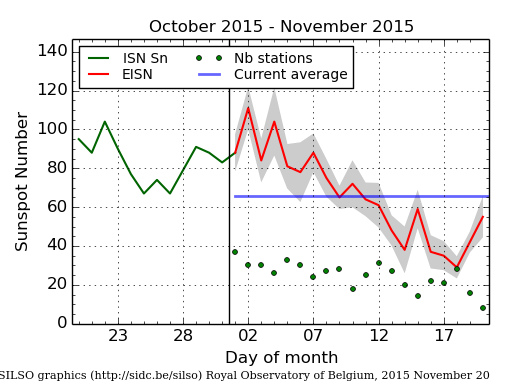
The daily Estimated International Sunspot Number (EISN, red curve with shaded error) derived by a simplified method from real-time data from the worldwide SILSO network. It extends the official Sunspot Number from the full processing of the preceding month (green line). The plot shows the last 30 days (~ one solar rotation). The horizontal blue line shows the current monthly average, while the green dots give the number of stations included in the calculation of the EISN for each day.
Noticeable Solar Events (9 Nov 2015 - 15 Nov 2015)
| DAY | BEGIN | MAX | END | LOC | XRAY | OP | 10CM | TYPE | Cat | NOAA |
| 09 | 1249 | 1312 | 1328 | S11E41 | M3.9 | 2B | 670 | III/2IV/1II/2 | 70 | 2449 |
| LOC: approximate heliographic location | TYPE: radio burst type |
| XRAY: X-ray flare class | Cat: Catania sunspot group number |
| OP: optical flare class | NOAA: NOAA active region number |
| 10CM: peak 10 cm radio flux |
Geomagnetic Observations at Dourbes (9 Nov 2015 - 15 Nov 2015)
Review of ionospheric activity (9 Nov 2015 - 15 Nov 2015)
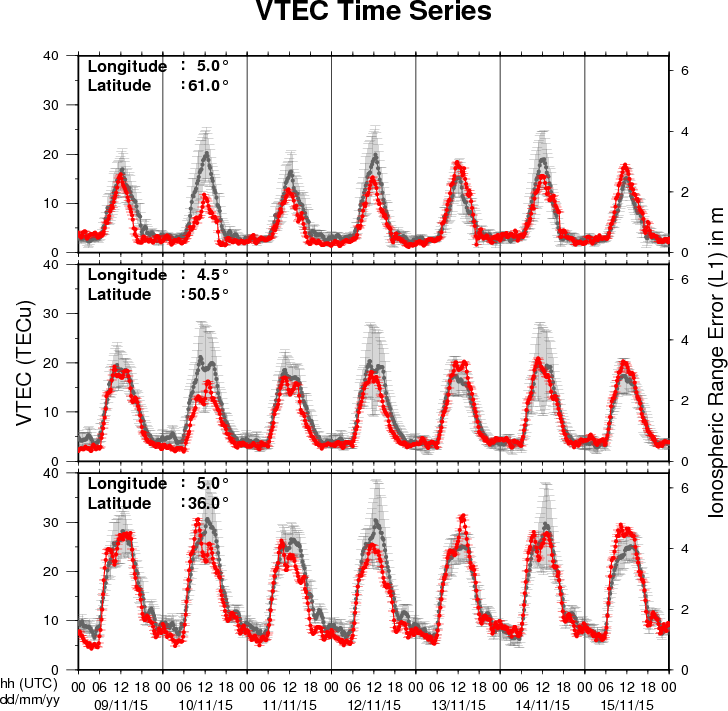
The figure shows the time evolution of the Vertical Total Electron Content (VTEC) (in red) during the last week at three locations:
a) in the northern part of Europe(N61°, 5°E)
b) above Brussels(N50.5°, 4.5°E)
c) in the southern part of Europe(N36°, 5°E)
This figure also shows (in grey) the normal ionospheric behaviour expected based on the median VTEC from the 15 previous days.
The VTEC is expressed in TECu (with TECu=10^16 electrons per square meter) and is directly related to the signal propagation delay due to the ionosphere (in figure: delay on GPS L1 frequency).
The Sun's radiation ionizes the Earth's upper atmosphere, the ionosphere, located from about 60km to 1000km above the Earth's surface.The ionization process in the ionosphere produces ions and free electrons. These electrons perturb the propagation of the GNSS (Global Navigation Satellite System) signals by inducing a so-called ionospheric delay.
See http://stce.be/newsletter/GNSS_final.pdf for some more explanations ; for detailed information, see http://gnss.be/ionosphere_tutorial.php
Future Events
For more details, see http://www.spaceweather.eu/en/event/future
COSPAR/ILWS workshop: science for space weather in Goa, India
Start : 2016-01-24 - End : 2016-01-29
Understanding and being able to forecast space weather is an
increasingly important aspect of our modern technology-reliant
society. This workshop will treat all aspects of space weather,
ranging from solar origins of transient events (CMEs, Flares, CIRs)
to their propagation through the heliosphere and effects on Earth
and planetary bodies, from particle energization to forecasting
particle environment and its effects on technological and
biological systems, as well as solar-cycle effects and coupling of
space weather to atmospheric response. Metrics to assess
predictions will also be discussed. The workshop is structured
along the lines of the COSPAR space weather pathways and will
include invited, contributed talks and posters, as well as panel
discussions and tutorials.
Website:
http://www.cessi.in/ssw/program.html
The Scientific Foundation of Space Weather
Start : 2016-06-27 - End : 2016-07-01
Website:
http://www.issibern.ch/program/workshops.html