- Table of Content
- 1.Farside erupti...
- 2.PROBA2 Observa...
- 3.Review of sola...
- 4.The Internatio...
- 5.Review of geom...
- 6.Geomagnetic Ob...
- 7.Review of iono...
- 8.Future Events
2. PROBA2 Observations (7 Dec 2015 - 13 Dec 2015)
3. Review of solar activity
4. The International Sunspot Number
5. Review of geomagnetic activity
6. Geomagnetic Observations at Dourbes (7 Dec 2015 - 13 Dec 2015)
7. Review of ionospheric activity (7 Dec 2015 - 13 Dec 2015)
8. Future Events
Farside eruption
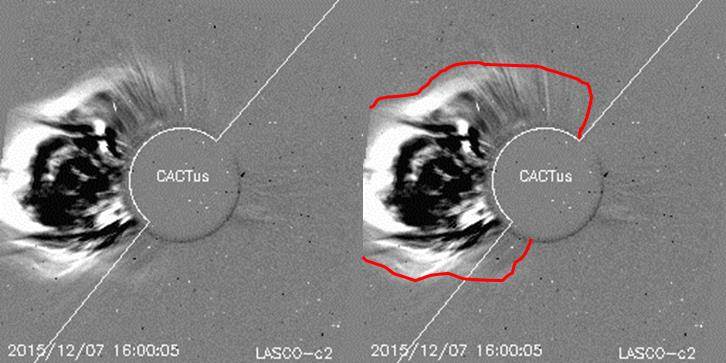
Last week was once again a nice example of a relatively inactive Sun. It was quite a surprise when CACTus (http://www.sidc.oma.be/cactus/) detected a partial halo coronal mass ejection (CME) in SOHO's coronagraphic imagery on 07 December. Indeed, starting at 15:12UT, a CME having a width of about 210 degrees could be seen emanating from the Sun's east limb traveling at a plane-of-the-sky speed of about 650 km/s.
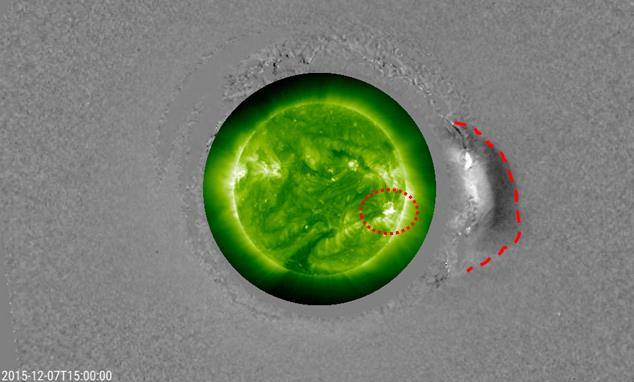
Thanks to Stereo-A, which is now providing all day round imagery of the Sun's farside, the source of the eruption was quickly identified. Indeed, around 15:00UT, a solar flare and related coronal disturbance can be observed in extreme ultraviolet (EUV) images in a region in the southwestern solar quadrant. The strength of the flare was estimated to be a low-level M-class flare or possibly an upper-level C-class flare, so not a very strong event.
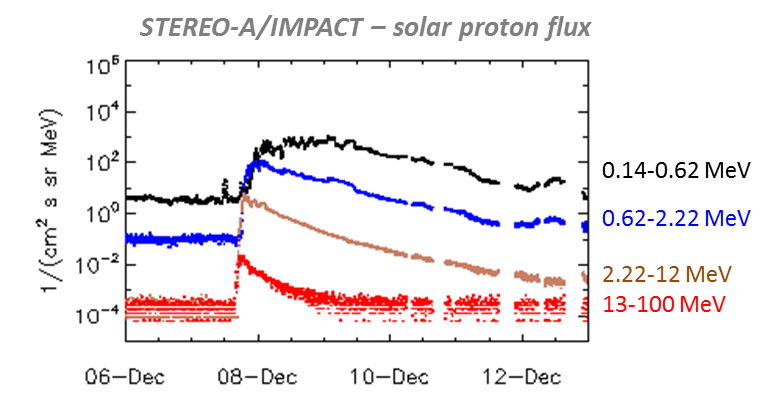
The position of the source region favored a good link with the STEREO-A spacecraft, so it was no surprise that the IMPACT-instrument on-board STEREO-A registered an important increase of solar energetic particles (protons,...) starting about an hour after the blast. Pending the energy-band observed, a 100- to 10.000 fold increase in the particle flux was observed. It took several days before the particle fluxes had decreased back to nominal levels. Data from PLASTIC, an instrument on-board STEREO-A providing solar wind data, did not show any particular jump in solar wind speed over the next few days, indicating that (the bulk of) this CME probably had missed STEREO-A.
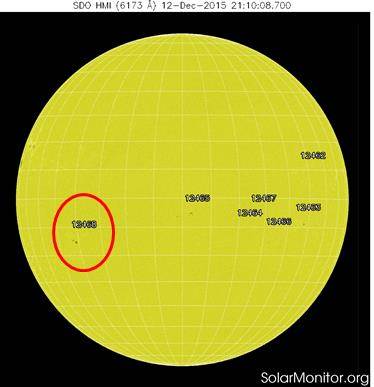
When the active region finally rounded the east limb late on 09 December, it concerned only a small sunspot region (NOAA 2468) which produced a handful of low-level C-class flares for the remainder of the week. A short movie of the event as seen by STEREO-A (EUV and difference coronagraphic images) and SOHO (difference coronagraphic images) can be found at https://youtu.be/b2ylRlGsjNY
PROBA2 Observations (7 Dec 2015 - 13 Dec 2015)
Solar Activity
Solar flare activity remained low during the week.
In order to view the activity of this week in more detail, we suggest to go to the following website from which all the daily (normal and difference) movies can be accessed: http://proba2.oma.be/ssa
This page also lists the recorded flaring events.
A weekly overview movie can be found here (SWAP week 298).
Details about some of this week’s events, can be found further below.
http://proba2.oma.be/swap/data/mpg/movies/weekly_movies/weekly_movie_2015_12_07.mp4
Monday Dec 07
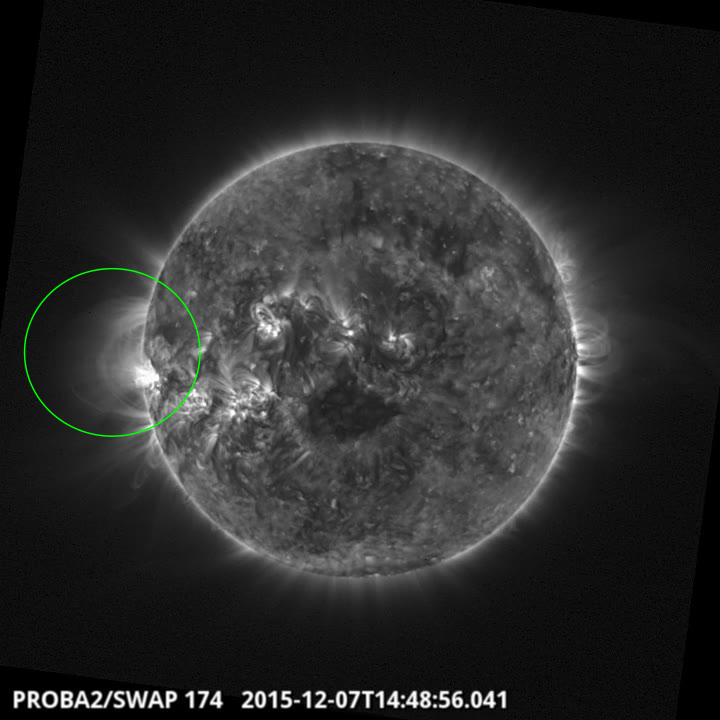
There was an eruption off of the East limb @ 14:48 UT on 2015Dec07 The above SWAP image
shows the eruption initiation
Find a movie of the events here (SWAP movie)
http://proba2.oma.be/swap/data/mpg/movies/20151207_swap_movie.mp4
Friday Dec 11
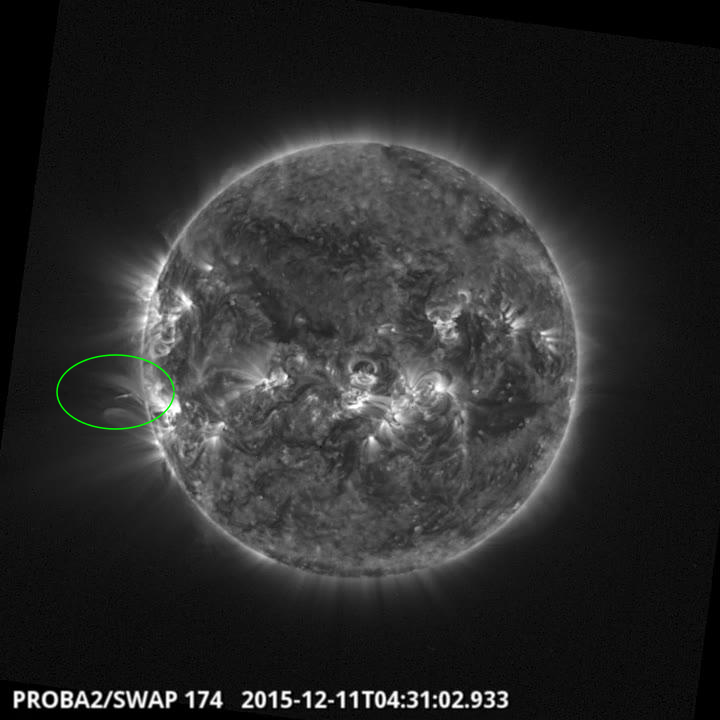
There was an eruption observed by SWAP off of the East limb @ 04:31 UT on 11Dec2015
Find a movie of the event here (SWAP movie)
http://proba2.oma.be/swap/data/mpg/movies/20151211_swap_movie.mp4
Review of solar activity
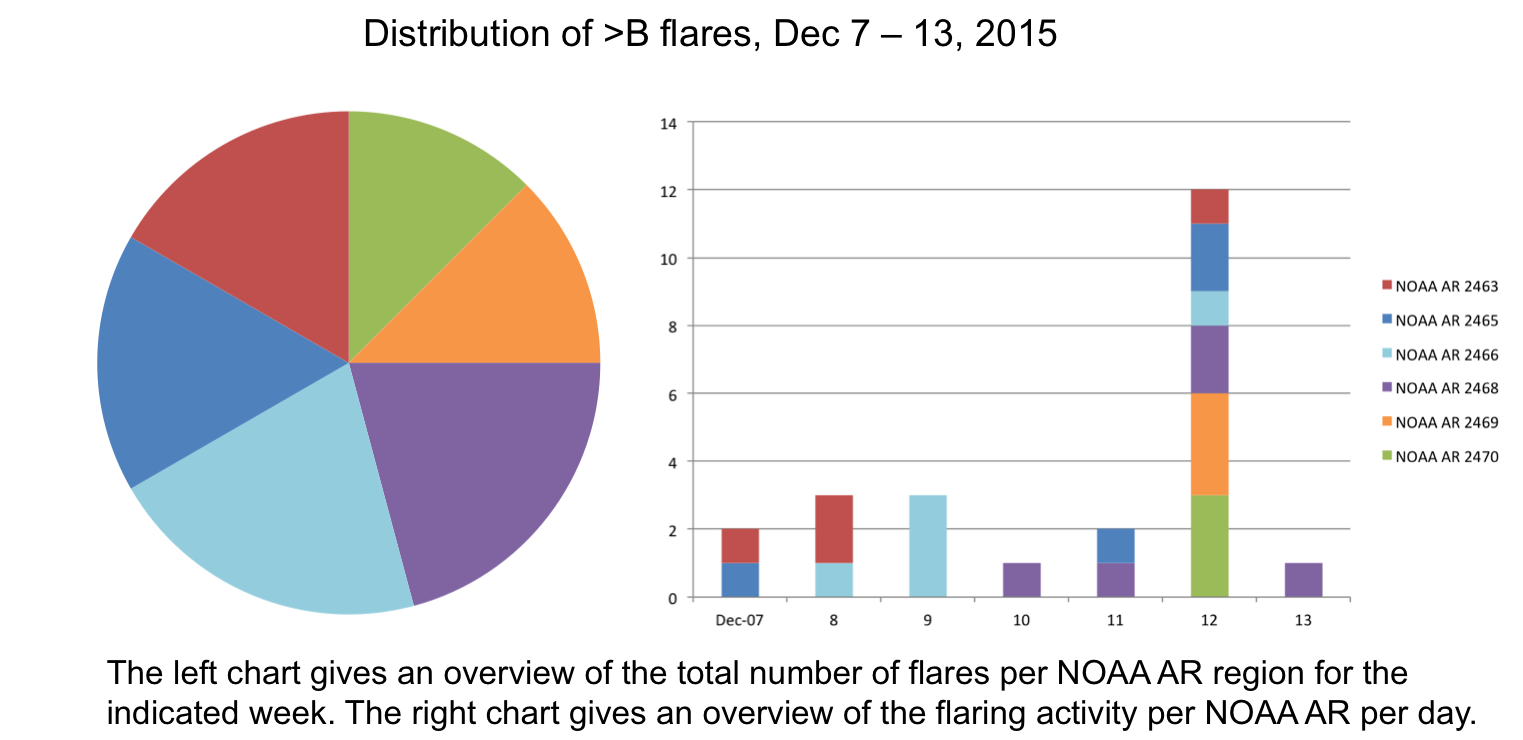
During this week 24 low C-class flares were observed by GOES. The strongest one was the C7.8 flare (peaking at 13:46 UT on December 12), which originated from the NOAA AR 2470, at that moment situated at the East solar limb. The flare was associated with rather narrow CME.
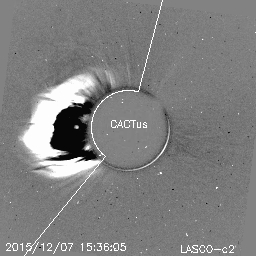
Only one wide CME was observed this week. The partial halo CME, first observed in the SOHO LASCO C2 field of view at 15:12 UT on December 07, had angular width of about 200 degrees and projected speed of about 800 km/s (as reported by CACTUS software). The CME was associated with the complex event at and just behind the East solar limb and was therefore not expected to arrive at the Earth.
The International Sunspot Number
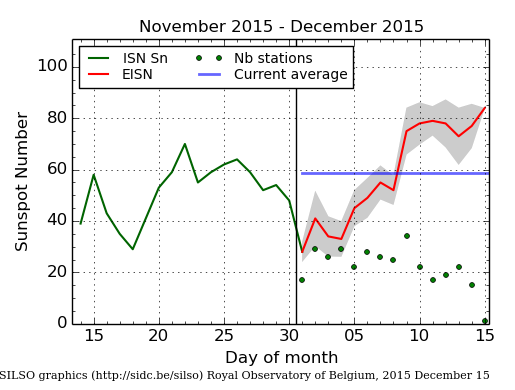
The daily Estimated International Sunspot Number (EISN, red curve with shaded error) derived by a simplified method from real-time data from the worldwide SILSO network. It extends the official Sunspot Number from the full processing of the preceding month (green line). The plot shows the last 30 days (~ one solar rotation). The horizontal blue line shows the current monthly average, while the green dots give the number of stations included in the calculation of the EISN for each day.
Review of geomagnetic activity
At the beginning of the week the Earth was inside of the fast solar wind (arrived on December 05), from the northern polar coronal hole with the large extend towards the low latitudes.
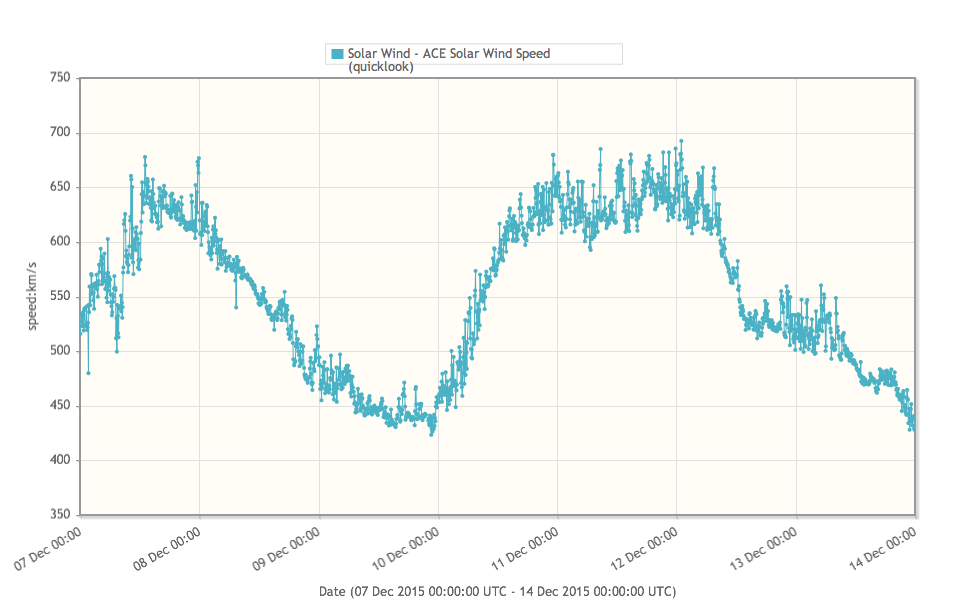
The solar wind speed reached the value of about 700 km/s on December 07, and then slowly decrease to about 400 km/s on December 09. The in situ data showed arrival of the compression region in front of the second fast flow observed this week, starting from about 22:00 UT on December 09. This fast flow was associated with the equatorial coronal hole (seemingly connected with the northern polar coronal hole) which reached the central meridian late on December 06. The maximum value of the solar wind speed was about 700 km/s, and it persisted from the early morning of December 11 until the morning of December 12.
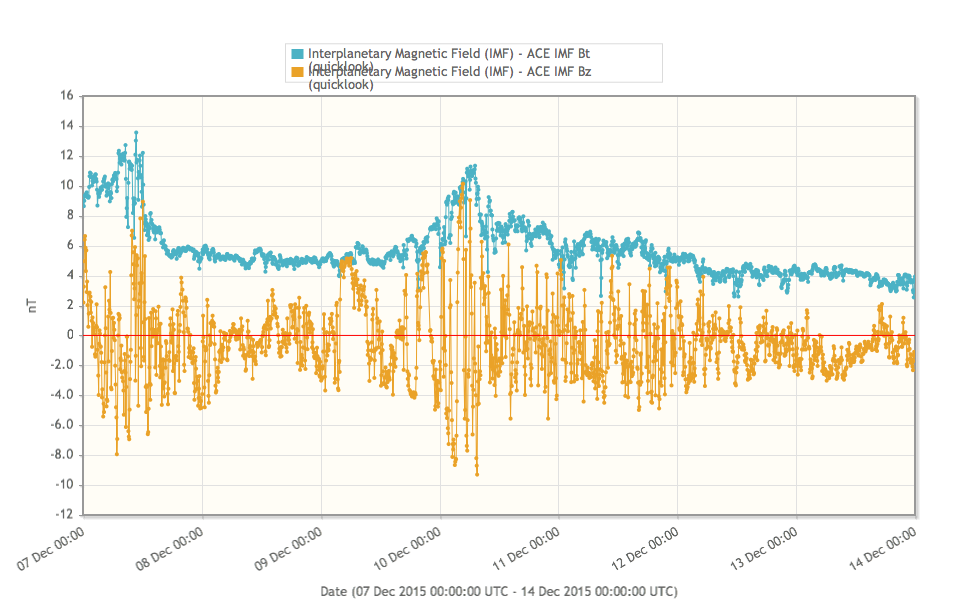
The interplanetary magnetic field magnitude was slightly elevated in the morning of December 07, and then again in the morning of December 10 (about 12 nT). During the rest of the week the interplanetary magnetic field magnitude was fluctuating between 8 and 4 nT, mostly having the value of about 6 nT.
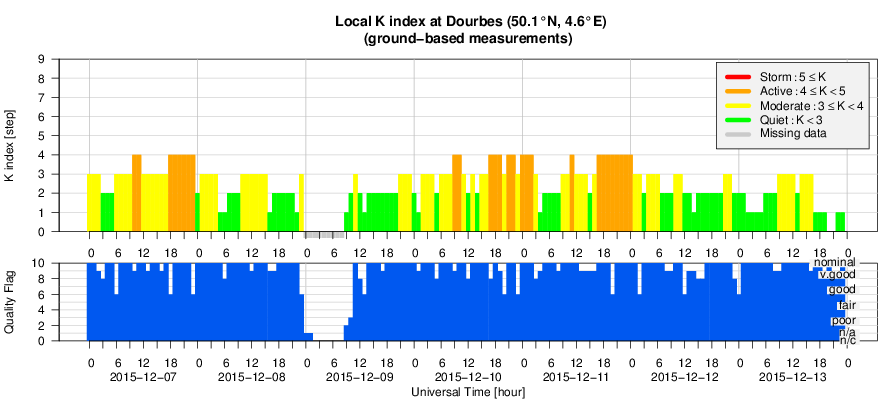
The geomagnetic conditions were mostly quiet to unsettled with some short and isolated intervals of active conditions (the local station at Dourbes reported values of K=4, and NOAA reported one interval of Kp=5).
Geomagnetic Observations at Dourbes (7 Dec 2015 - 13 Dec 2015)
Review of ionospheric activity (7 Dec 2015 - 13 Dec 2015)
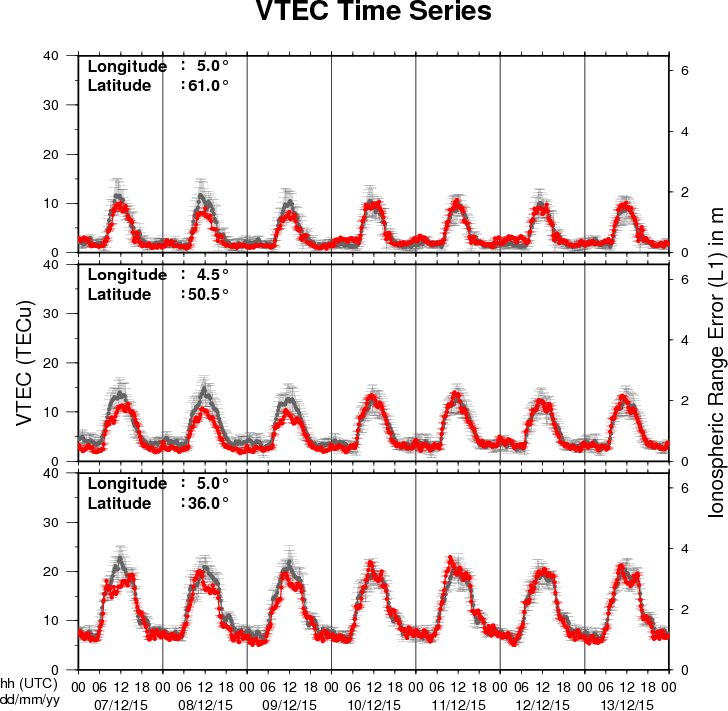
The figure shows the time evolution of the Vertical Total Electron Content (VTEC) (in red) during the last week at three locations:
a) in the northern part of Europe(N61°, 5°E)
b) above Brussels(N50.5°, 4.5°E)
c) in the southern part of Europe(N36°, 5°E)
This figure also shows (in grey) the normal ionospheric behaviour expected based on the median VTEC from the 15 previous days.
The VTEC is expressed in TECu (with TECu=10^16 electrons per square meter) and is directly related to the signal propagation delay due to the ionosphere (in figure: delay on GPS L1 frequency).
The Sun's radiation ionizes the Earth's upper atmosphere, the ionosphere, located from about 60km to 1000km above the Earth's surface.The ionization process in the ionosphere produces ions and free electrons. These electrons perturb the propagation of the GNSS (Global Navigation Satellite System) signals by inducing a so-called ionospheric delay.
See http://stce.be/newsletter/GNSS_final.pdf for some more explanations ; for detailed information, see http://gnss.be/ionosphere_tutorial.php
Future Events
For more details, see http://www.spaceweather.eu/en/event/future
COSPAR/ILWS workshop: science for space weather in Goa, India
Start : 2016-01-24 - End : 2016-01-29
Understanding and being able to forecast space weather is an
increasingly important aspect of our modern technology-reliant
society. This workshop will treat all aspects of space weather,
ranging from solar origins of transient events (CMEs, Flares, CIRs)
to their propagation through the heliosphere and effects on Earth
and planetary bodies, from particle energization to forecasting
particle environment and its effects on technological and
biological systems, as well as solar-cycle effects and coupling of
space weather to atmospheric response. Metrics to assess
predictions will also be discussed. The workshop is structured
along the lines of the COSPAR space weather pathways and will
include invited, contributed talks and posters, as well as panel
discussions and tutorials.
Website:
http://www.cessi.in/ssw/program.html
The Scientific Foundation of Space Weather
Start : 2016-06-27 - End : 2016-07-01
Website:
http://www.issibern.ch/program/workshops.html