- Table of Content
- 1.ESWW13 - Call ...
- 2.Review of sola...
- 3.The Internatio...
- 4.Geomagnetic Ob...
- 5.Review of iono...
- 6.Future Events
2. Review of solar and geomagnetic activity (14 Dec 2015 - 20 Dec 2015)
3. The International Sunspot Number
4. Geomagnetic Observations at Dourbes (14 Dec 2015 - 20 Dec 2015)
5. Review of ionospheric activity (14 Dec 2015 - 20 Dec 2015)
6. Future Events
ESWW13 - Call for sessions
European Space Weather Week 13
Belgium, November 2016
**** Call for Sessions *****
Dear colleagues,
Each year, during the European Space Weather Week conference, people from all over the world gather to discuss the newest insights in space weather and try to find appropriate answers to the challenges and threats that space weather imposes. Science, data exploitation, observations, service development, operational models, engineering, industrial challenges, etc. are all relevant aspects of space weather.
The strength of the conference is that the participants can contribute largely to its content leading to a rich and varied programme. Hereby, we invite you to submit proposals for sessions.
Session proposals can be submitted from January 15, 2016 onwards at http://www.stce.be/esww13/
The deadline for submission is February 5, 2016, included.
With kind regards
Mauro Messerotti and Petra Vanlommel, on behalf of the ESWW13 Programme Committee

Review of solar and geomagnetic activity (14 Dec 2015 - 20 Dec 2015)
Solar Activity
Solar activity was low during the week with twenty C flares to report, most of where produced in the last 2 days by an unnumbered region behind the East limb. NOAA AR 2468, 2469 and 2470 also released a few C flares.
A halo CME was first seen in LASCO C2 images at 9:24 UT on December 16. It was an asymmetric frontside full halo CME with bulk directed towards the ENE. LASCO C2 and C3 imagery provided an average plane of sky speed of 552 km/s. This CME was probably associated with the C6.6 flare released by NOAA AR 2468 with peak time 9:03 UT (which showed a dimming and a post eruption arcade as well). Another halo CME was first observed in LASCO C2 images at 14:24 UT on December 16. It was an asymmetric frontside full halo CME with bulk directed towards the SSE. LASCO C2 and C3 imagery provided an average plane of sky speed of 489 km/s. It was probably associated to a dual ribbon flaring of a filament channel near NOAA AR 2468 starting around 12:57 UT on December 16.
Geomagnetic activity
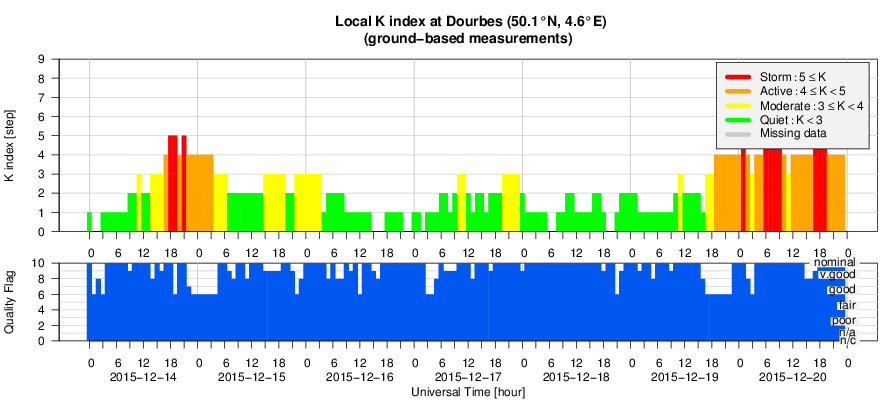
The arrival of an expected coronal hole high speed stream was registered by ACE around 18h UT on December 14, preceded by a Corotating Interaction Region which arrived around 12:30 UT. Solar wind speed increased from about 395 to 570 km/s, and further to a peak of about 650 km/s, while the magnitude of the Interplanetary Magnetic Field rose from 5 nT to a peak of 17 nT. There were several periods with Bz below -5 nT and even below -10 nT, resulting in NOAA Kp=5 at 15h and 21h UT on December 14, and at 0h on December 15. K Dourbes reached minor storm levels (=5) at 18h, 19h, and 21h UT on December 14, and at 5h UT on December 15.
ACE registered a shock in the solar wind at 15:27 UT on December 19. Solar wind speed jumped from 360 to 470 km/s, while the magnitude of the Interplanetary Magnetic Field jumped from 5.5 to 16 nT. This probably marked the arrival of the December 16 CMEs. After the arrival of the shock, the solar wind speed increased from 470 to a peak of 500 km/s, and then decreased to about 400 km/s. Meanwhile the magnitude of the Interplanetary Magnetic Field increased from 16 nT to about 20 nT. Bz has been below -10 nT between 2:30 and 7h UT on December 20 and from 13h UT till the end of December 20.
NOAA Kp values of at least 4 were registered from 15h UT on December 19 till the end of December 20, values of 5 or higher between 3h UT and the end of December 20, and Kp values of 6 at 3h UT and from 15h UT onwards on December 20. K Dourbes values of at least 4 were observed from 19h UT on December 19 till the end of December 20, with several minor storm (K Dourbes equals 5) and moderate storm (K Dourbes equals 6) intervals.
The International Sunspot Number

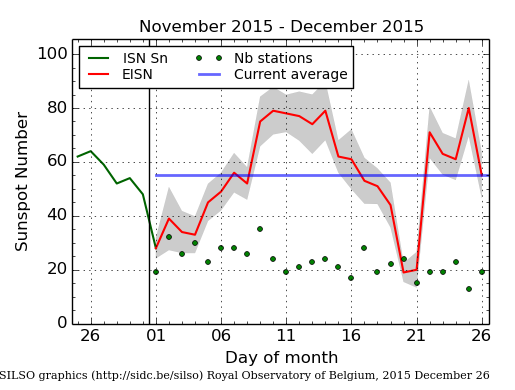
The daily Estimated International Sunspot Number (EISN, red curve with shaded error) derived by a simplified method from real-time data from the worldwide SILSO network. It extends the official Sunspot Number from the full processing of the preceding month (green line). The plot shows the last 30 days (~ one solar rotation). The horizontal blue line shows the current monthly average, while the green dots give the number of stations included in the calculation of the EISN for each day.
Review of ionospheric activity (14 Dec 2015 - 20 Dec 2015)

The figure shows the time evolution of the Vertical Total Electron Content (VTEC) (in red) during the last week at three locations:
a) in the northern part of Europe(N61°, 5°E)
b) above Brussels(N50.5°, 4.5°E)
c) in the southern part of Europe(N36°, 5°E)
This figure also shows (in grey) the normal ionospheric behaviour expected based on the median VTEC from the 15 previous days.
The VTEC is expressed in TECu (with TECu=10^16 electrons per square meter) and is directly related to the signal propagation delay due to the ionosphere (in figure: delay on GPS L1 frequency).
The Sun's radiation ionizes the Earth's upper atmosphere, the ionosphere, located from about 60km to 1000km above the Earth's surface.The ionization process in the ionosphere produces ions and free electrons. These electrons perturb the propagation of the GNSS (Global Navigation Satellite System) signals by inducing a so-called ionospheric delay.
See http://stce.be/newsletter/GNSS_final.pdf for some more explanations ; for detailed information, see http://gnss.be/ionosphere_tutorial.php
Future Events
For more details, see http://www.spaceweather.eu/en/event/future
COSPAR/ILWS workshop: science for space weather in Goa, India
Start : 2016-01-24 - End : 2016-01-29
Understanding and being able to forecast space weather is an
increasingly important aspect of our modern technology-reliant
society. This workshop will treat all aspects of space weather,
ranging from solar origins of transient events (CMEs, Flares, CIRs)
to their propagation through the heliosphere and effects on Earth
and planetary bodies, from particle energization to forecasting
particle environment and its effects on technological and
biological systems, as well as solar-cycle effects and coupling of
space weather to atmospheric response. Metrics to assess
predictions will also be discussed. The workshop is structured
along the lines of the COSPAR space weather pathways and will
include invited, contributed talks and posters, as well as panel
discussions and tutorials.
Website:
http://www.cessi.in/ssw/program.html
The Scientific Foundation of Space Weather
Start : 2016-06-27 - End : 2016-07-01
Website:
http://www.issibern.ch/program/workshops.html
