- Table of Content
- 1.NOAA 2494's gr...
- 2.Review of sola...
- 3.The Internatio...
- 4.PROBA2 Observa...
- 5.Review of geom...
- 6.Geomagnetic Ob...
- 7.Review of iono...
- 8.New documents ...
- 9.Future Events
2. Review of solar activity
3. The International Sunspot Number
4. PROBA2 Observations (1 Feb 2016 - 7 Feb 2016)
5. Review of geomagnetic activity
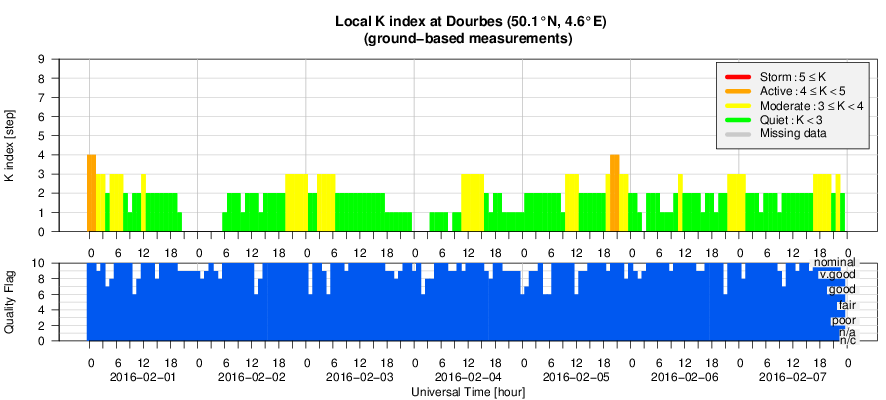
6. Geomagnetic Observations at Dourbes (1 Feb 2016 - 7 Feb 2016)
7. Review of ionospheric activity (1 Feb 2016 - 7 Feb 2016)
8. New documents in the European Space Weather Portal Repository
9. Future Events
NOAA 2494's growth spurt
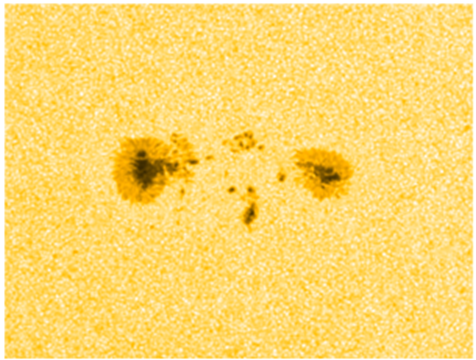
Once again, solar flaring activity has been pretty low. The strongest flare was a C5.1 peaking on 4 February at 18:22UT. The region responsible for this event was NOAA 2494, a sunspot group that was developing near the centre of the solar disk at that time. The region already reached its maximum sunspot area about a day later. It was always smaller than two times the total surface area of the Earth, so considerably smaller than e.g. NOAA 2192 (http://www.stce.be/news/280/welcome.html ). Moreover, it had a quite simple magnetic configuration, with only some polarity mixing in the middle portion and trailing main spot. The SDO (http://sdo.gsfc.nasa.gov/data/aiahmi/ ) white light image below dates from 05 February 2016 (07:41UT).
The movie at https://youtu.be/4Cq091yXS-0 shows this quick increase in sunspot area. It covers the time period from 03 till 08 February. The first clip is a full disk view, where NOAA 2494 can be seen quickly developing, then steadying before a gradual decline sets in as it transits the central part of the solar disk. The second clip shows a zoom of the sunspot group in white light. The last clip shows the magnetic evolution of the group. White denotes field lines coming out of the solar surface ("positive"), whereas black represents magnetic field lines returning to the solar interior ("negative").
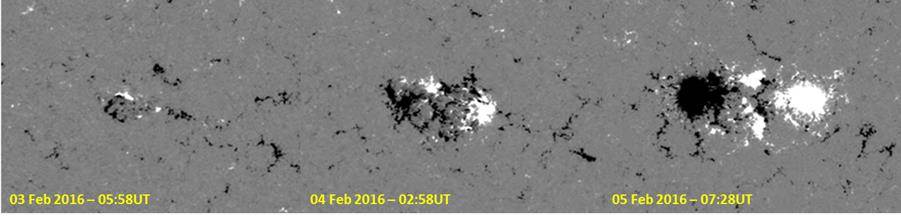
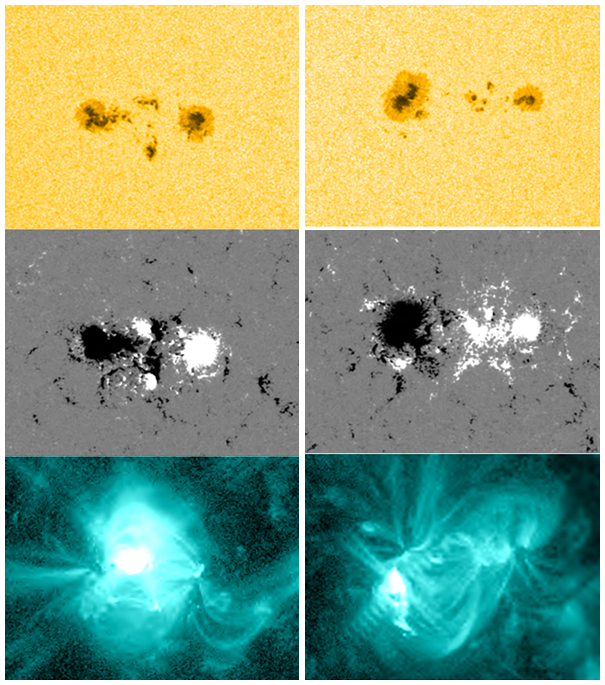
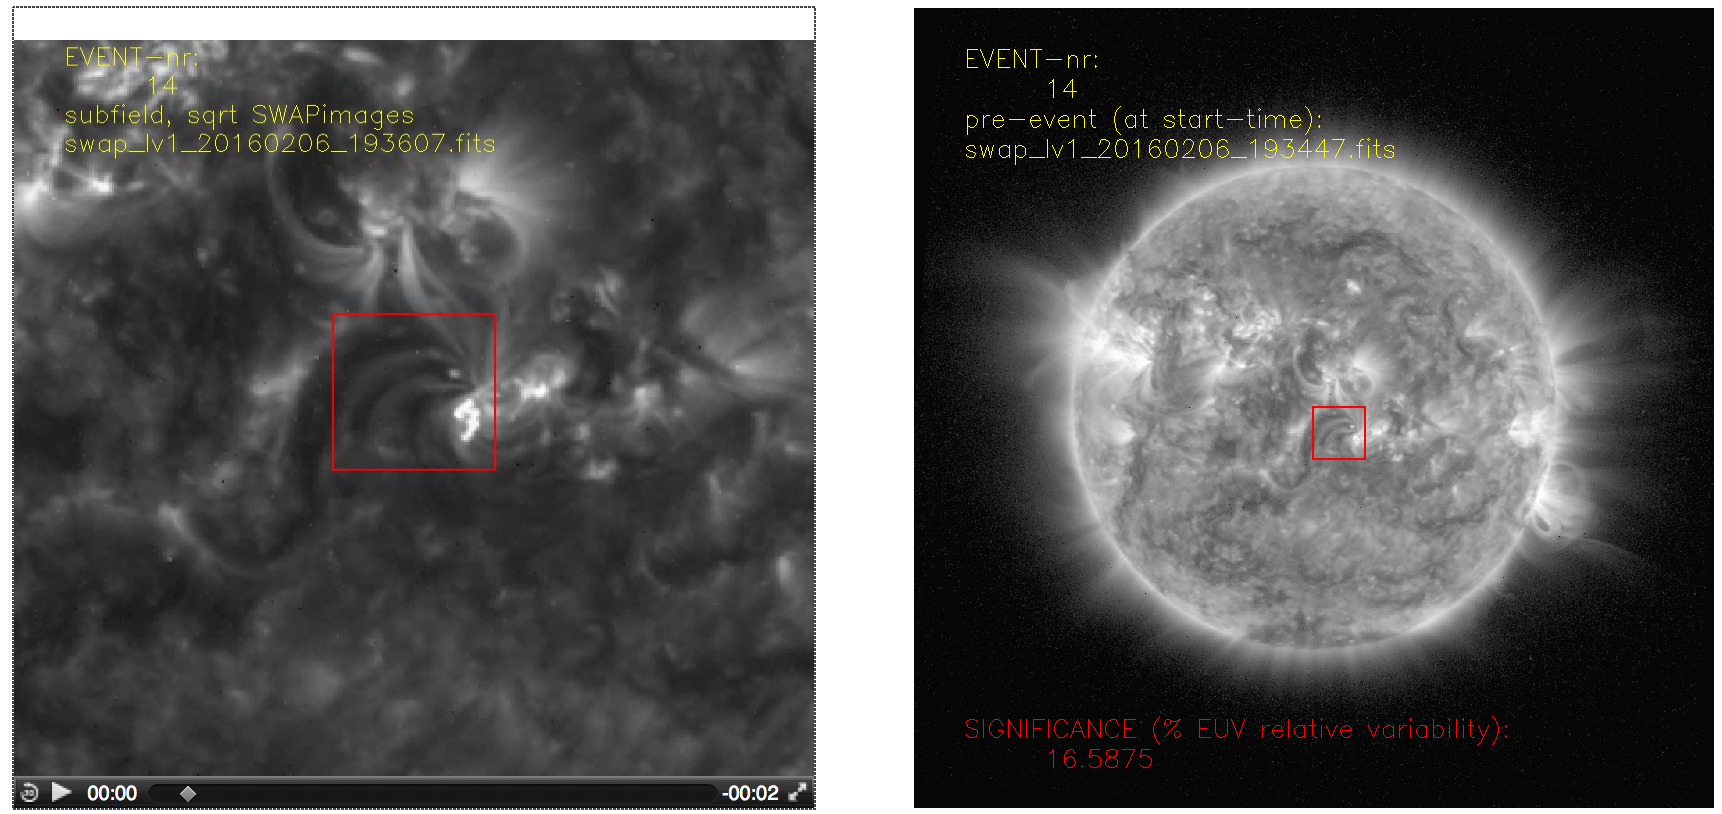
Note how initially (4-5 February), small patches of similar magnetic polarity are percolating ("clumping together") into mature sunspots (see Schatten 2007; http://iopscience.iop.org/article/10.1086/510367/pdf). This can also be seen in the images above. Low-level C-class flares occur where the newly formed sunspots of opposite polarity are close to each other. This is mostly in the middle and northern portion of the region. Starting on 6 February, positive magnetic flux can be seen emerging south of the main trailing negative spot. Correspondingly, flaring activity in NOAA 2494 shifted to the south of the trailing main spot, but only two C1 flares erupted from this location. This is illustrated by the images below showing the C5 eruption on 04 February (around 18:22UT; left), and the C1 eruption of 06 February (around 19:38UT; right), both in white light, the magnetogram, and in extreme ultraviolet around the time of maximum x-ray intensity.
Review of solar activity
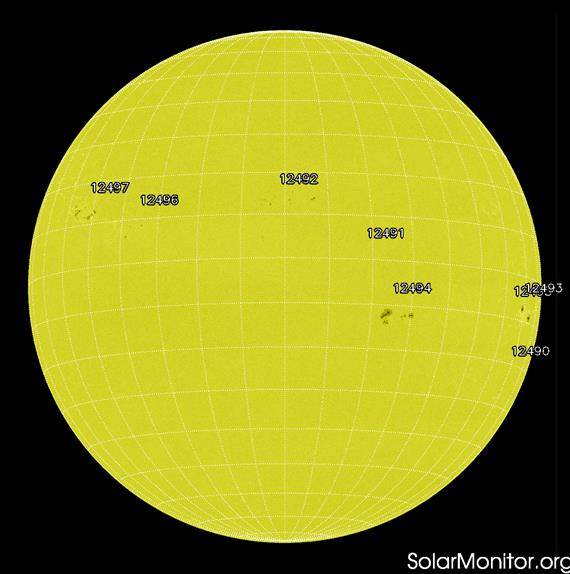
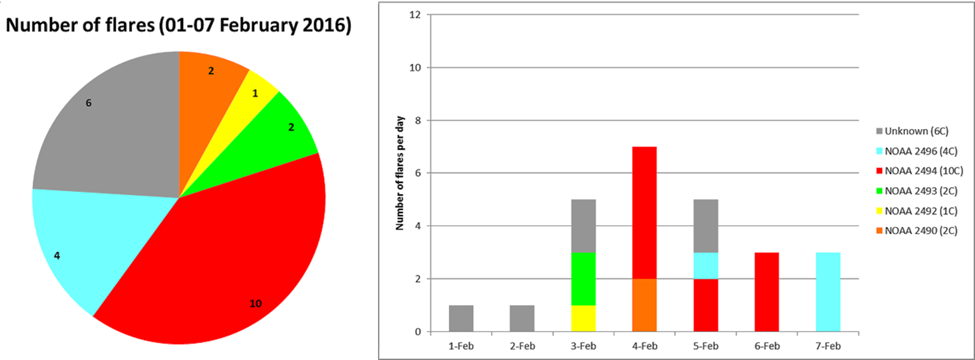
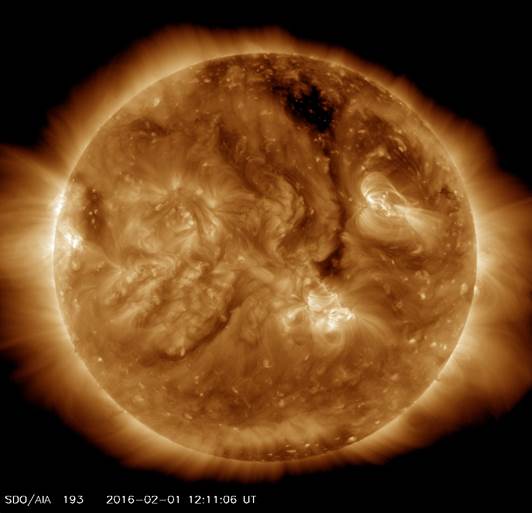
Solar activity was low during the entire week, with 25 C-class flares recorded. The strongest event was a C5.1 flare peaking on 4 February at 18:22UT. NOAA active region (AR) 2494 was the most complex group (beta-gamma-delta on 5 February). The image underneath shows the Sun's outlook on 7 February with the NOAA numbers of the active regions.
NOAA 2494 was also the most flare productive region. Other players were NOAA 2490, 2492, 2493, 2496 and 2497, which mainly had a beta classification. The graphs underneath show the number of flares per region, as well as on which day the sunspot group produced the C-class flares. The "unknown" events are C flares that could not be attributed to an active region, mainly because the event occurred behind the solar limb or was related to a filament eruption.
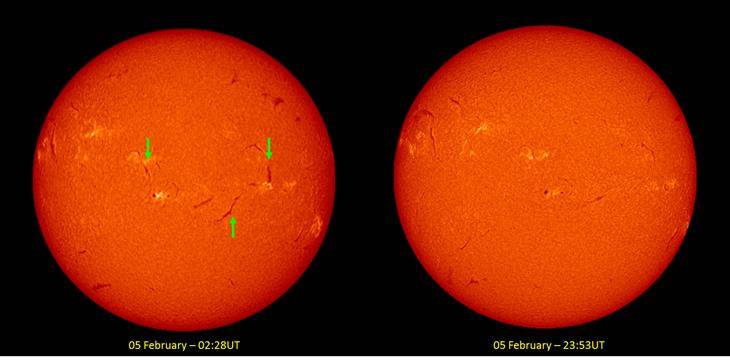
Several filament eruptions (at least five) occurred during the week and three of them happened on 5 February. One of these (observed at 19:30-20:00UT) resulted in a coronal mass ejection (CME) with potentially an earth-directed component. The arrival at Earth is expected on 9 February. All other CME activity was too faint or directed away from the Sun-Earth line. The picture below shows the Sun in H-alpha, an absorption line in the red part of the solar spectrum. It compares the Sun's outlook early (left) and late (right) on 5 February. The three erupting filaments have been indicated by green arrows. Also a part of the filament near the northwest limb has disappeared.
The International Sunspot Number
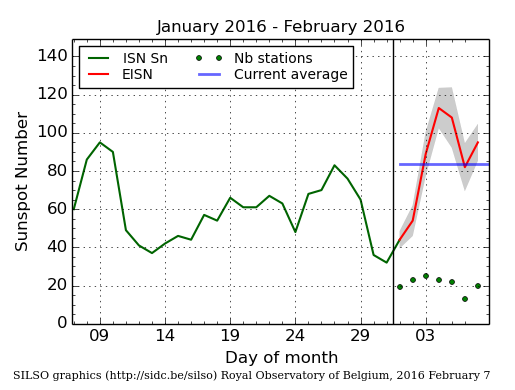
The daily Estimated International Sunspot Number (EISN, red curve with shaded error) derived by a simplified method from real-time data from the worldwide SILSO network. It extends the official Sunspot Number from the full processing of the preceding month (green line). The plot shows the last 30 days (about one solar rotation). The horizontal blue line shows the current monthly average, while the green dots give the number of stations included in the calculation of the EISN for each day.
PROBA2 Observations (1 Feb 2016 - 7 Feb 2016)
Solar Activity
Solar flare activity was low during the week.
In order to view the activity of this week in more detail, we suggest to go to the following website from which all the daily (normal and difference) movies can be accessed: http://proba2.oma.be/ssa
This page also lists the recorded flaring events.
A weekly overview movie can be found here: http://proba2.sidc.be/swap/data/mpg/movies/weekly_movies/weekly_movie_2016_02_01.mp4 (SWAP week 306).
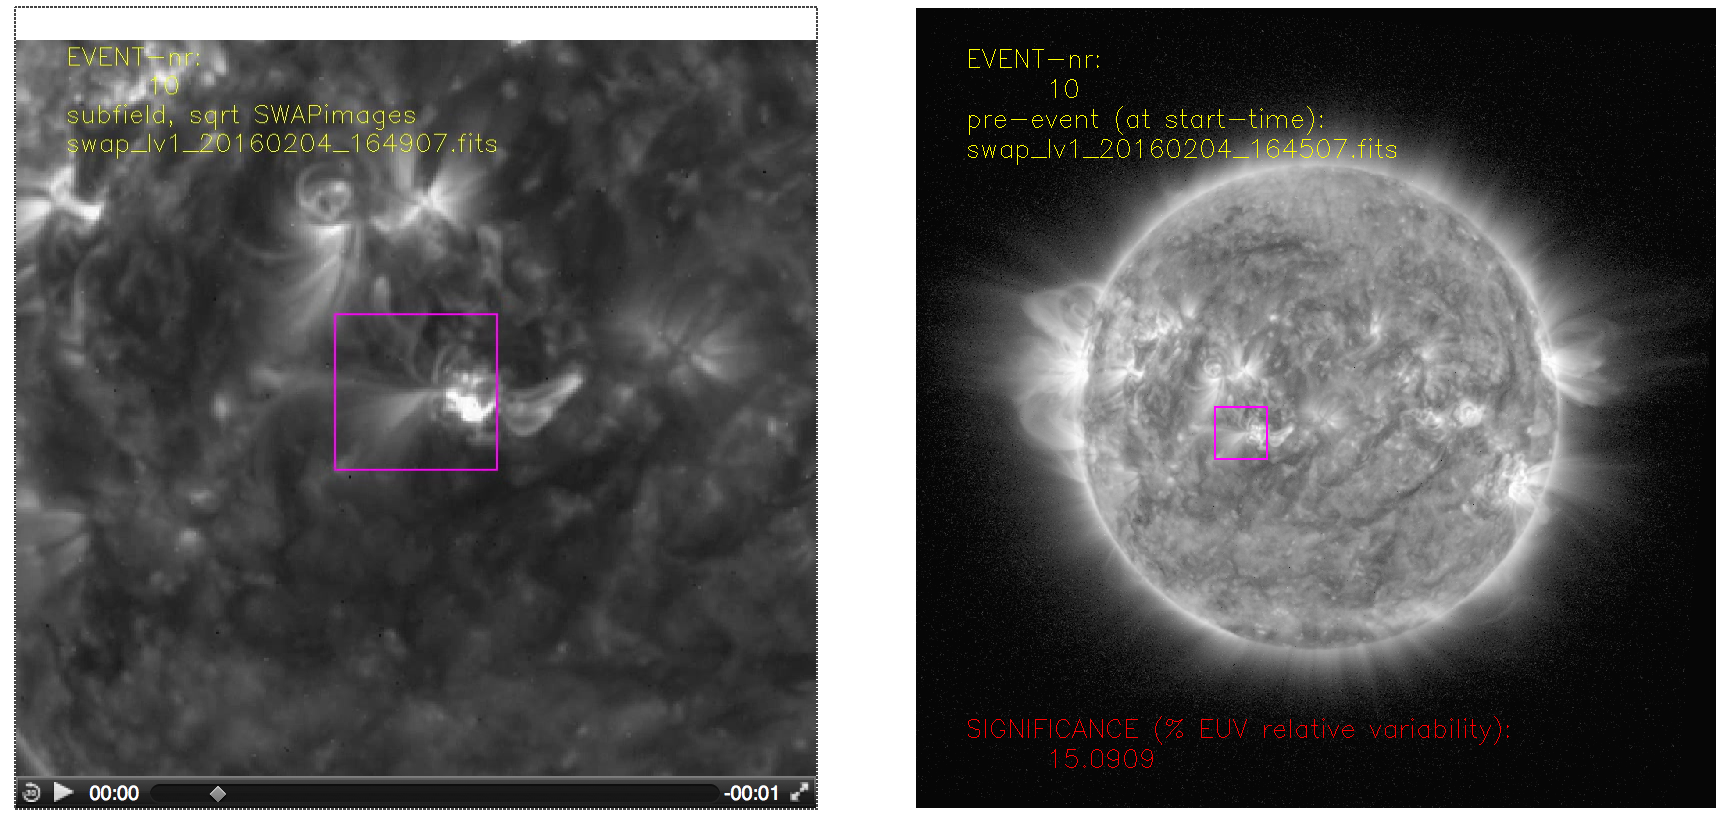
We did not observe any M or X-class flares this week, but many C-class flares. NOAA Active Region (AR) 2494 was the most productive one, producing a series of C-class flares between the fourth and sixth of February 2016. Below we provide SWAP images showing examples of solar activity observed from this region.
The annotated snapshots are produced by the Solar Feature Automated Search Tool (SoFAST). This tool detects dynamic solar events in EUV images from SWAP in near real-time. The snapshots illustrate the location of the flare on the solar disk (right) and a zoomed image (left).
The complete SoFAST online event list and additional plots are available at: http://www.sidc.be/sofast.
2016-Feb-04, AR 2494: C3.6 peaking around 16:49 UT
A movie of the event can be found here: http://proba2.sidc.be/swap/data/mpg/movies/20160204_swap_movie.mp4
2016-Feb-05, AR 2494: C2.9 peaking around 07:22 UT

A movie of the event can be found here: http://proba2.sidc.be/swap/data/mpg/movies/20160205_swap_movie.mp4
2016-Feb-06, AR 2494: C1.0 peaking around 19:38 UT
A movie of the event can be found here: http://proba2.sidc.be/swap/data/mpg/movies/20160206_swap_movie.mp4
Review of geomagnetic activity
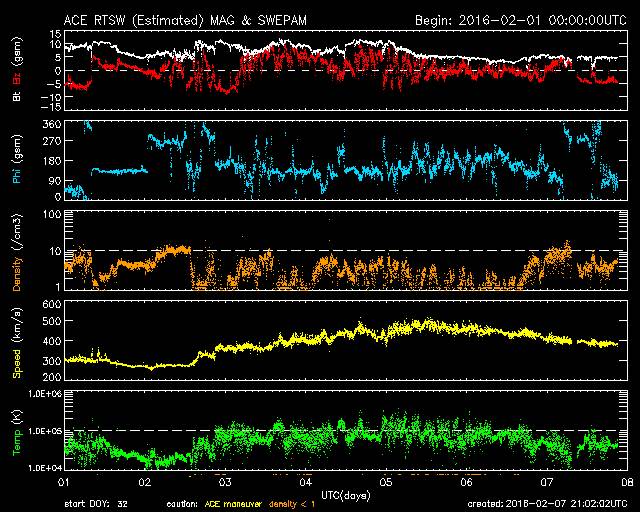
The solar wind speed started low, but increased gradually to around 500 km/s due to the influence of a co-rotating interaction region (CIR) followed by a stream emanating from a low-latitude extension of a polar coronal hole from 3 February onwards. The magnitude of the magnetic field did not exceed a value of 11 nT. Starting around 5 February, the solar wind returned back to normal conditions. Geomagnetic conditions were quiet to unsettled for most of the week, except for a few time slots of active levels on 3 February (estimated NOAA Kp) and on 5 February (local K at Dourbes), related to a period of negative Bz.
The image underneath shows the position and size of the extension of the northern polar coronal hole on 1 February. The subsequent graph shows the typical solar wind parameters as recorded by the ACE satellite. Bz, density, speed, and temperature are represented by the red, orange, yellow and green data points.
Geomagnetic Observations at Dourbes (1 Feb 2016 - 7 Feb 2016)
Review of ionospheric activity (1 Feb 2016 - 7 Feb 2016)
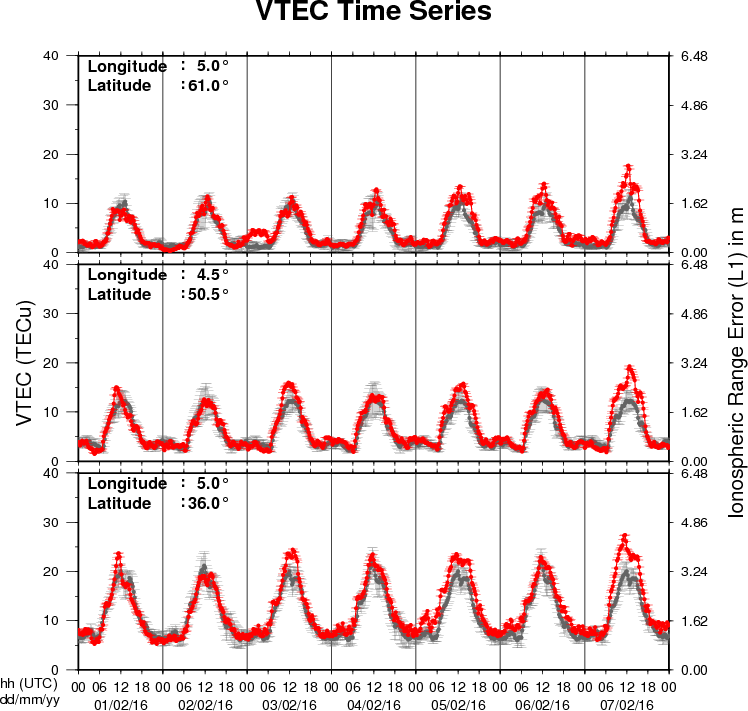
The figure shows the time evolution of the Vertical Total Electron Content (VTEC) (in red) during the last week at three locations:
a) in the northern part of Europe(N61°, 5°E)
b) above Brussels(N50.5°, 4.5°E)
c) in the southern part of Europe(N36°, 5°E)
This figure also shows (in grey) the normal ionospheric behaviour expected based on the median VTEC from the 15 previous days.
The VTEC is expressed in TECu (with TECu=10^16 electrons per square meter) and is directly related to the signal propagation delay due to the ionosphere (in figure: delay on GPS L1 frequency).
The Sun's radiation ionizes the Earth's upper atmosphere, the ionosphere, located from about 60km to 1000km above the Earth's surface.The ionization process in the ionosphere produces ions and free electrons. These electrons perturb the propagation of the GNSS (Global Navigation Satellite System) signals by inducing a so-called ionospheric delay.
See http://stce.be/newsletter/GNSS_final.pdf for some more explanations ; for detailed information, see http://gnss.be/ionosphere_tutorial.php
New documents in the European Space Weather Portal Repository
See http://www.spaceweather.eu/en/repository
eHEROES - Final Report
The final report of the FP7 project eHEROES, Environment for Human Exploration and RObotic Experimentation in Space.
http://www.spaceweather.eu/en/repository/show?id=598
Future Events
For more details, see http://www.spaceweather.eu/en/event/future
The Scientific Foundation of Space Weather
Start : 2016-06-27 - End : 2016-07-01
Website:
http://www.issibern.ch/program/workshops.html