- Table of Content
- 1.A sunspot acci...
- 2.PROBA2: Sevent...
- 3.PROBA2 Observa...
- 4.Review of sola...
- 5.The Internatio...
- 6.Noticeable Sol...
- 7.Review of geom...
- 8.Geomagnetic Ob...
- 9.Review of iono...
- 10.Future Events
2. PROBA2: Seventh Call for Guest Investigators
3. PROBA2 Observations (8 Feb 2016 - 14 Feb 2016)
4. Review of solar activity
5. The International Sunspot Number
6. Noticeable Solar Events (8 Feb 2016 - 14 Feb 2016)
7. Review of geomagnetic activity
8. Geomagnetic Observations at Dourbes (8 Feb 2016 - 14 Feb 2016)
9. Review of ionospheric activity (8 Feb 2016 - 14 Feb 2016)
10. Future Events
A sunspot accident!
Once more, two sunspot groups have collided with each other. Indeed, NOAA 2497 was minding its own business when, starting on 11 February, the trailing part of a smaller sunspot group suddenly emerged right in front (to the west; "right") of it. It was unavoidable that the leading part of NOAA 2497 would bump into the trailing part of this new magnetic bipolar region, and it was easy for the space weather forecasters to predict that these developments could result in the production of low-level M-class ("medium") solar flares. In fact, whereas the region was relatively quiet until about 10 February, it produced one M-class flare every day starting 12 February.
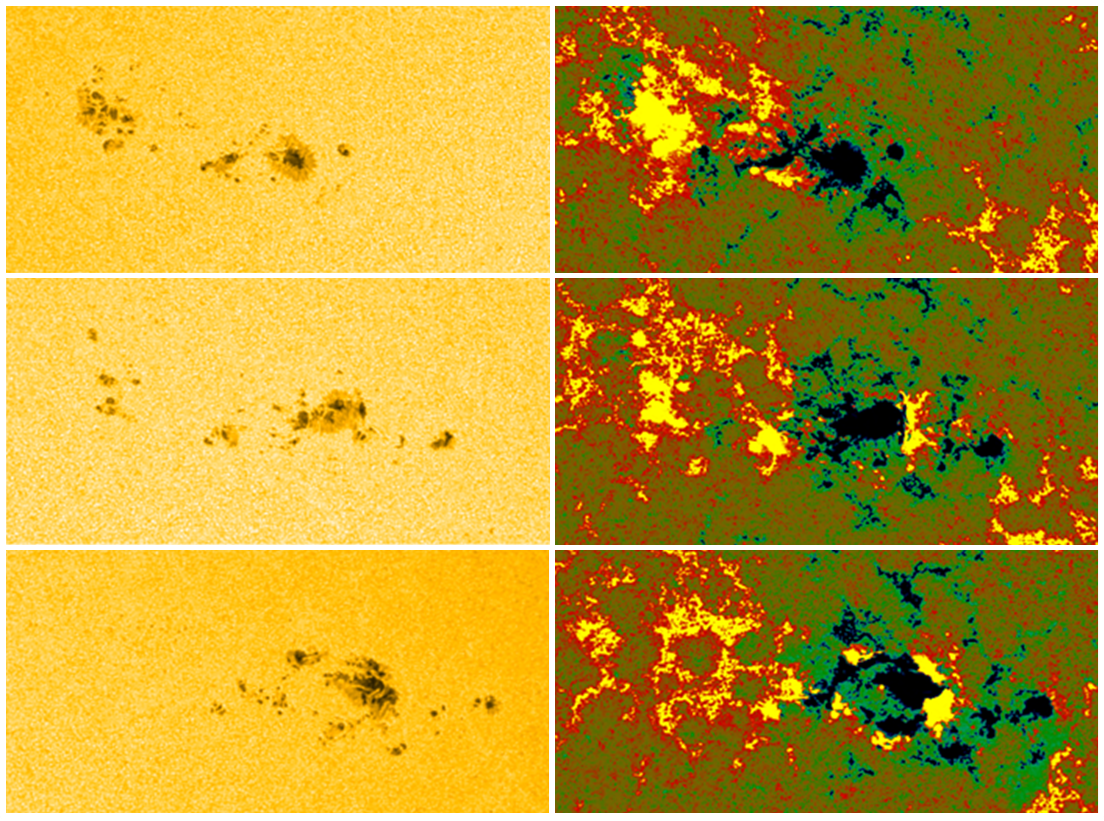
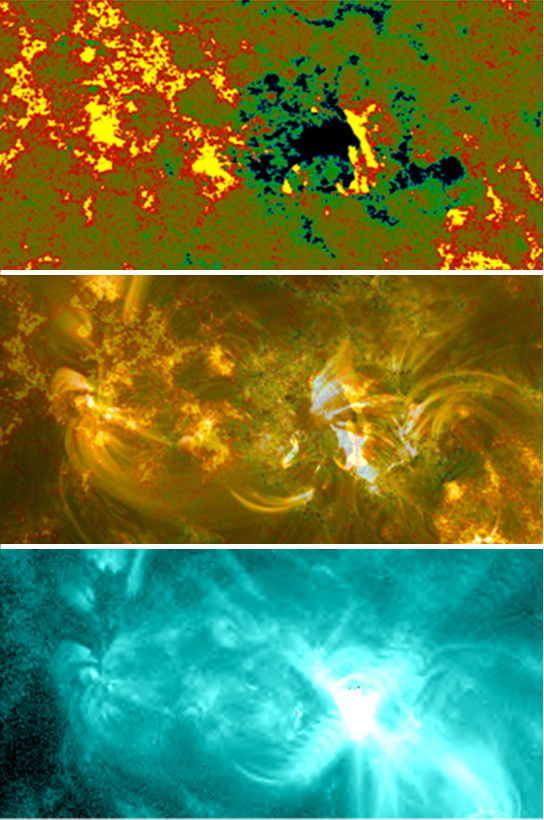
The picture above shows the area in white light (left column) and the corresponding magnetogram (right column), as seen with the SDO/HMI instrument (http://sdo.gsfc.nasa.gov/). The dates are 10 February (around 00:00UT; top), 12 February (around 00:00UT; middle), and 14 February (around 00:00UT; bottom). In the magnetogram, the yellow and red colors represent positive magnetic polarity (magnetic field lines coming out of the solar surface), whereas the green and blue colors are used for negative polarity (magnetic field returning into the solar surface). As the positive, trailing part of the new region drapes itself around NOAA 2497's main leading spot, a very complex sunspot structure is created with several delta's (spots of opposite magnetic polarity within the same penumbra; see e.g. http://www.stce.be/news/222/welcome.html). This intensified the solar flare activity, with an increasing number of C-class flares and an M1 flare on 12 (10:47UT), 13 (15:24UT) and 14 (19:26UT) February. These flares took mostly place near the locations of opposite polarity. This can be seen in the picture underneath of the first M1 flare, with the magnetogram (11:52UT; top), an SDO image in extreme ultraviolet (EUV) overlaid on the magnetogram (10:52UT; middle), and another SDO EUV/magnetogram combo but at a temperature of several million degrees (10:49UT, bottom).
The movie at https://youtu.be/45a1eyvPELQ shows the evolution in white light, the magnetogram, and the combined white-light and magnetogram clip from 10 till 14 February. The EUV-magnetogram clips cover the period from 12 till 14 February. It seems that lawmakers and insurance companies could really have a good time with all those reckless sunspot groups (see e.g. also this news item at http://www.stce.be/news/320/welcome.html for more examples).
PROBA2: Seventh Call for Guest Investigators
The PROBA2 team welcomes research proposals for the seventh round of its Guest Investigator program for research based on SWAP and LYRA data analysis by scientists outside the SWAP and LYRA PI-teams. We encourage in particular young post-docs and PhD students to apply, although more senior guest investigators’ proposals are welcome also. In this round we anticipate funding for around six guest investigators or teams who will visit the PROBA2 Science Center at the Royal Observatory of Belgium, in Brussels, between April 2016 and December 2016.
Selected proposers will be invited to spend a few weeks with the PI teams to obtain expert knowledge on the instruments, to participate in the daily commanding of the SWAP and LYRA instruments according to the needs of their data analysis proposal, and to conduct their research. Guest investigators may be reimbursed for travel, accommodation and living expenses up to a maximum of 5000 euro. Limited support to present the results at an international conference (during the visit at P2SC) can also be considered.
During the selection process, special consideration will be given to young scientists and PhD students, collaborative research teams with members from more than one research institute (funding above the 5000 euro level may be approved for such teams), and to proposals addressing research topics to which SWAP and LYRA are particularly well-suited.
More details about the application process can be found here: proba2.oma.be/SeventhGICall
or by emailing swap_lyra@oma.be
Deadline: Proposals must be received by March 18, 2016
Seize the opportunity!
PROBA2 Observations (8 Feb 2016 - 14 Feb 2016)
Solar Activity
Solar flare activity fluctuated between low and moderate during the week.
In order to view the activity of this week in more detail, we suggest to go to the following website from which all the daily (normal and difference) movies can be accessed:
http://proba2.oma.be/ssa
This page also lists the recorded flaring events.
A weekly overview movie can be found here (SWAP week 307).
http://proba2.oma.be/swap/data/mpg/movies/weekly_movies/weekly_movie_2016_02_08.mp4
Details about some of this week’s events, can be found further below.
Monday Feb 08
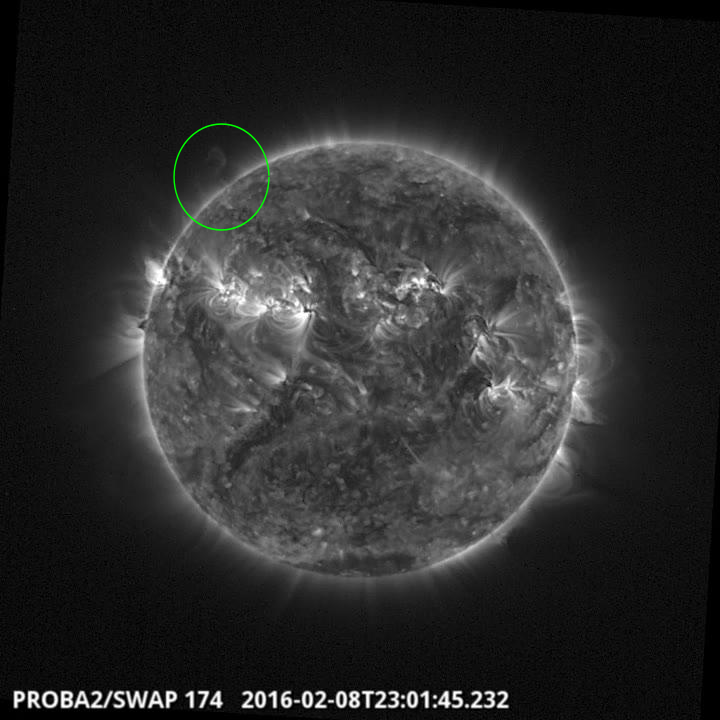
There was an eruption observed by SWAP in the North East at 23:01 UT on 08Feb2016
Find a movie of the events here (SWAP movie)
http://proba2.oma.be/swap/data/mpg/movies/20160208_swap_movie.mp4
Tuesday Feb 09
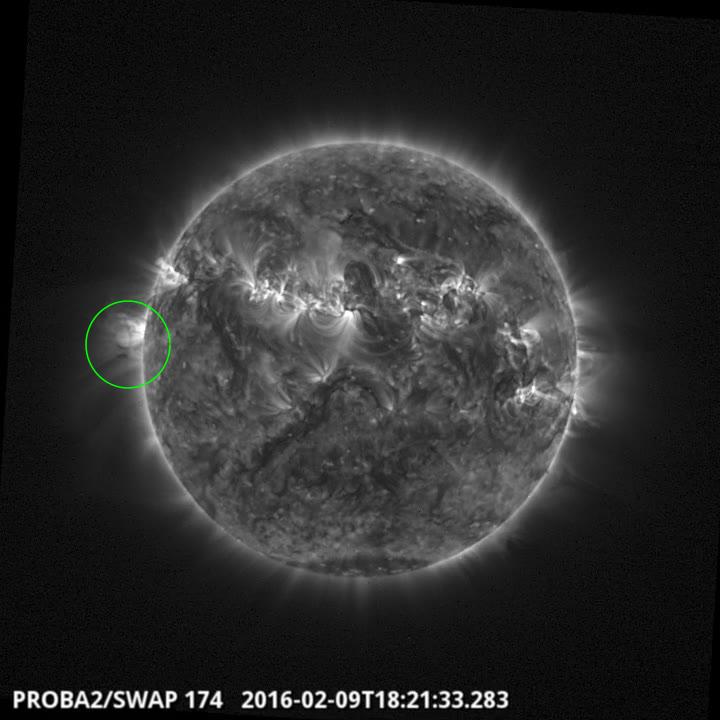
There was a filament eruption observed by SWAP on the East limb at 18:21 UT
Find a movie of the events here (SWAP movie)
http://proba2.oma.be/swap/data/mpg/movies/20160209_swap_movie.mp4
Thursday Feb 11
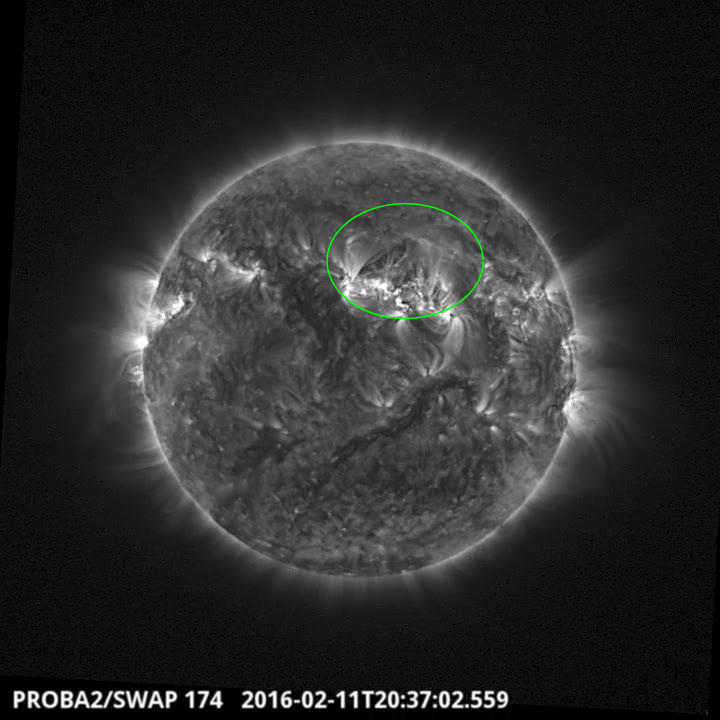
There was an eruption observed by SWAP near solar disk centre at 20:37 UT
Find a movie of the event here (SWAP movie)
http://proba2.oma.be/swap/data/mpg/movies/20160211_swap_movie.mp4
Friday Feb 12
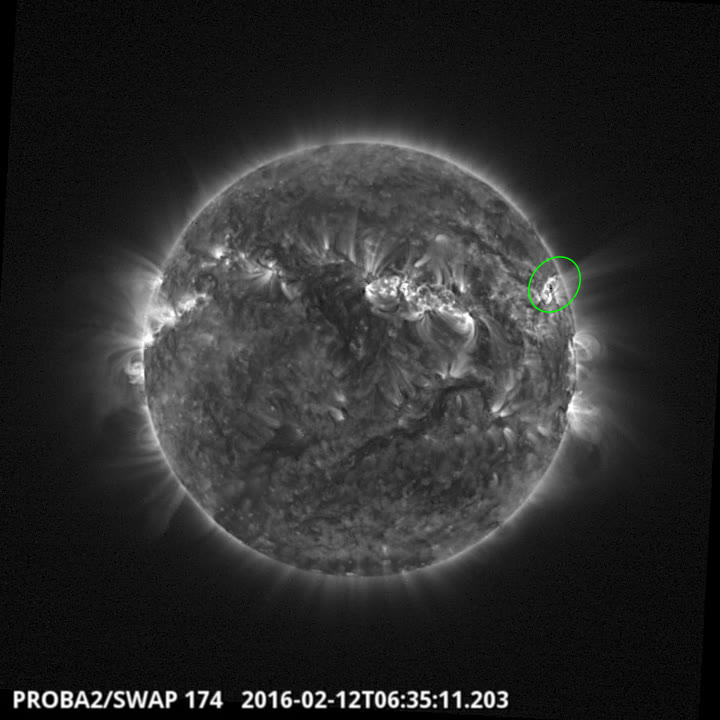
There was an eruption observed by SWAP in the North West at 06:35 UT
Find a movie of the event here(SWAP movie)
http://proba2.oma.be/swap/data/mpg/movies/20160212_swap_movie.mp4
Saturday Feb 13
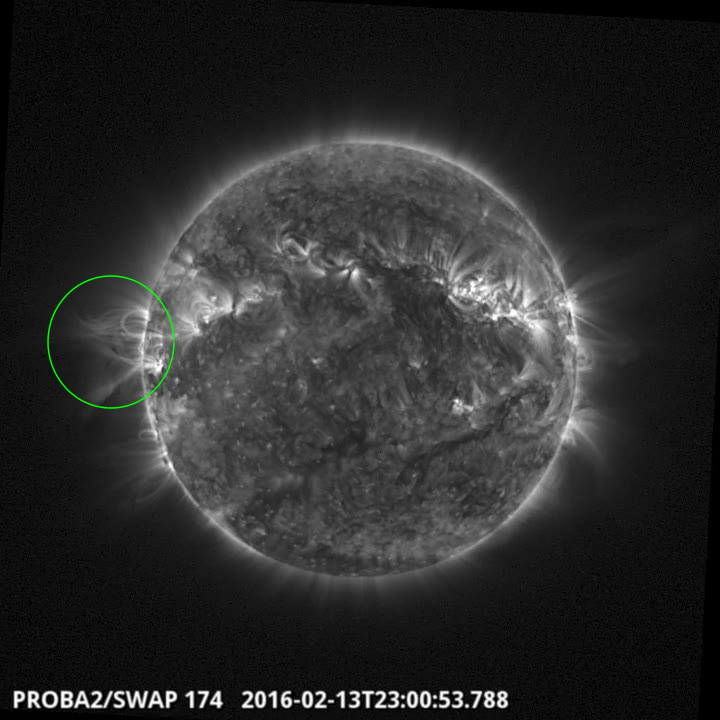
There was an eruption observed by SWAP on the East limb at 23:00 UT
Find a movie of the event here (SWAP movie)
http://proba2.oma.be/swap/data/mpg/movies/20160213_swap_movie.mp4
Review of solar activity
Flares
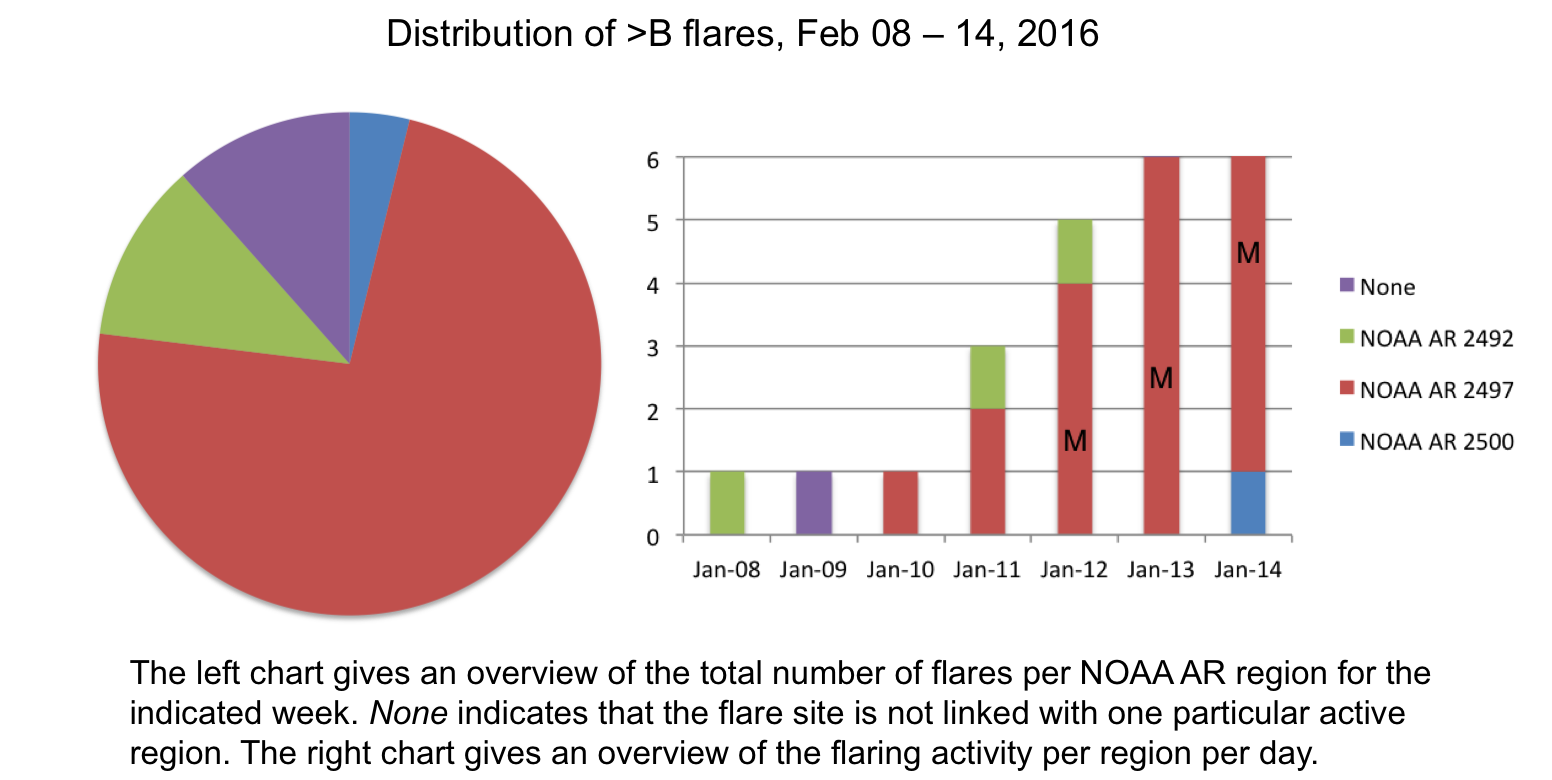
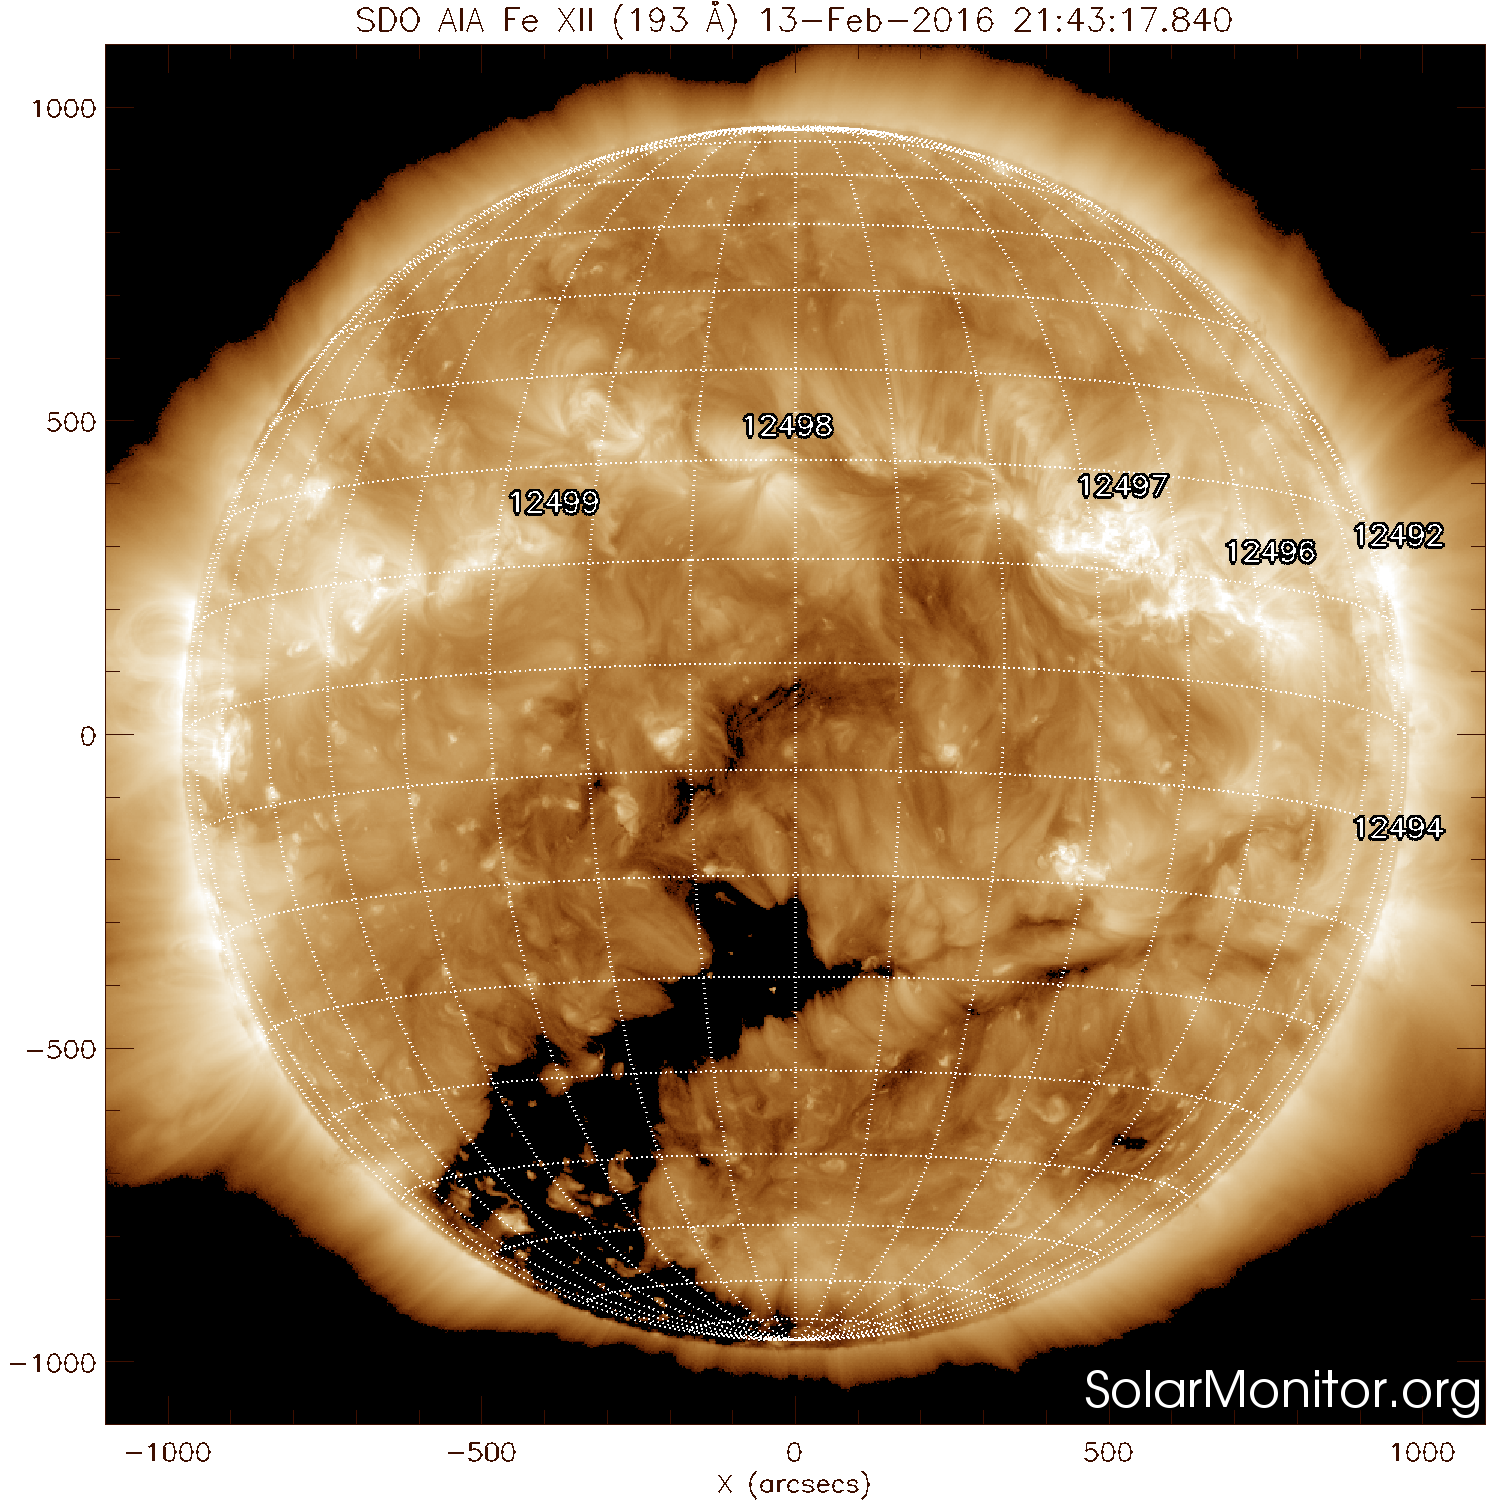
Nine active regions were observed on the Sun during the week, with NOAA AR numbers 2492, 2494, 2495, 2496, 2497, 2498, 2499, 2500, and 2501. The flaring activity was dominated by the NOAA AR 2497 that produced three M-class flares and numerous C-flares. The strongest flare of the week was the M1.8 flare peaking at 15:24 UT on February 13.
Coronal Mass Ejection
The C8.9 flare peaking at 21:03 UT on February 11 in the NOAA AR 2497 was accompanied by a coronal dimming, an EIT wave, and a post-eruption arcade observed by SDO/AIA. The associated partial halo CME (angular width around 290 degrees) first appeared in the SOHO/LASCO C2 field of view at 21:28 UT and had the projected plane-of-the-sky speed of around 670 km/s. This CME was not geo-effective.
Coronal Hole
A low-latitude extension of the southern polar coronal hole reached the solar central meridian on February 13. The associated fast solar wind steam is expected to arrive at the Earth on February 16.
The International Sunspot Number
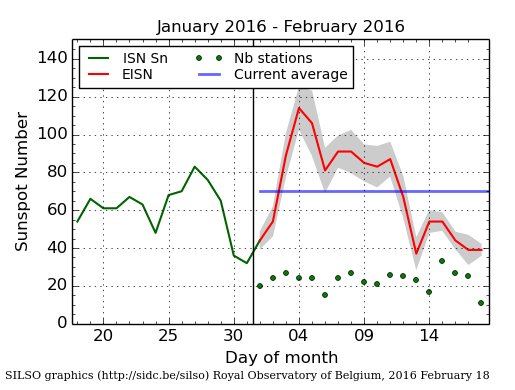
The daily Estimated International Sunspot Number (EISN, red curve with shaded error) derived by a simplified method from real-time data from the worldwide SILSO network. It extends the official Sunspot Number from the full processing of the preceding month (green line). The plot shows the last 30 days (about one solar rotation). The horizontal blue line shows the current monthly average, while the green dots give the number of stations included in the calculation of the EISN for each day.
Noticeable Solar Events (8 Feb 2016 - 14 Feb 2016)
| DAY | BEGIN | MAX | END | LOC | XRAY | OP | 10CM | TYPE | Cat | NOAA |
| 12 | 1036 | 1047 | 1053 | M1.0 | 2497 | |||||
| 13 | 1516 | 1524 | 1526 | N13W25 | M1.8 | 1B | 2497 | |||
| 14 | 1918 | 1926 | 1929 | N15W47 | M1.0 | SF | 2497 |
| LOC: approximate heliographic location | TYPE: radio burst type |
| XRAY: X-ray flare class | Cat: Catania sunspot group number |
| OP: optical flare class | NOAA: NOAA active region number |
| 10CM: peak 10 cm radio flux |
Review of geomagnetic activity
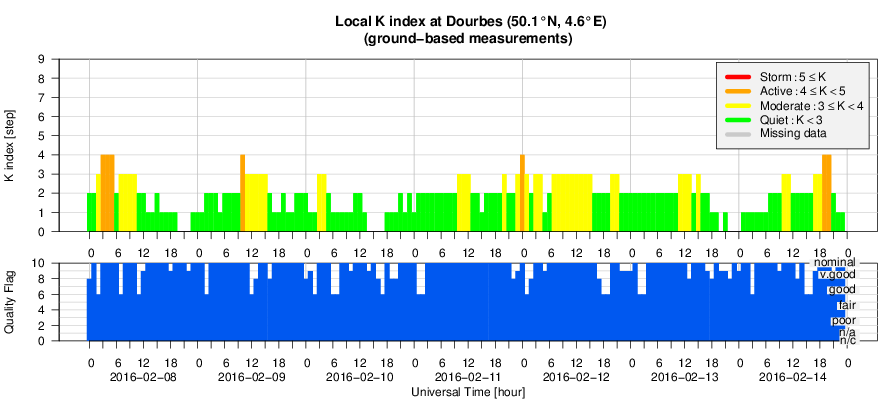
In the beginning of the week, the Earth was inside a slow solar wind flow. On February 8 one minor storm interval was reported by NOAA (Kp =5) in response to a prolonged interval of southward interplanetary magnetic field (IMF) with slightly elevated magnitude that started the day before. Dourbes reported values up to K = 4 on that day. One more interval of Kp = 4 was reported by NOAA on February 9 in response to a short interval with an elevated IMF magnitude.
An Interplanetary Coronal Mass Ejection
On February 11 the Earth has entered an ICME, probably associated with a delayed arrival of the CME observed on the Sun late on February 5. The IMF magnitude reached 20 nT on February 12, but only a small part of the ICME carried the southward IMF component. Due to low solar wind speed, only occasional intervals of active geomagnetic conditions (K = 4 and Kp = 4) were reported by Dourbes, IZMIRAN, and NOAA. From February 13 on, the Earth was again inside a slow solar wind flow, and the geomagnetic conditions were on the quiet to unsettled level, with only one interval of K = 4 reported by IZMIRAN on February 14.
Geomagnetic Observations at Dourbes (8 Feb 2016 - 14 Feb 2016)
Review of ionospheric activity (8 Feb 2016 - 14 Feb 2016)
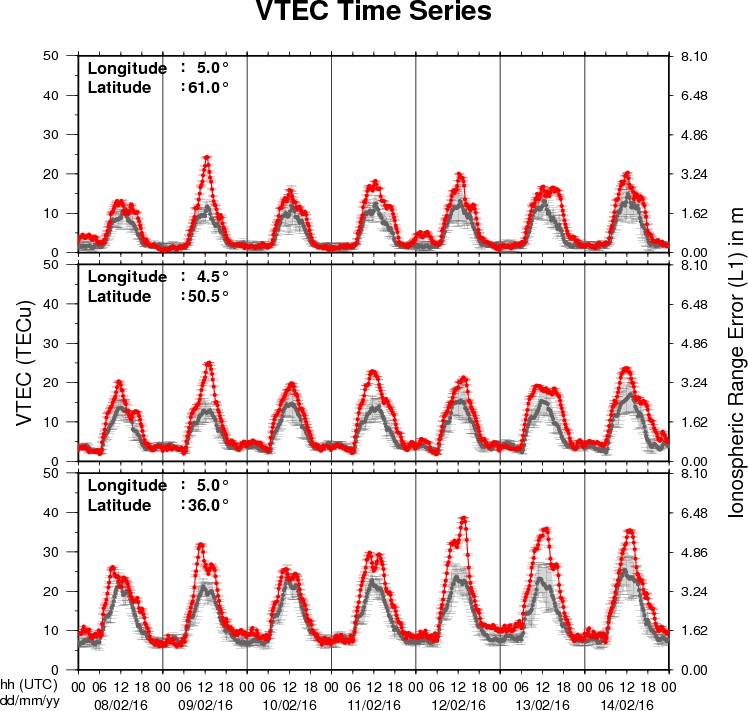
The figure shows the time evolution of the Vertical Total Electron Content (VTEC) (in red) during the last week at three locations:
a) in the northern part of Europe(N61°, 5°E)
b) above Brussels(N50.5°, 4.5°E)
c) in the southern part of Europe(N36°, 5°E)
This figure also shows (in grey) the normal ionospheric behaviour expected based on the median VTEC from the 15 previous days.
The VTEC is expressed in TECu (with TECu=10^16 electrons per square meter) and is directly related to the signal propagation delay due to the ionosphere (in figure: delay on GPS L1 frequency).
The Sun's radiation ionizes the Earth's upper atmosphere, the ionosphere, located from about 60km to 1000km above the Earth's surface.The ionization process in the ionosphere produces ions and free electrons. These electrons perturb the propagation of the GNSS (Global Navigation Satellite System) signals by inducing a so-called ionospheric delay.
See http://stce.be/newsletter/GNSS_final.pdf for some more explanations ; for detailed information, see http://gnss.be/ionosphere_tutorial.php
Future Events
For more details, see http://www.spaceweather.eu/en/event/future
The Scientific Foundation of Space Weather
Start : 2016-06-27 - End : 2016-07-01
Website:
http://www.issibern.ch/program/workshops.html