- Table of Content
- 1.The best of … ...
- 2.PROBA2 Observa...
- 3.Review of sola...
- 4.The Internatio...
- 5.Review of geom...
- 6.Geomagnetic Ob...
- 7.Review of iono...
- 8.New documents ...
2. PROBA2 Observations (22 Feb 2016 - 28 Feb 2016)
3. Review of solar activity
4. The International Sunspot Number
5. Review of geomagnetic activity
6. Geomagnetic Observations at Dourbes (22 Feb 2016 - 28 Feb 2016)
7. Review of ionospheric activity (22 Feb 2016 - 28 Feb 2016)
8. New documents in the European Space Weather Portal Repository
The best of … 2015!
A compilation of the most memorable space weather moments of 2015 can be found underneath. Using the fantastic (J)Helioviewer software, a MOVIE at https://youtu.be/5XPnCD3SkVw was created containing one or more clips of each event. Usually, SDO-images were used, occasionally supplemented with imagery from PROBA2, SOHO, and the GONG H-alpha Network.
As this chronological list concerns punctual events on the Sun, it does not contain clips from other noteworthy events in 2015, such as e.g. the DSCOVR launch (11 February), the total solar eclipse (20 March), the transition to the new sunspot number (1 July), the reawakening of STEREO-A (early July), or the 20th anniversary of SOHO (2 December). Even then, it was still quite hard to pick these 15 events from all the other eruptions and activity.
We wish you an enjoyable viewing time!
Event 1: 30 January 2015 - Solar Jet
Around noon on 30 January, a spectacular solar jet was visible near the Sun's east limb. Coronal jets are rather narrow ("squeezed") ejections of solar plasma that result from magnetic reconnection between some emerging flux and pre-existing "open" field structures. The resulting jets can emit material up into the higher solar atmosphere and even into space if the eruption is strong enough. Jets are not rare, but today’s event was certainly one of the more spectacular.
Ref: STCE news item of 05 February 2015 at http://www.stce.be/news/293/welcome.html
Event 2: 24 February 2015 - Spectacular filament eruption
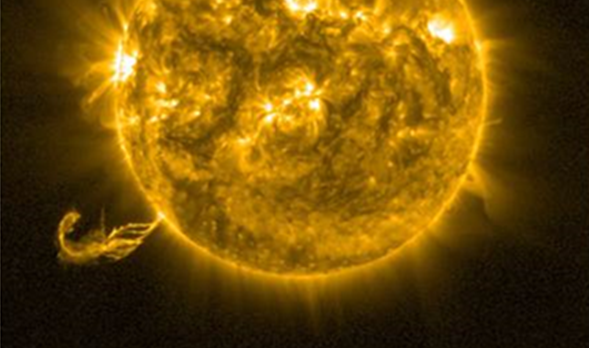
There were plenty of prominence and filament eruptions in 2015! On 24 February, the spectacular eruption of a solid filament near the southeast solar limb was nicely captured by PROBA-2 and SDO solar imagers. The associated coronal mass ejection (CME) had a speed of over 800 km/s, but was not directed to Earth.
Ref: STCE news item of 05 March 2015 at http://www.stce.be/news/297/welcome.html
Event 3: 2 March 2015 - M3.7 flare
The modest M3.7 flare on 2 March got accompanied by an impressive and dynamic ejection of plasma. The source region, NOAA 2290, was not very big but magnetically complex. It would go on and produce a total of 4 M-class flares, the last two (and strongest) M-class events being produced when the region had already rounded the northwest solar limb.
Ref: STCE news item of 12 March 2015 at http://www.stce.be/news/298/welcome.html
Event 4: 17 March 2015 - Saint Patrick Day's geomagnetic storm
NOAA 2297 supremely ruled the solar activity from 5 till 20 March, and despite its modest size became the most flare active region of the year. It produced more than 20 M-class flares and 1 X-class event, the latter on 11 March. On 15 March, the region produced a rather moderate, but 2-hour long C9 flare which was accompanied by a fast partial halo CME with an earth-directed component. As expected, the CME hit Earth early on Saint Patrick's day, sparking the most intense geomagnetic storm of the current solar cycle (Kp = 8; Dst = -223 nT) so far. The passing CME temporarily reduced the cosmic rays arriving at Earth, and a Forbush decrease of 4.5% was recorded by neutron monitors on Earth (Oulu NM at http://cosmicrays.oulu.fi/ ).
Ref: STCE news item of 12 March 2015 at http://www.stce.be/news/298/welcome.html and of 26 March 2015 at http://www.stce.be/news/301/welcome.html , and the STCE press item of 11 March 2015 at http://www.stce.be/news/299/welcome.html
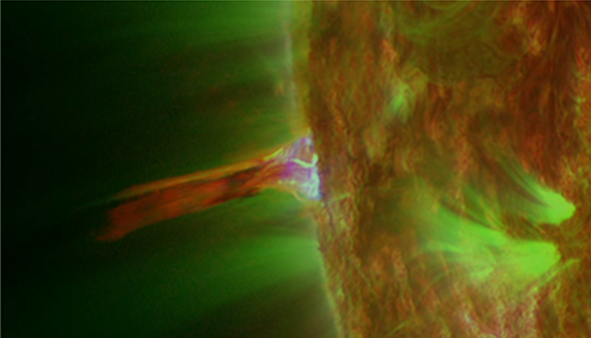
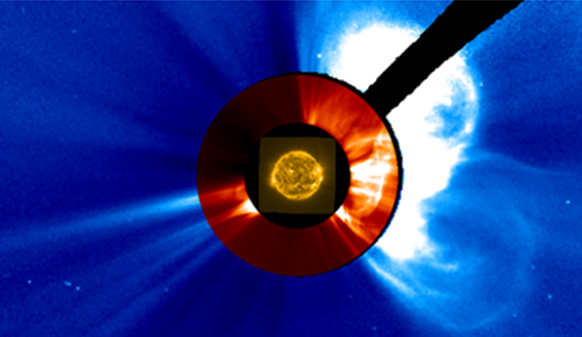
Event 5: 27 March 2015 - The great wall of plasma
Prominences are regions of dense and relatively cool material that are squeezed between fields of opposite magnetic polarity, having typical values for height and length of resp. 30.000 km and 100.000 km. The specimen that erupted on 27 March was more than 8 times as tall as the Earth, and had a length of nearly the Earth-Moon distance. For a few days, it was probably the most photographed solar feature before gracefully lifting off in a matter of hours. Interestingly, a filament of similar size erupted about a month later also near the northeast limb.
Ref: STCE news items of 2 April 2015 at http://www.stce.be/news/302/welcome.html , and of 30 April 2015 at http://www.stce.be/news/305/welcome.html
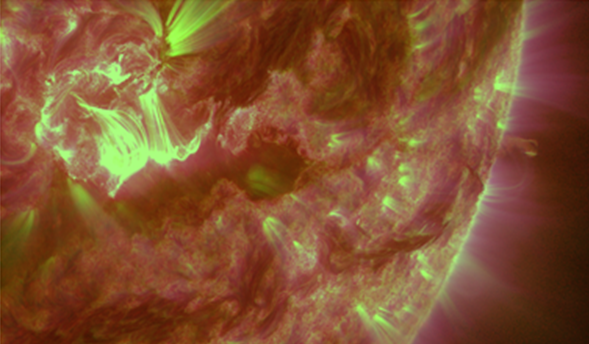
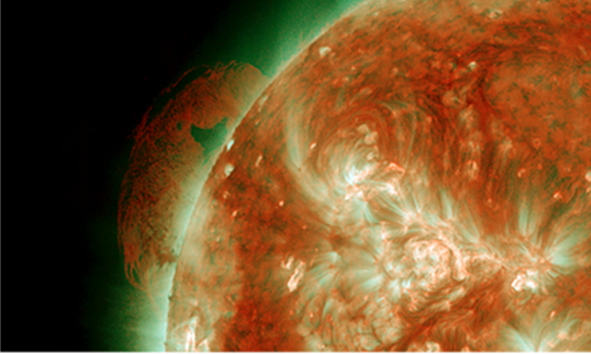
Event 6: 5 May 2015 - Strongest flare of the year
Little did space weather forecasters know at that time, but the strongest, second, and at the same time last X-class solar flare of the year erupted on 5 May 2015. It concerned a modest X2.7 barely lasting 10 minutes. The source region, NOAA 2339, was one of the larger sunspot groups of the year but produced mostly C-class flares. A coronal wave can be seen racing towards the northern polar coronal hole, "kicking" a filament strand near the northeast limb. The associated, fast CME was not directed to Earth. The filament eruption in the southern hemisphere started before the X-class flare and seems to be unrelated.
Ref: STCE press item of 6 May 2015 at http://www.stce.be/news/306/welcome.html
Event 7: 18-27 June 2015 - NOAA 2371 and the Solstice storm
NOAA 2371 was the source of stormy space weather during the last 10 days of June. A double M-class flare early on 21 June, and two strong M-class flares on 22 and 25 June resp. were associated with full halo CMEs. This resulted in a severe geomagnetic storm on 22 June (the "Solstice storm"; Kp = 8, Dst = -204 nT) which was the second strongest of the year after the 17 March storm. Bz reached -37 nT, the most negative excursion measured in 2015. So far this solar cycle, no extremely severe geomagnetic storm has been observed (Kp = 9).
The quick succession of passing CMEs temporarily reduced the cosmic rays arriving at Earth, and a Forbush decrease of nearly 8% was recorded, the strongest of 2015 (Oulu NM at http://cosmicrays.oulu.fi/ ). It took nearly a week before neutron counts were back at nominal level. The 21 June flares were most likely also responsible for the strongest proton event of the year, a strong solar radiation event. The peak of this strong solar radiation storm coincided with the peak of the severe geomagnetic storm and the M6 flare, around 19:00UT on 22 June.
Ref: STCE news items of 16 July 2015 at http://www.stce.be/news/313/welcome.html and of 5 August 2015 at http://www.stce.be/news/316/welcome.html , as well as the STCE Newsletter of 3 July 2015 at http://www.stce.be/newsletter/pdf/2015/STCEnews20150703.pdf
Event 8: 19 July 2015 - Long Duration Event
The C-class flare with the longest duration (in 2015) took place on 19 July. Officially, the C2 flare lasted for 3 hours and 40 minutes, but it took several more hours for the x-ray flux to decline back to pre-eruptive levels. The source of this LDE (Long Duration Event) was a filament eruption near the Sun's west limb.
Ref: STCE news item of 23 July 2015 at http://www.stce.be/news/314/welcome.html
Event 9: 18-30 August 2015 - NOAA 2403: Largest sunspot region
According to NOAA measurements, NOAA 2403 was the largest sunspot region of the year, being slightly larger than NOAA 2371. Both regions had a sunspot area corresponding to about 7 times the total surface area of the Earth. For a reference: Famous sunspot region NOAA 2192 (October 2014) reached nearly 16 times Earth's surface area... NOAA 2403 was magnetically more complex than NOAA 2371, producing almost twice the number of M-class flares (11 vs. 6), but no X-class flares.
Ref: STCE news item of 2 September 2015 at http://www.stce.be/news/317/welcome.html
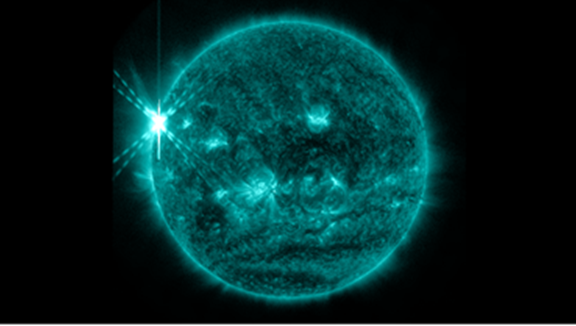
Event 10: 28 September 2015 - M7 flare in NOAA 2422
NOAA 2422 was the third largest sunspot region of the year. It produced 18 M-class flares, the strongest being an M7.6 eruption on 28 September. It concerned an impulsive event, barely lasting 10 minutes, and was not associated with an obvious CME. In 2015, just 5 groups were responsible for the two X-class flares, about 60% of all M-class flares, and 25% of all C-class events: Compact NOAA 2297, and the 4 largest sunspot regions NOAA 2339, 2371, 2403 and 2422.
Ref: STCE news item of 30 September 2015 at http://www.stce.be/news/321/welcome.html
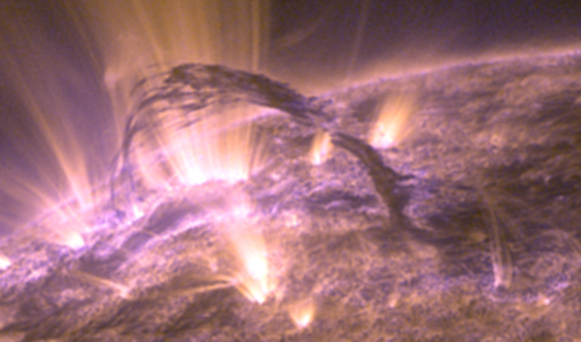
Event 11: 30 September 2015 - Spectacular and complex prominence eruption
On 30 September, a prominence near the southwest solar limb got ejected into space. The structure had been visible during the previous 2 weeks, when the surrounding magnetic field finally became unstable and ejected it into space early that day. The escaping material triggered more reconnections in the corona, with material raining down near the northwest solar limb. Hence, the first coronal mass ejection (CME) was quickly followed by another CME this time directed to the northwest. At the site of the second eruption, impressive supra-arcade downflows appeared. These are sunward moving voids often seen above developing post-eruption coronal loops.
Ref: STCE news item of 6 October at http://www.stce.be/news/322/welcome.html
Event 12: 7-8 October 2015 - Very fast solar wind
For nearly 3.5 days, solar wind speed at Earth was over 500 km/s. Peak speeds of 810 km/s and more were recorded late on 7 and early on 8 October. The source of the raging solar wind is a trans-equatorial coronal hole that transited the central meridian early on 5 October. High solar wind speeds (more than 800 km/s) near Earth are rare, happening only twice in 2015 – the other one being on 27 June. Large coronal holes were also observed late January (south pole extension) and early December (north pole extension).
Ref: STCE news item of 14 October 2015 at http://www.stce.be/news/323/welcome.html
Event 13: 4 November 2015 - M3 flare paralyzes Swedish air traffic
On 4 November, NOAA 2443 produced an M3.7 flare peaking at 13:39UT. This at first sight very normal flare was associated with strong radio and ionospheric disturbances that also affected radar and GPS frequencies. As a result, Swedish air traffic was halted for about an hour during the afternoon. The air traffic problems started at the most intense phase of the radio storm, and followed right on the heels of a minor geomagnetic storm caused by the high speed stream of a coronal hole. The CME associated with the M3 flare would cause a moderate (Kp = 6) geomagnetic storm during the first half of 7 November.
Ref: STCE news item of 11 November at http://www.stce.be/news/326/welcome.html
Event 14: 15 November 2015 - Impressive filament eruption
An 800.000 km, near-circular filament rounded the solar east limb around 7 November. It remained visible until late on 15 November when the surrounding magnetic fields became unstable and the filament erupted. It was followed by a smaller filament eruption to the southwest a few hours later. The bulk of these CMEs was not directed to Earth.
Ref: STCE news item of 17 November at http://www.stce.be/news/327/welcome.html
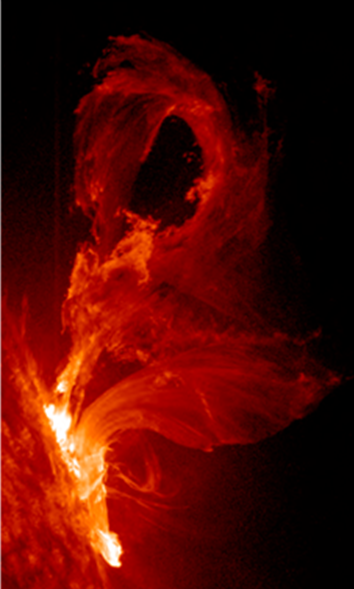
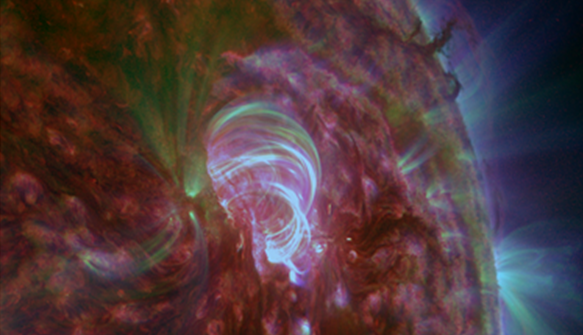
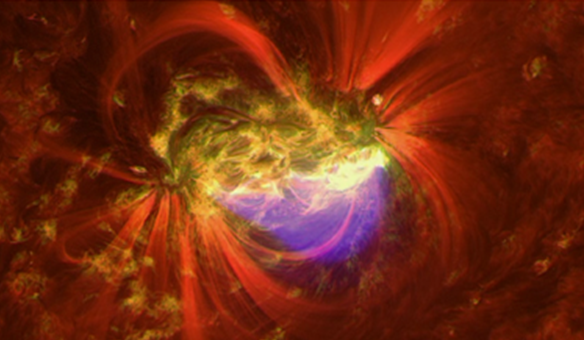
Event 15: 28 December 2015 - NOAA 2473's M1.8 flare
Some photogenic flares simply need inclusion in this short-list of memorable space weather events of 2015. Such an event was the M1.8 flare produced by NOAA 2473 during the noon hours of 28 December. This was a long duration event, lasting 169 minutes (nearly 3 hours)! It was associated with a proton enhancement (no event), a lovely arcade (series of post-flare coronal loops), a number of jets near the main spot, and a CME that would lead to a moderate geomagnetic storm as Earth entered a New Year.
Ref: STCE news item of 5 January 2016 at http://www.stce.be/news/331/welcome.html
PROBA2 Observations (22 Feb 2016 - 28 Feb 2016)
Solar Activity
Solar flare activity fluctuated between very low and low during the week.
In order to view the activity of this week in more detail, we suggest to go to the following website from which all the daily (normal and difference) movies can be accessed: http://proba2.oma.be/ssa
This page also lists the recorded flaring events.
A weekly overview movie can be found here (SWAP week 309).
http://proba2.oma.be/swap/data/mpg/movies/weekly_movies/weekly_movie_2016_02_22.mp4
Details about some of this week’s events, can be found further below.
Wednesday Feb 24
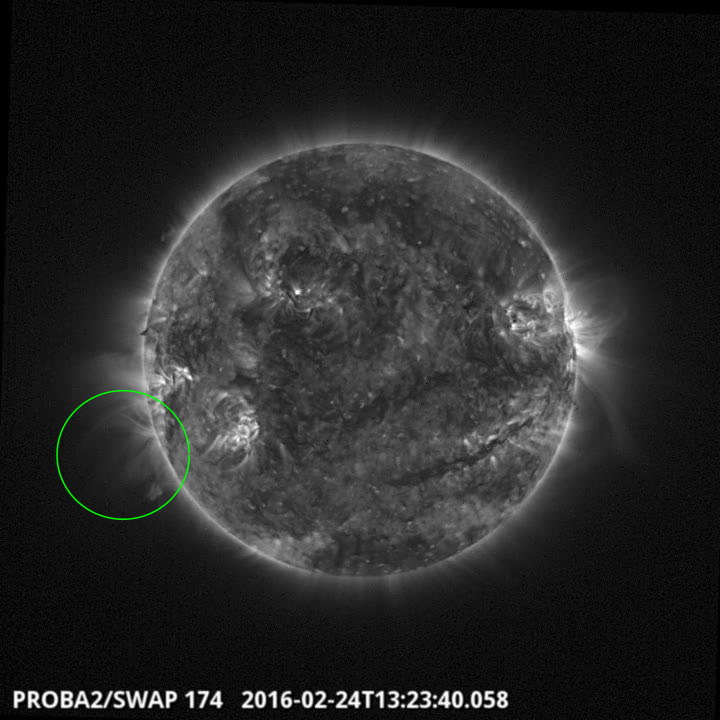
An eruption was observed by SWAP on the east limb at 13:23 UT on 2016Feb24
Find a movie of the event here (SWAP movie)
http://proba2.oma.be/swap/data/mpg/movies/20160224_swap_movie.mp4
Saturday Feb 27
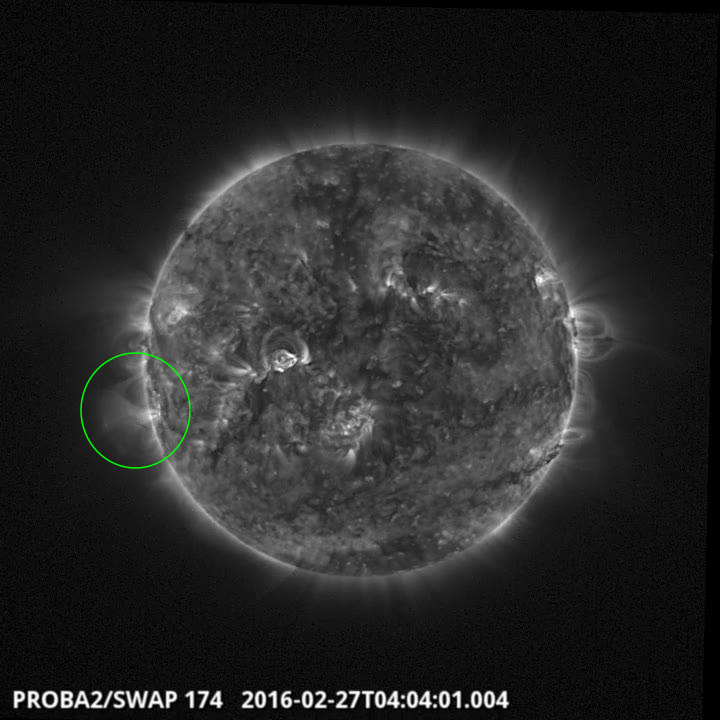
An eruption was observed by SWAP on the east limb at 04:04 UT on 2016Feb27
Find a movie of the event here (SWAP movie)
http://proba2.oma.be/swap/data/mpg/movies/20160227_swap_movie.mp4
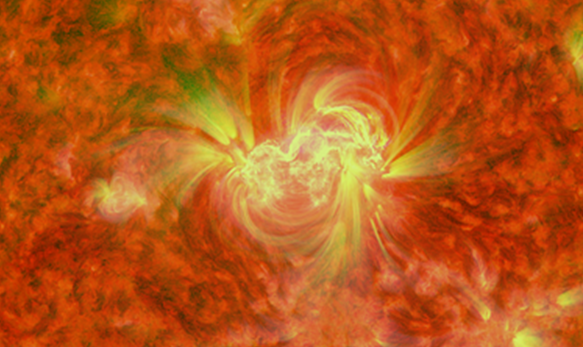
Review of solar activity
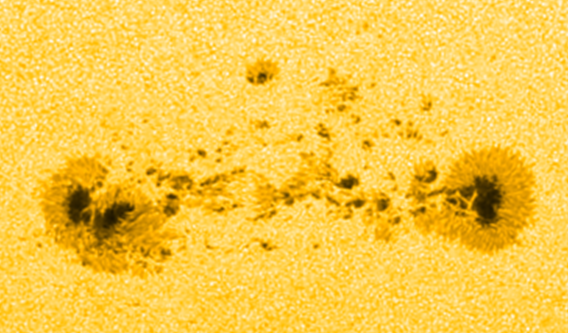
Solar activity was low throughout the week with only three minor C flares. The activity was entirely dominated by Catania group 27 (NOAA AR 2506), which transited form the East limb to the central meridian during the week while the groups 22 and 25 (NOAA 2501 and 2505) departed over the West limb.
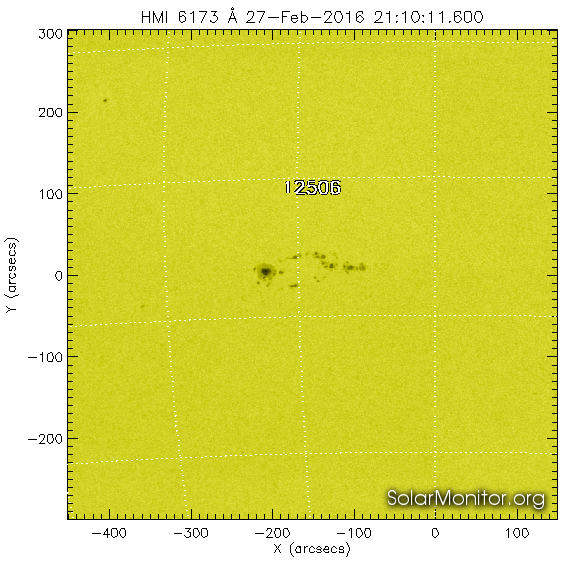
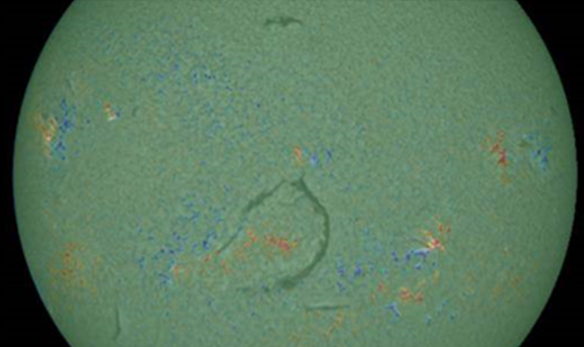
Catania group 27 (NOAA AR 2506) observed by SDO HMI at a wavelength of 6173 Angstrom on February 27.
A number of other spotted regions was visible on the Eastern hemisphere but were shortlived. The strongest flare was a C3.3 flare peaking at 05:55 on February 27.
No Earth directed CMEs have been observed over the week.
The International Sunspot Number
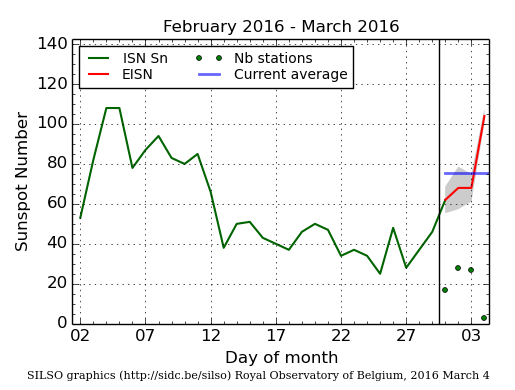
The daily Estimated International Sunspot Number (EISN, red curve with shaded error) derived by a simplified method from real-time data from the worldwide SILSO network. It extends the official Sunspot Number from the full processing of the preceding month (green line). The plot shows the last 30 days (about one solar rotation). The horizontal blue line shows the current monthly average, while the green dots give the number of stations included in the calculation of the EISN for each day.
Review of geomagnetic activity
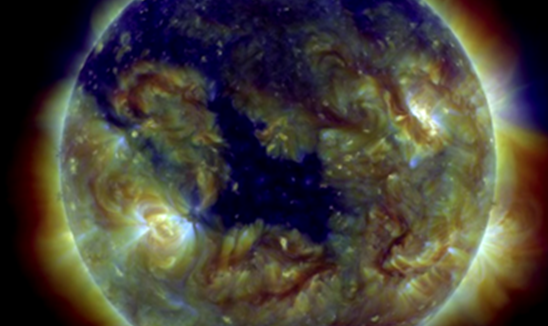
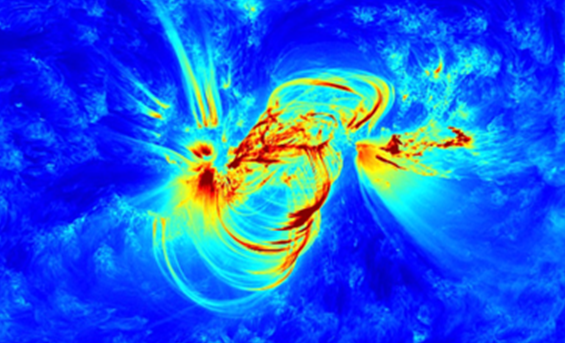
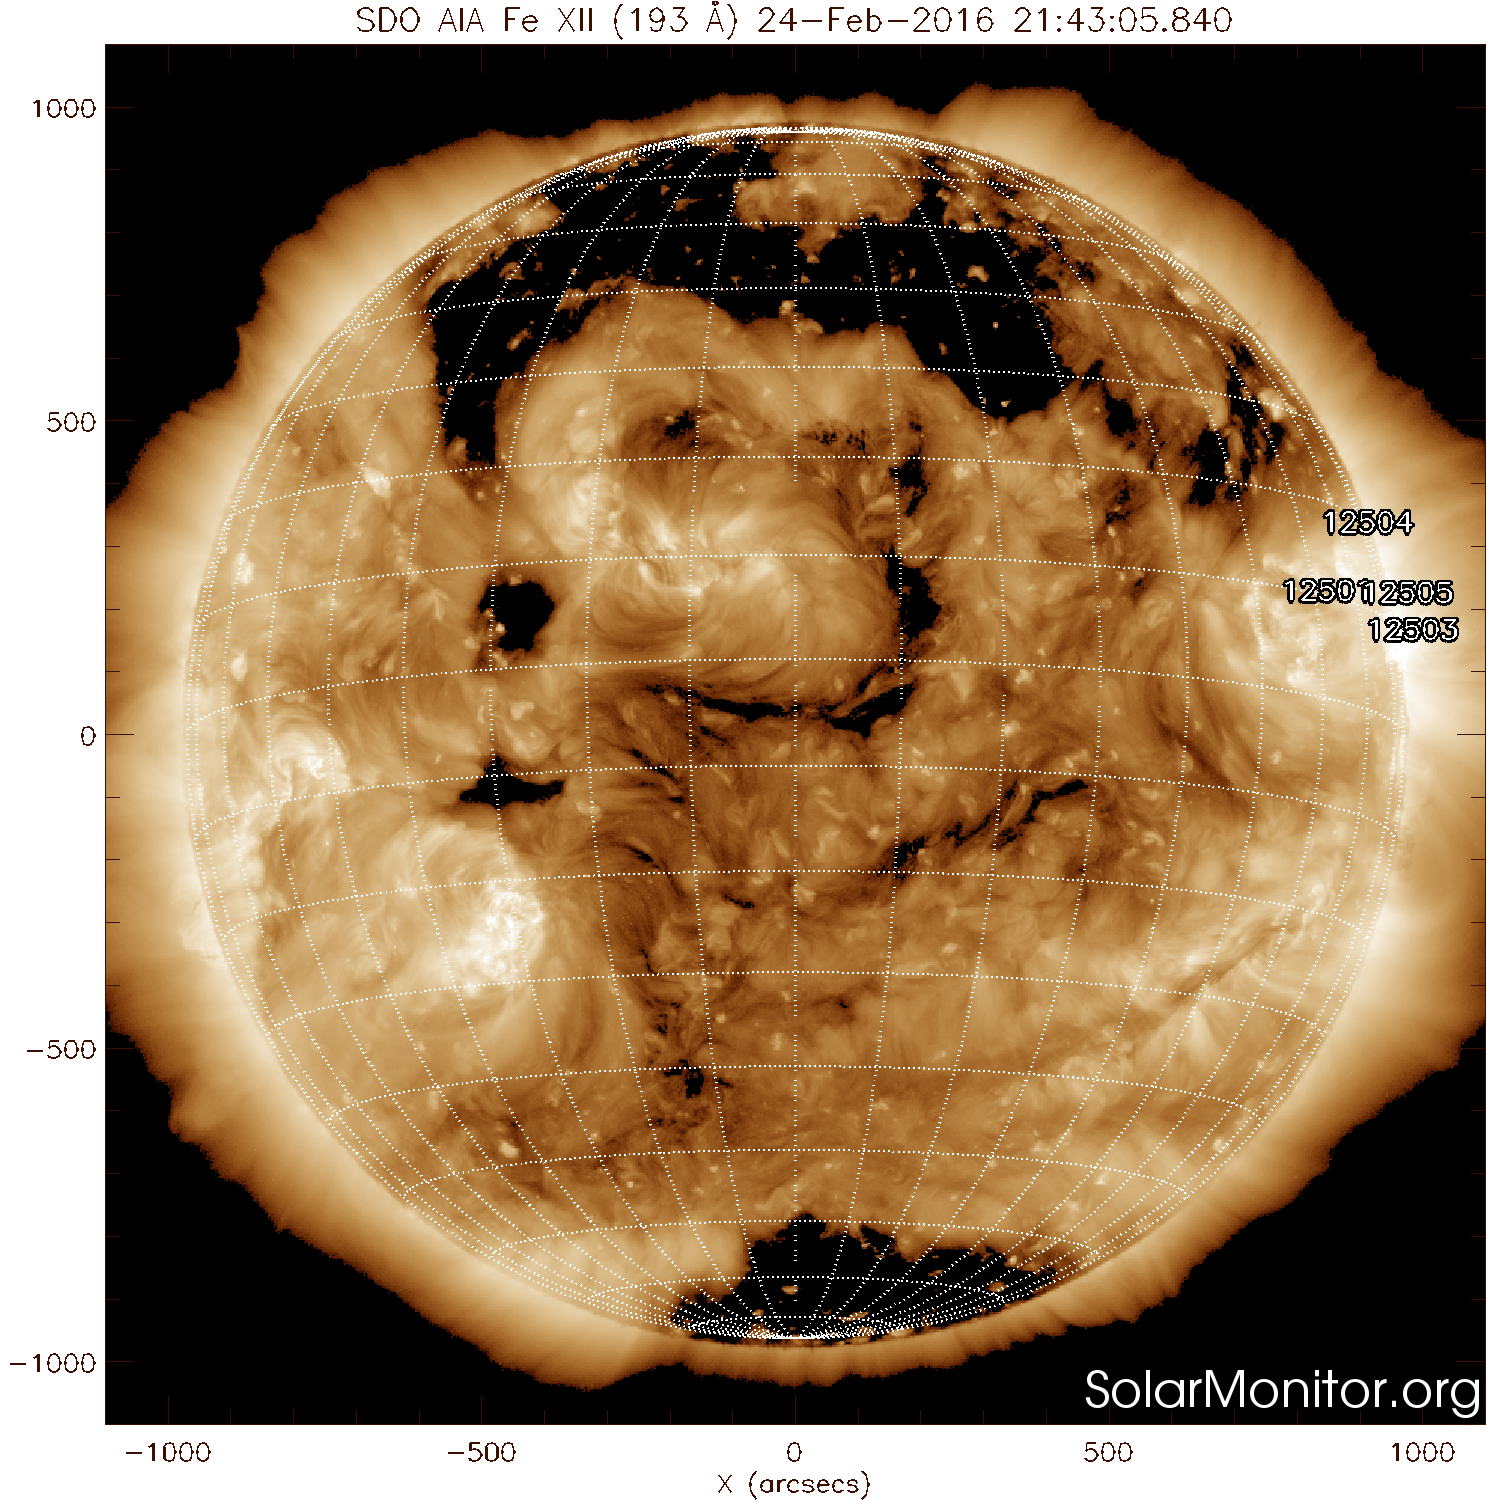
Solar wind conditions were at near background conditions while a sector boundary crossing, from the negative into the positive sector, and a possible influence of the extensions of the northern polar coronal hole (see SDO/AIA 193 image below) was expected.
After reaching speeds below 300 km/s the sector boundary crossing just before midnight February 25/26 started the gradual increase of solar wind speed to at most 450 km/s. The boundary crossing was associated with a temporary rise in the total magnetic field to around 13 nT.
Geomagnetic conditions were mainly quiet with only a few unsettled periods around the time of the sector boundary crossing.
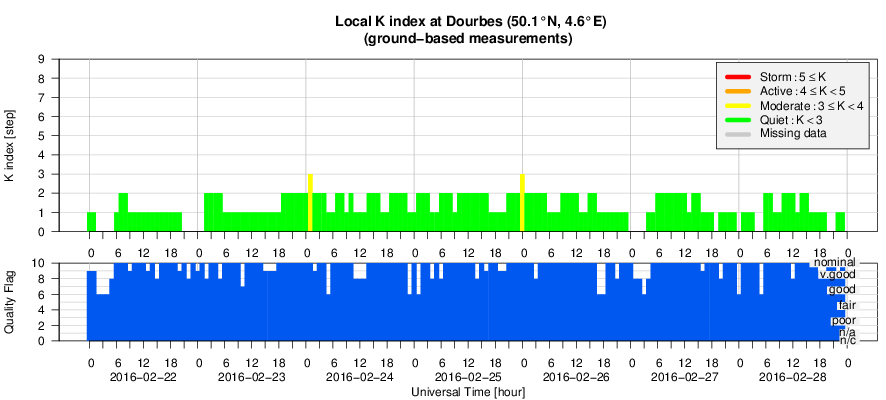
Geomagnetic Observations at Dourbes (22 Feb 2016 - 28 Feb 2016)
Review of ionospheric activity (22 Feb 2016 - 28 Feb 2016)
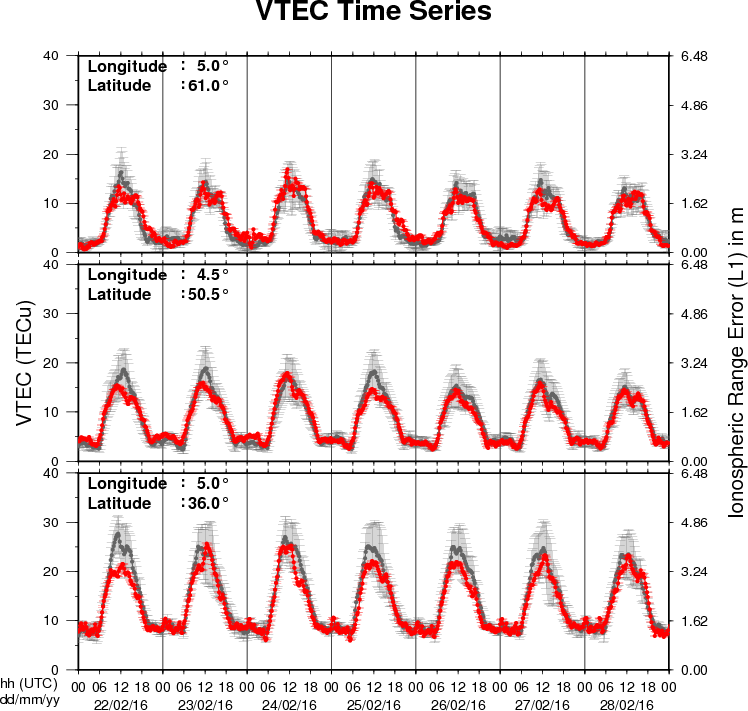
The figure shows the time evolution of the Vertical Total Electron Content (VTEC) (in red) during the last week at three locations:
a) in the northern part of Europe(N61°, 5°E)
b) above Brussels(N50.5°, 4.5°E)
c) in the southern part of Europe(N36°, 5°E)
This figure also shows (in grey) the normal ionospheric behaviour expected based on the median VTEC from the 15 previous days.
The VTEC is expressed in TECu (with TECu=10^16 electrons per square meter) and is directly related to the signal propagation delay due to the ionosphere (in figure: delay on GPS L1 frequency).
The Sun's radiation ionizes the Earth's upper atmosphere, the ionosphere, located from about 60km to 1000km above the Earth's surface.The ionization process in the ionosphere produces ions and free electrons. These electrons perturb the propagation of the GNSS (Global Navigation Satellite System) signals by inducing a so-called ionospheric delay.
See http://stce.be/newsletter/GNSS_final.pdf for some more explanations ; for detailed information, see http://gnss.be/ionosphere_tutorial.php
New documents in the European Space Weather Portal Repository
See http://www.spaceweather.eu/en/repository
STCE - Mini-ijstijd op komst?
Onlangs kopten de kranten: ‘mini-ijstijd op komst!’ Een wetenschapper voorspelde dat het gemiddeld aantal zonnevlekken zou dalen en de zon dus minder actief wordt. Hierdoor zou de komende decennia de temperatuur op aarde globaal gezien dalen.
De zon is helemaal geen statisch, onveranderlijk hemellichaam zoals je wel eens zou kunnen denken. Ze heeft twee seizoenen die elkaar opvolgen: een seizoen waarin de zon eerder kalm is of een zonneminimum en een seizoen waarin de zon heel wat activiteit ten toon spreid of een zonnemaximum. Zo een activiteitencyclus duurt om en bij de 11 jaar. Tijdens een zonneminimum ziet de zonneatmosfeer er meer egaal uit, tijdens een zonnemaximum is haar atmosfeer eerder een kluwen van plaatselijke actieve gebieden die kleine en grote uitbarstingen veroorzaken.
Of de zon actief is of minder actief, kan je beschrijven met het zonnevlekkengetal. Het mooie aan het zonnevlekkengetal is dat we dit eenvoudig kunnen bepalen door letterlijk te tellen hoeveel vlekken aanwezig zijn op de zonneschijf. Een simpele telescoop voldoet. Dit is de reden waarom deze index zo ver teruggaat in de tijd. Systematische waarnemingen van het zonnevlekkengetal zijn beschikbaar vanaf het begin van de 17de eeuw. We hebben dus een uitgebreid archief voor klimaatstudies.
Maar kan je de zonnevlekkencyclus zomaar linken aan het klimaat op aarde? Kan je besluiten dat een mini-ijstijd eraan staat te komen indien blijkt dat de komende cyclus lager is dan de vorigen?
http://www.spaceweather.eu/en/repository/show?id=599