- Table of Content
- 1.Comin' around ...
- 2.A new generati...
- 3.PROBA2 Observa...
- 4.Review of sola...
- 5.The Internatio...
- 6.Review of geom...
- 7.Geomagnetic Ob...
- 8.Review of iono...
- 9.Future Events
2. A new generation of JHelioviewer now available
3. PROBA2 Observations (4 Apr 2016 - 10 Apr 2016)
4. Review of solar activity (4 Apr 2016 - 10 Apr 2016)
5. The International Sunspot Number
6. Review of geomagnetic activity
7. Geomagnetic Observations at Dourbes (4 Apr 2016 - 10 Apr 2016)
8. Review of ionospheric activity (4 Apr 2016 - 10 Apr 2016)
9. Future Events
Comin' around the bend
Solar activity has been very low over the last weeks, with very few or no C-class flares at all. The x-ray background flux was also low, at or just below the B1 level. Around noon on 5 April, this background flux started a gentle increase to values slightly above B3 on 7 April, coinciding with the appearance of a big sunspot near the solar east limb.
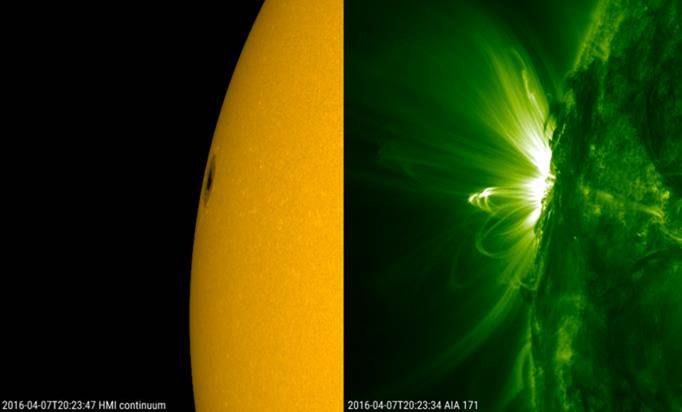
The new region quickly got the number NOAA 2529. It was a bipolar sunspot group with a big, symmetric main spot and a surface area 5 to 6 times the total surface area of the Earth. Several solar observers, using protective eclipse glasses, reported the sunspot group as a naked eye object on 10 April. Consistent with its rather simple magnetic configuration, the region produced only some low-level C-class flares. Interestingly, this flaring activity was already observed while the region was still behind the solar limb. In the end, the region produced all 16 C-class flares of last week, including two long duration events on 9 April (C2.8 flare) and 10 April (C1.5 flare), but no M-class flares (so far).
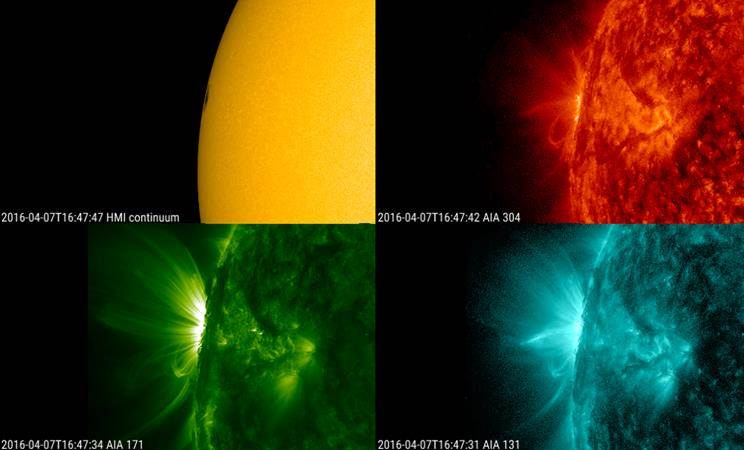
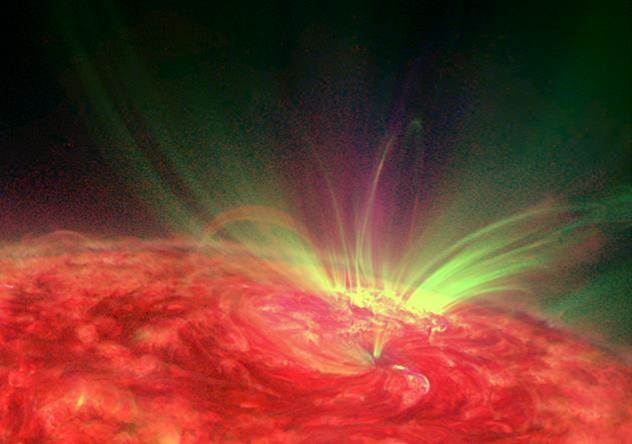
The clips of the related movie at https://youtu.be/WOM0EV2FPUw all cover the period from noon on 5 April till noon on 9 April. SDO imagery (http://sdo.gsfc.nasa.gov/ ) is used, and the clips were created using the JHelioviewer software (http://www.jhelioviewer.org/ ). The first clip shows a full solar disk in white light and extreme ultraviolet (AIA131; blue, several million degrees). It is followed by a zoom in the same wavelengths. The next two clips show the same zoomed comparison to white light, but in wavelengths of successively lower temperatures, resp. AIA171 (green, +/- 700.000 degrees) and AIA304 (red, +/- 80.000 degrees). The next two clips show the four wavelengths at the same time, resp. as separate images (see image above) and overlaid one onto the other (see below for a 90 degrees rotated image). Most of the activity was coming from the trailing part of the region.
A new generation of JHelioviewer now available
JHelioviewer is an open-source application for visualization of solar images.
The JHelioviewer “2.10” is significantly faster and more robust and includes new awesome features that are certainly of interest for the Space Weather community:
* Access to new datasets (GONG, SOLIS, etc.) from 3 different servers (GSFC, ROB, IAS)
* Combined view from different vantage points (e.g. STEREO and SDO) for full sphere mapping
* Image projections such as orthographic, latitudinal and polar
* Yet more viewing options, such as running and base differences, and a side-by-side (multi-view) mode
* Timeline datasets viewing, synchronized with the time of the current image
* Integration of features and events from the Heliophysics Events Knowledgebase (HEK), and alerts from the COMESEP system.
* Magnetic field line extrapolations
A full description of the installation, running of the software and new features can be found in the online user manual.
Download from http://jhelioviewer.org and http://sidc.be/jhelioviewer

Feedback is welcome at swhv – at – sidc.be
Happy view!
PROBA2 Observations (4 Apr 2016 - 10 Apr 2016)
Solar Activity
Solar flare activity fluctuated between very low and low during the week.
In order to view the activity of this week in more detail, we suggest to go to the following website from which all the daily (normal and difference) movies can be accessed:
http://proba2.oma.be/ssa
This page also lists the recorded flaring events.
A weekly overview movie can be found here (SWAP week 315).
http://proba2.oma.be/swap/data/mpg/movies/weekly_movies/weekly_movie_2016_04_04.mp4
Details about some of this week’s events, can be found further below.
Monday Apr 04

A slow eruption was observed by SWAP on the north east limb at 05:13 UT on 2016Apr04
Find a movie of the events here (SWAP movie)
http://proba2.oma.be/swap/data/mpg/movies/20160404_swap_movie.mp4
Review of solar activity (4 Apr 2016 - 10 Apr 2016)
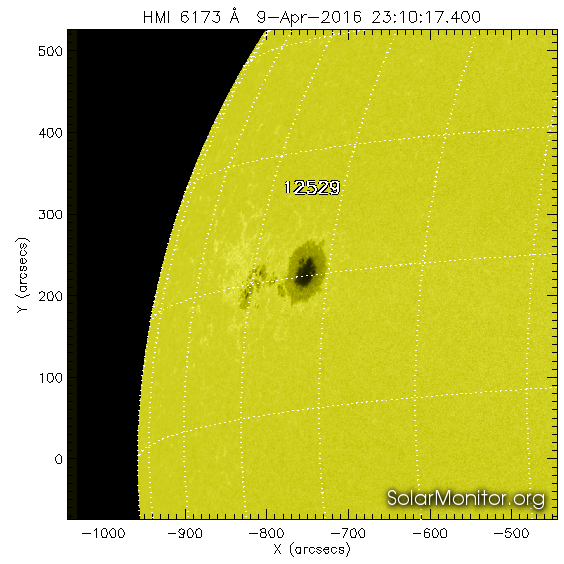
Solar activity was very low during the first half of the week (B flares only) and low during the second half of the week. Fifteen C flares were observed coming from NOAA 2529 starting from 06-Apr-2016. The strongest event was a long-duration C2.8 flare on 09-Apr-2016 peaking at 13:42 UT. NOAA 2529 appeared as a sunspot (Catania 54) that was visible with the naked eye! Below, the SDO/HMI view of Catania 54.
For most of the week, Catania sunspot 53 (NOAA AR 2528) was the sole sunspot group visible on the solar disk. No earth-directed coronal mass ejections were observed. The X-ray background flux was at C1 level for the second part of the week.
The International Sunspot Number

The daily Estimated International Sunspot Number (EISN, red curve with shaded error) derived by a simplified method from real-time data from the worldwide SILSO network. It extends the official Sunspot Number from the full processing of the preceding month (green line). The plot shows the last 30 days (about one solar rotation). The horizontal blue line shows the current monthly average, while the green dots give the number of stations included in the calculation of the EISN for each day.
Review of geomagnetic activity
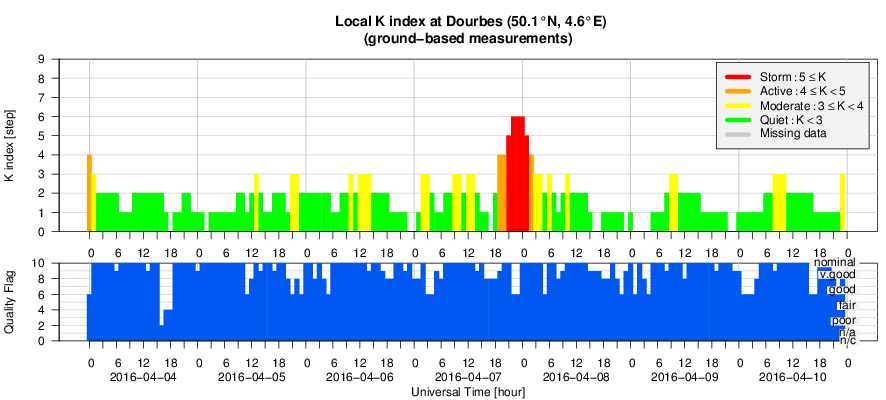
The first half of the week the geomagnetic conditions and solar wind parameters were quiet. However, around 14:00 UT on 07-Apr-2016 the Earth started to cross the solar sector boundary. This can be seen in the transition of the phi-angle.

The total magnetic field B increased till 14 nT, while Bz component strongly decreased till -14 nT.
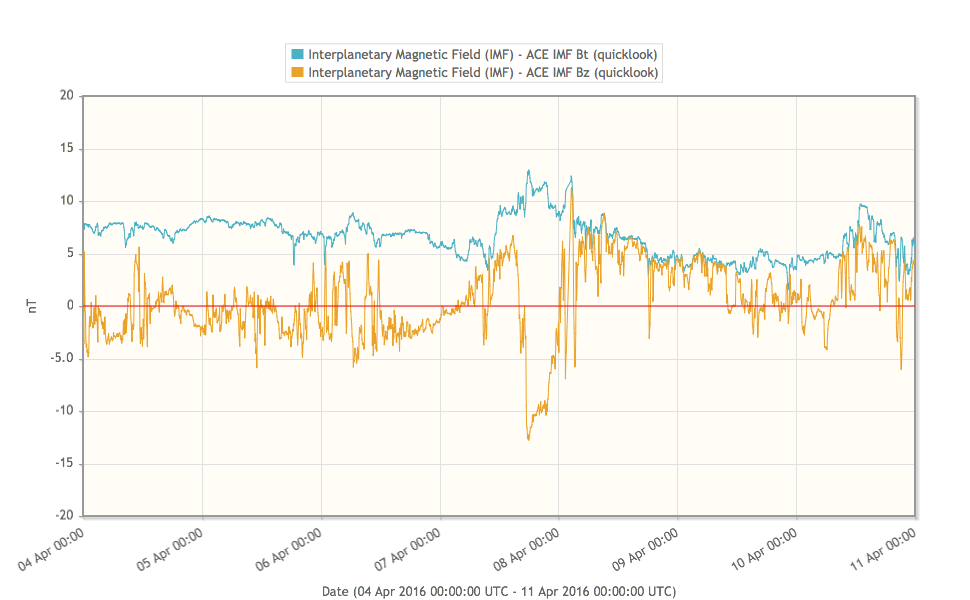
This disturbance resulted in the K index reaching minor storm levels around 22:00 UT on 7-Apr-2016 (recorded at NOAA and Dourbes). Solar wind parameters then quickly returned to nominal values around 15:00 UT at 8-Apr-2016. A minor geomagnetic storm can be also expected around 13 of April due to a negative CH transiting the central meridian.
Geomagnetic Observations at Dourbes (4 Apr 2016 - 10 Apr 2016)
Review of ionospheric activity (4 Apr 2016 - 10 Apr 2016)
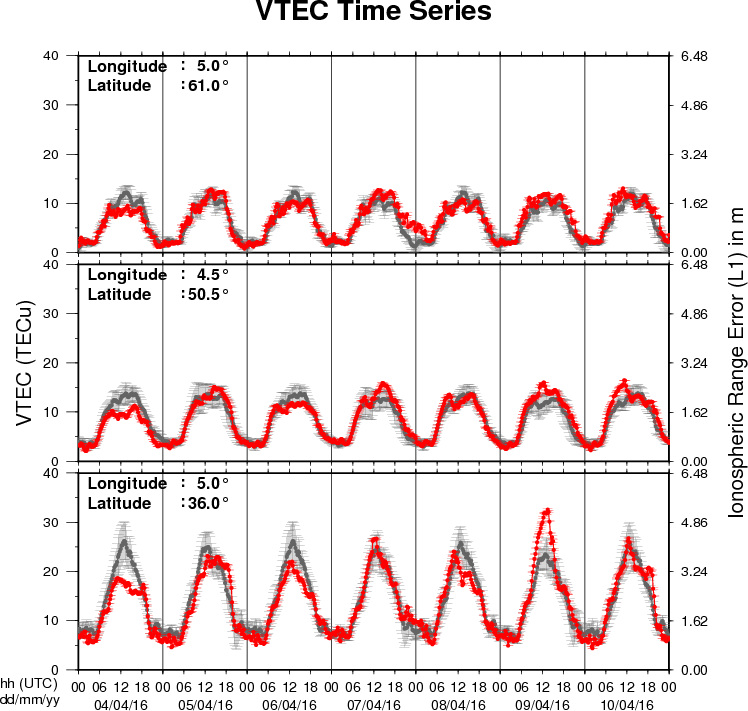
The figure shows the time evolution of the Vertical Total Electron Content (VTEC) (in red) during the last week at three locations:
a) in the northern part of Europe(N61°, 5°E)
b) above Brussels(N50.5°, 4.5°E)
c) in the southern part of Europe(N36°, 5°E)
This figure also shows (in grey) the normal ionospheric behaviour expected based on the median VTEC from the 15 previous days.
The VTEC is expressed in TECu (with TECu=10^16 electrons per square meter) and is directly related to the signal propagation delay due to the ionosphere (in figure: delay on GPS L1 frequency).
The Sun's radiation ionizes the Earth's upper atmosphere, the ionosphere, located from about 60km to 1000km above the Earth's surface.The ionization process in the ionosphere produces ions and free electrons. These electrons perturb the propagation of the GNSS (Global Navigation Satellite System) signals by inducing a so-called ionospheric delay.
See http://stce.be/newsletter/GNSS_final.pdf for some more explanations ; for detailed information, see http://gnss.be/ionosphere_tutorial.php
Future Events
For more details, see http://www.spaceweather.eu/en/event/future
The Scientific Foundation of Space Weather
Start : 2016-06-27 - End : 2016-07-01
Website:
http://www.issibern.ch/program/workshops.html