- Table of Content
- 1.Impressive eru...
- 2.Review of sola...
- 3.The Internatio...
- 4.PROBA2 Observa...
- 5.Review of geom...
- 6.Geomagnetic Ob...
- 7.Review of iono...
- 8.Future Events
- 9.New documents ...
2. Review of solar activity
3. The International Sunspot Number
4. PROBA2 Observations (20 Jun 2016 - 26 Jun 2016)
5. Review of geomagnetic activity
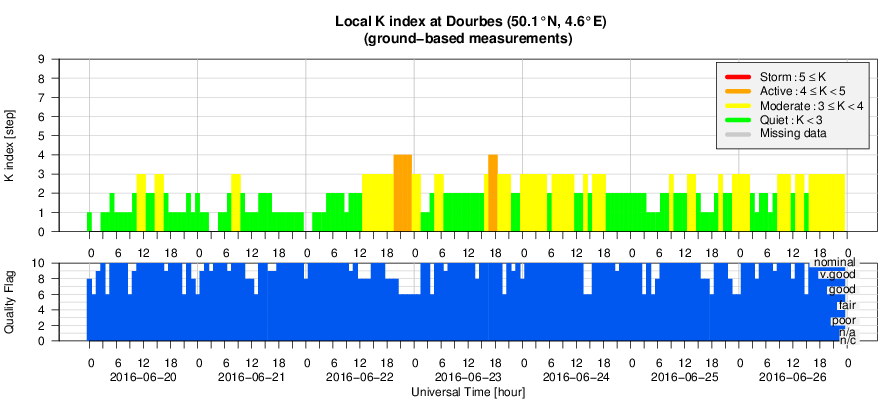
6. Geomagnetic Observations at Dourbes (20 Jun 2016 - 26 Jun 2016)
7. Review of ionospheric activity (20 Jun 2016 - 26 Jun 2016)
8. Future Events
9. New documents in the European Space Weather Portal Repository
Impressive eruption
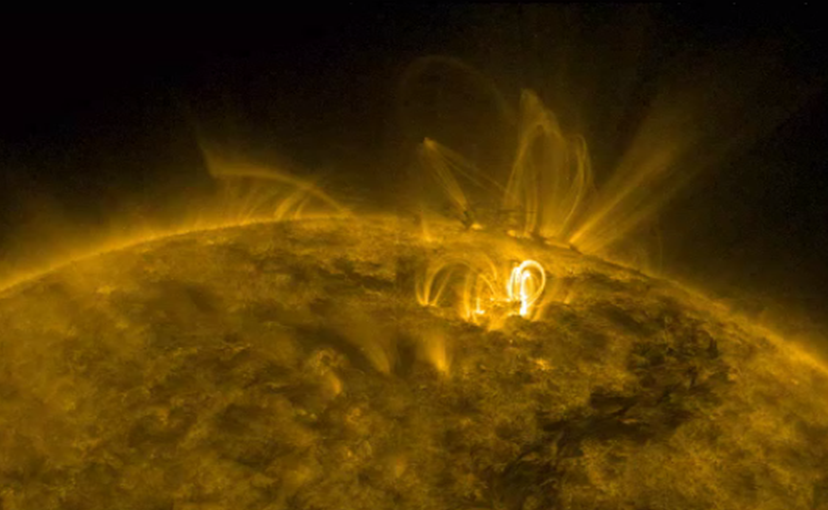
No C-class or stronger flares, and several spotless days: Last week will not be remembered for its high solar activity. Fortunately, some spotless active regions were rounding the east solar limb from 24 till 26 June, showing several and very dynamic coronal loops, some jets, filament eruptions, and more. The complex coronal structures can be appreciated in this extreme ultraviolet image made by SDO/AIA 171 (http://sdo.gsfc.nasa.gov/ ).
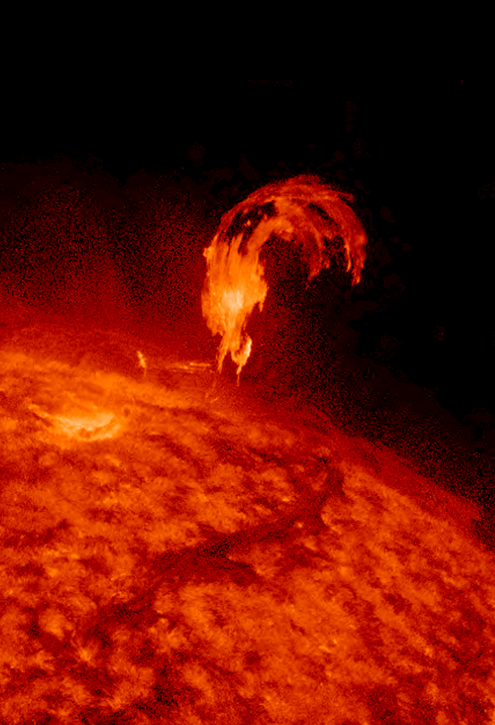
Early on 25 June, between 02:00 and 03:00UT, an important eruption took place in this area but on the Sun's backside. A blob of hot material was launched into space, with some of it falling back to the solar surface. The image underneath shows the impressive, albeit short-lived, eruption during its rising phase as seen in SDO/AIA 304.
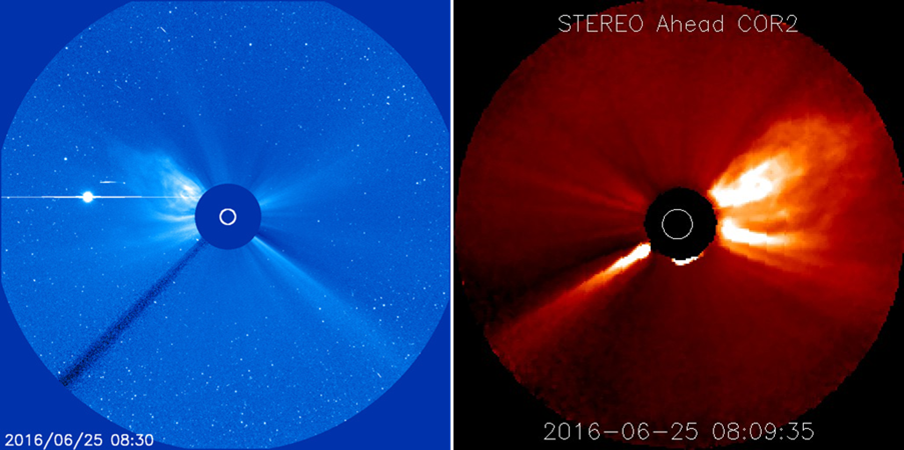
The related coronal mass ejection (CME) was observed by both the SOHO (http://sohowww.nascom.nasa.gov/home.html ) as the STEREO-A spacecraft. Because STEREO-A is still at the Sun's backside, the CME is seen at the other ("west") limb than by SOHO ("east"). The CME was not directed to Earth. The bright spot to the left of the Sun is the planet Venus, which is currently located at the opposite side of the Sun as seen from Earth.
A movie of the spotless active regions rounding the solar limb, as well as a clip of the backside eruption can be found at https://youtu.be/R5Ket5miY_4
Review of solar activity
Solar activity was very low during the whole week. No flares and no earth-directed coronal mass ejections (CMEs) were observed. There were no sunspots visible on the solar disc on 23, 25 and 26 June.
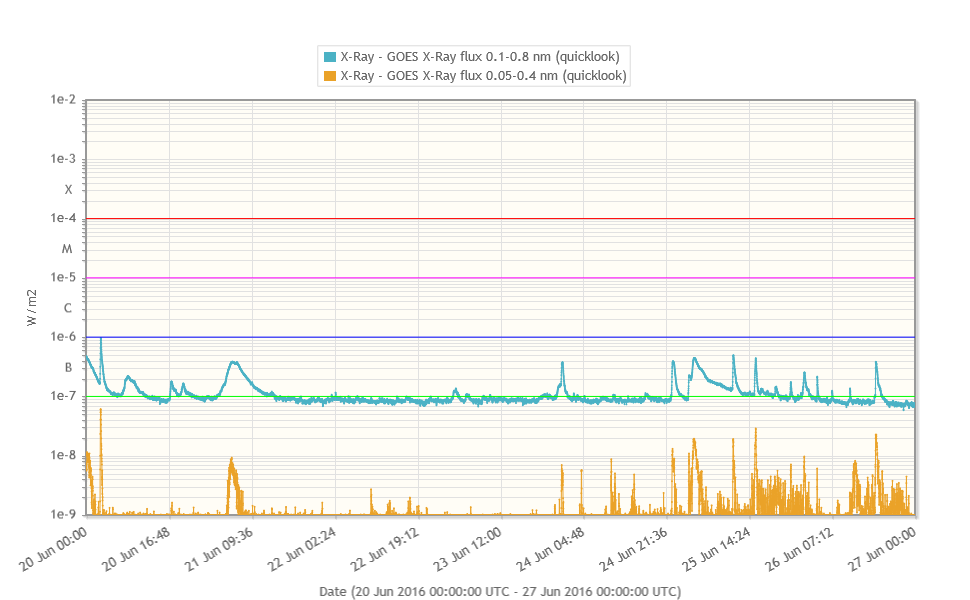
The strongest event of the period was a B9 flare early on 20 June.
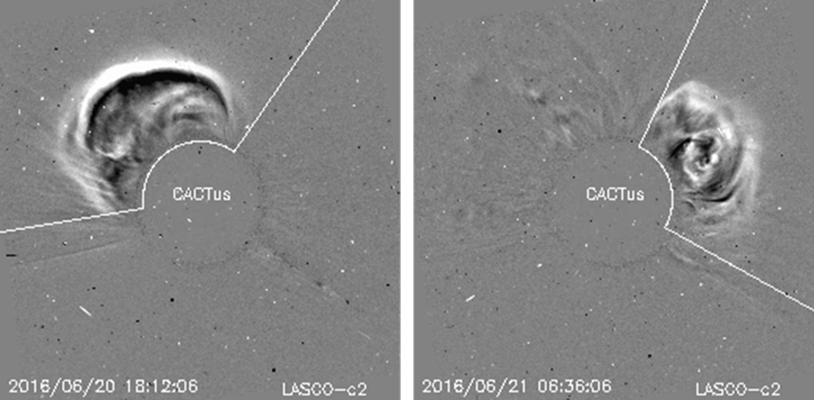
The CMEs on 20 and 21 June were not directed to Earth.
The International Sunspot Number
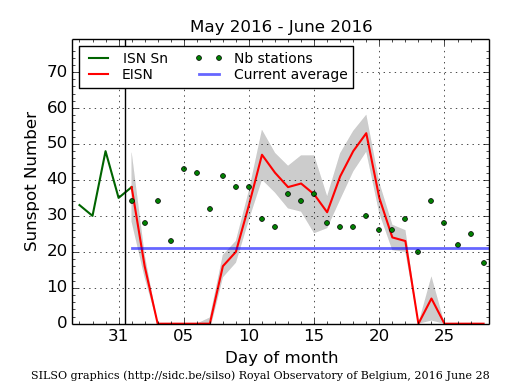
The daily Estimated International Sunspot Number (EISN, red curve with shaded error) derived by a simplified method from real-time data from the worldwide SILSO network. It extends the official Sunspot Number from the full processing of the preceding month (green line). The plot shows the last 30 days (about one solar rotation). The horizontal blue line shows the current monthly average, while the green dots give the number of stations included in the calculation of the EISN for each day.
PROBA2 Observations (20 Jun 2016 - 26 Jun 2016)
Solar Activity
Solar flare activity fluctuated between very low and low during the week.
In order to view the activity of this week in more detail, we suggest to go to the following website from which all the daily (normal and difference) movies can be accessed:
http://proba2.oma.be/ssa
This page also lists the recorded flaring events.
A weekly overview movie can be found here (SWAP week 326).
http://proba2.oma.be/swap/data/mpg/movies/weekly_movies/weekly_movie_2016_06_20.mp4
Details about some of this week's events, can be found further below.
Monday Jun 20
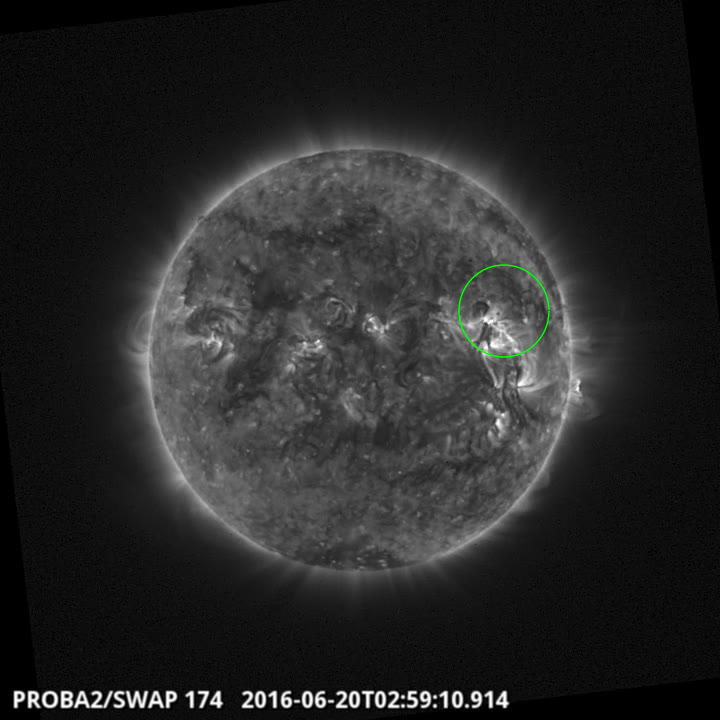
An eruption was observed by SWAP on the north west quadrant on the Sun on 2016Jun20 at
02:59 UT
Find a movie of the events here (SWAP movie)
http://proba2.oma.be/swap/data/mpg/movies/20160620_swap_movie.mp4
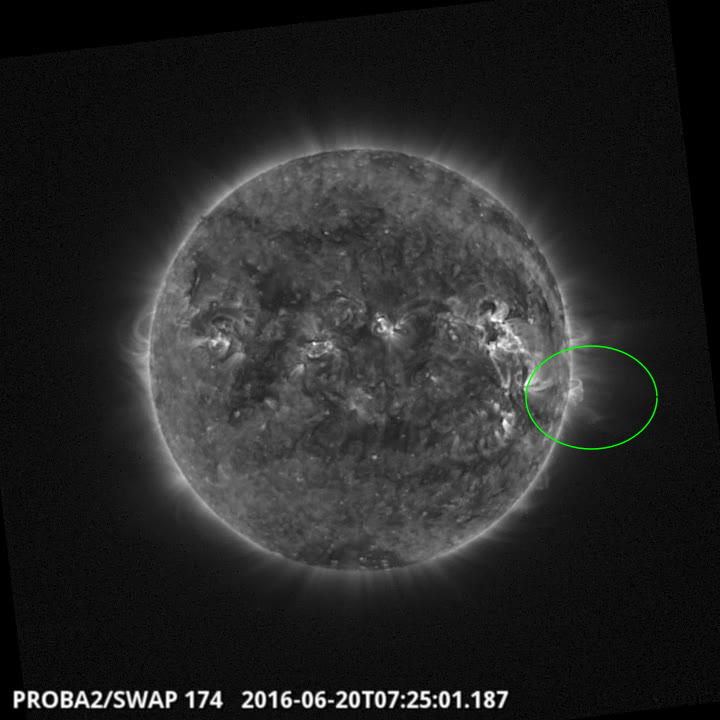
An eruption was observed by SWAP on the west limb on the Sun on 2016Jun20 at 07:25 UT
Find a movie of the events here (SWAP movie)
http://proba2.oma.be/swap/data/mpg/movies/20160620_swap_movie.mp4
Saturday Jun 25
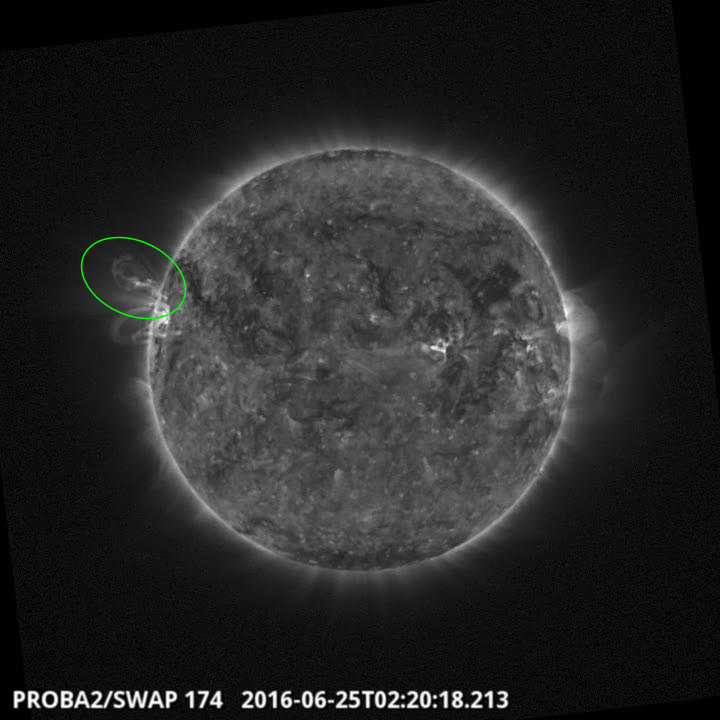
An eruption was observed by SWAP on the west limb on the Sun on 2016Jun25 at 02:20 UT
Find a movie of the events here (SWAP movie)
http://proba2.oma.be/swap/data/mpg/movies/20160625_swap_movie.mp4
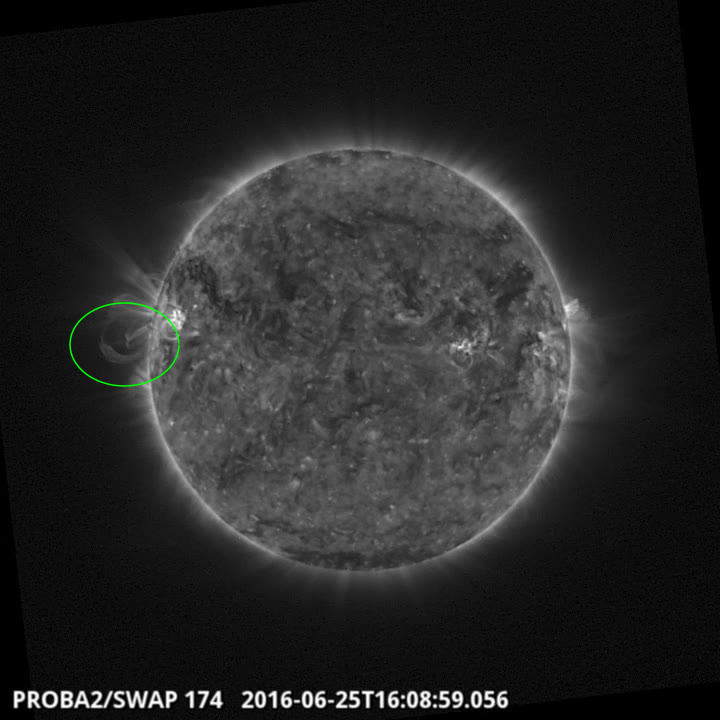
An eruption was observed by SWAP on the east limb on the Sun on 2016Jun25 at 16:08 UT
Find a movie of the events here (SWAP movie)
http://proba2.oma.be/swap/data/mpg/movies/20160625_swap_movie.mp4
Review of geomagnetic activity
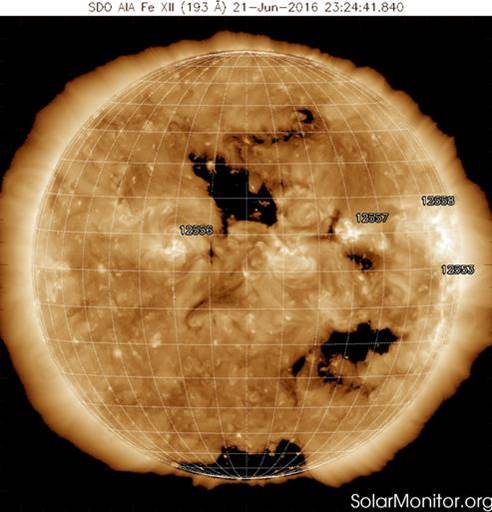
The Earth was under the influence of coronal hole high speed solar wind streams from 22 June until 25 June. The coronal holes responsible for these streams can be seen as the isolated dark patches near the solar equator in SDO's extreme ultraviolet image underneath.
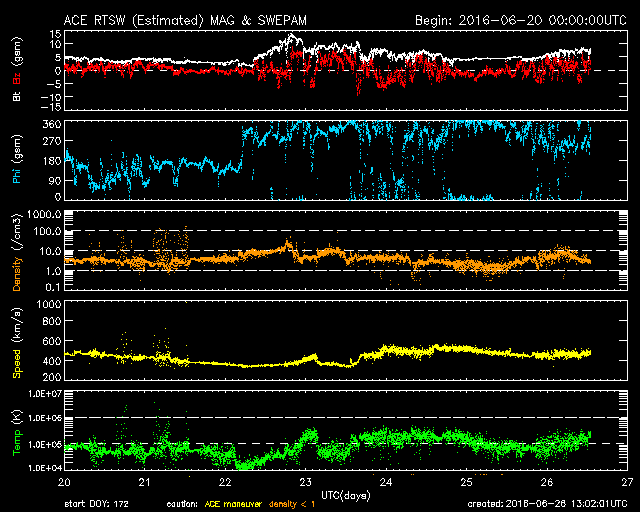
As a consequence, geomagnetic conditions reached active levels locally at Dourbes (K = 4) and minor storm conditions at planetary levels (Kp = 5) between 18:00 and 21:00 UT on 22 June. Then again active levels were observed in the night of 23-24 June, when solar wind speed reached 550 km/s (yellow curve underneath) with interplanetary magnetic field of 12 nT (white curve) and oriented towards the Sun ("negative"; blue curve).
Geomagnetic Observations at Dourbes (20 Jun 2016 - 26 Jun 2016)
Review of ionospheric activity (20 Jun 2016 - 26 Jun 2016)
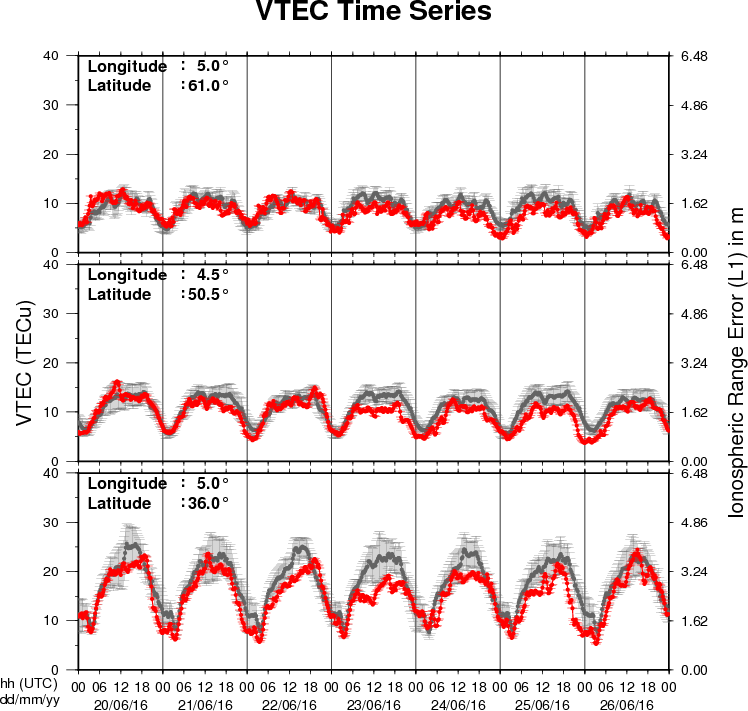
The figure shows the time evolution of the Vertical Total Electron Content (VTEC) (in red) during the last week at three locations:
a) in the northern part of Europe(N61°, 5°E)
b) above Brussels(N50.5°, 4.5°E)
c) in the southern part of Europe(N36°, 5°E)
This figure also shows (in grey) the normal ionospheric behaviour expected based on the median VTEC from the 15 previous days.
The VTEC is expressed in TECu (with TECu=10^16 electrons per square meter) and is directly related to the signal propagation delay due to the ionosphere (in figure: delay on GPS L1 frequency).
The Sun's radiation ionizes the Earth's upper atmosphere, the ionosphere, located from about 60km to 1000km above the Earth's surface.The ionization process in the ionosphere produces ions and free electrons. These electrons perturb the propagation of the GNSS (Global Navigation Satellite System) signals by inducing a so-called ionospheric delay.
See http://stce.be/newsletter/GNSS_final.pdf for some more explanations ; for detailed information, see http://gnss.be/ionosphere_tutorial.php
Future Events
For more details, see http://www.spaceweather.eu/en/event/future
Global Modelling of the Space Weather Chain in Helsinki, Finland
Start : 2016-10-24 - End : 2016-10-28
This event brings together solar, heliospheric, magnetospheric,
and ionospheric communities to discuss the current state and future
challenges in global modelling of the entire space weather chain.
Major developments in forecasting space weather, and understanding
the effects of solar eruptions requires increased communication and
collaboration of these often rather distinct communities. We
welcome submissions from these modelling communities and also
synergetic studies utilising both observations and numerical
models.
Website:
https://pnst.ias.u-psud.fr/sites/pnst/files/global_modelling_space_weather_oct2016.pdf
European Space Weather Week in Ostend, Belgium
Start : 2016-11-14 - End : 2016-11-18
The ESWW is the main annual event in the European Space Weather
calendar. It is the European forum for Space Weather as proven by
the high attendance to the past editions. The agenda will be
composed of plenary/parallel sessions, working meetings and
dedicated events for service end-users. The ESWW will again adopt
the central aim of bringing together the diverse groups in Europe
working on different aspects of Space Weather.
Website:
http://www.stce.be/esww13/
Solar Orbiter Workshop 7: Exploring the solar environs in Granada, Spain
Start : 2017-04-03 - End : 2017-04-06
This event will be hosted by the Instituto de Astrofisica de
Andalucia - CSIC. Please mind that on April 7th the 20th SWT
meeting will take place at the same venue.
Website: Unkown