- Table of Content
- 1.SC24 highlight...
- 2.Review of sola...
- 3.The Internatio...
- 4.PROBA2 Observa...
- 5.Review of geom...
- 6.Geomagnetic Ob...
- 7.Review of iono...
- 8.Future Events
- 9.New documents ...
2. Review of solar activity
3. The International Sunspot Number
4. PROBA2 Observations (4 Jul 2016 - 10 Jul 2016)
5. Review of geomagnetic activity
6. Geomagnetic Observations at Dourbes (4 Jul 2016 - 10 Jul 2016)
7. Review of ionospheric activity (4 Jul 2016 - 10 Jul 2016)
8. Future Events
9. New documents in the European Space Weather Portal Repository
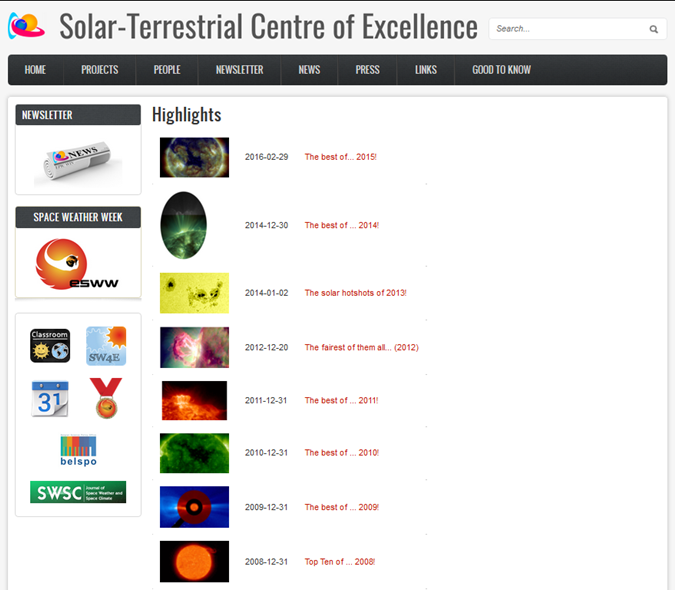
SC24 highlights page
Every year, the STCE publishes a news item with an overview of the most memorable solar and space weather highlights. These include spectacular solar flares, impressive filament eruptions, huge coronal holes, and much more. Each time, a movie is compiled with several clips of each event. As it also makes reference to the associated effects such as strong geomagnetic storms, aurora sightings, extremes in solar wind parameters, and number of strong flares, the news item provides at the same time a brief status of the ongoing solar cycle.
The first such overview was written for 2012, and since then, 3 more have followed. As the current solar cycle 24 had its minimum in December 2008, an effort was made to catch up with activity from 2008 till 2011. Hence, for each of these 4 years, an article and associated movie have been created providing an overview of the most interesting events. All 8 overviews have now been put together on a dedicated page at the STCE website: http://www.stce.be/highlights
The 4 new movies (2008-2011) have been created with the 2016 version of the fabulous JHelioviewer software (http://www.jhelioviewer.org/ ). The versatility and incredible, new features of this imaging and data display tool make these movies clearly superior in quality than those from 2012 and 2013. Aside the solar cycle evolution, the 8 years also show the rise and importance of solar imaging satellites such as SDO, STEREO and PROBA2, as well as the critical key observations that are performed by satellites such as SOHO and ACE.
We wish you an enjoyable time watching the movies and reading the summaries!
Review of solar activity
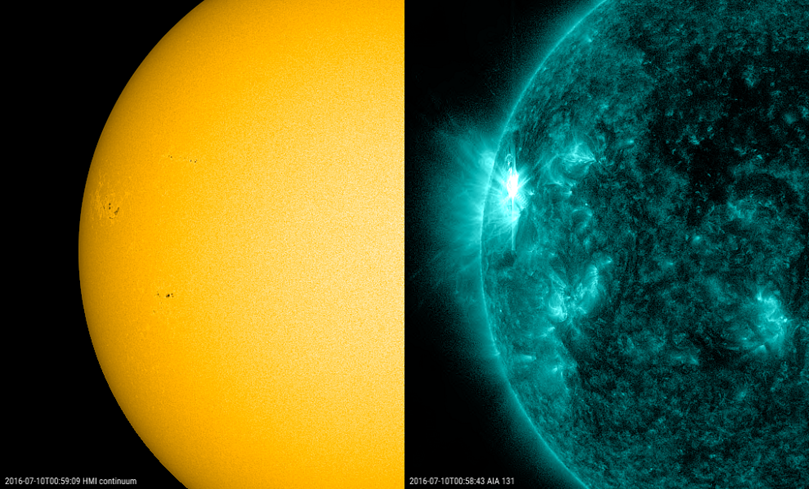
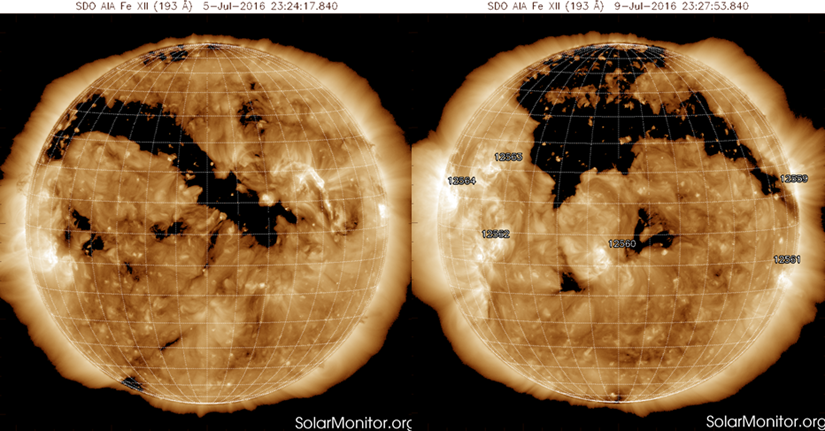
Solar activity was low to very low during the week. Six active regions were observed throughout the week, of which NOAA 2564 was the most complex one. This region produced three of the four recorded C-class flares, including the strongest event of the week (a C8.6 flare peaking on 10 July at 00:59UT - see imagery underneath). NOAA 2561 produced the first C-class flare of the series, a C5 event on 7 July.
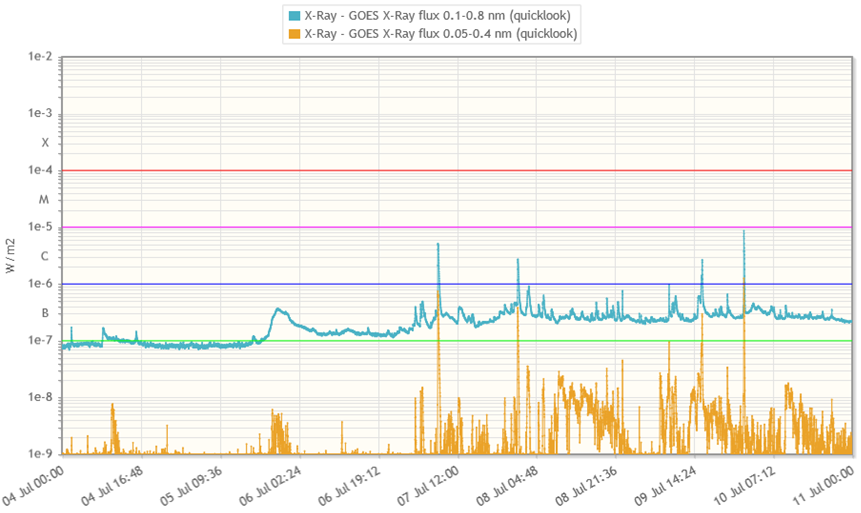
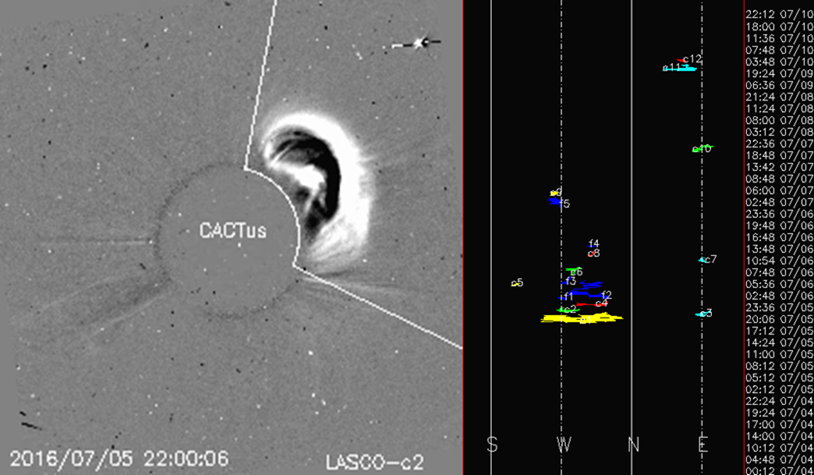
A filament eruption occurred late on 5 July, causing a partial halo coronal mass ejection (CME) with an apparent width of 100 degrees (see the CACTus website at http://www.sidc.oma.be/cactus/out/latestCMEs.html ). The CME propagated northwest of the Sun-Earth line. The filament eruption also resulted in an enhancement of the x-ray flux.
The International Sunspot Number
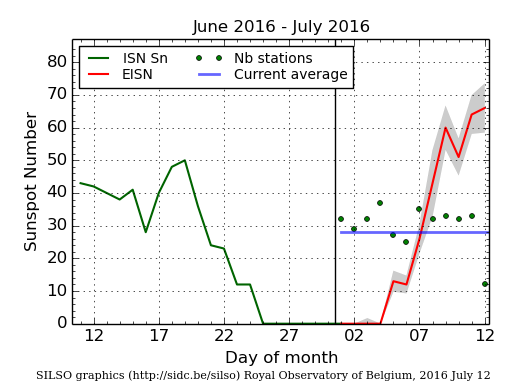
The daily Estimated International Sunspot Number (EISN, red curve with shaded error) derived by a simplified method from real-time data from the worldwide SILSO network. It extends the official Sunspot Number from the full processing of the preceding month (green line). The plot shows the last 30 days (about one solar rotation). The horizontal blue line shows the current monthly average, while the green dots give the number of stations included in the calculation of the EISN for each day.
PROBA2 Observations (4 Jul 2016 - 10 Jul 2016)
Solar Activity
Solar flare activity fluctuated between very low and low during the week.
In order to view the activity of this week in more detail, we suggest to go to the following website from which all the daily (normal and difference) movies can be accessed:
http://proba2.oma.be/ssa
This page also lists the recorded flaring events.
A weekly overview movie can be found here (SWAP week 328).
http://proba2.oma.be/swap/data/mpg/movies/weekly_movies/weekly_movie_2016_07_04.mp4
Details about some of this week's events, can be found further below.
Friday Jul 08
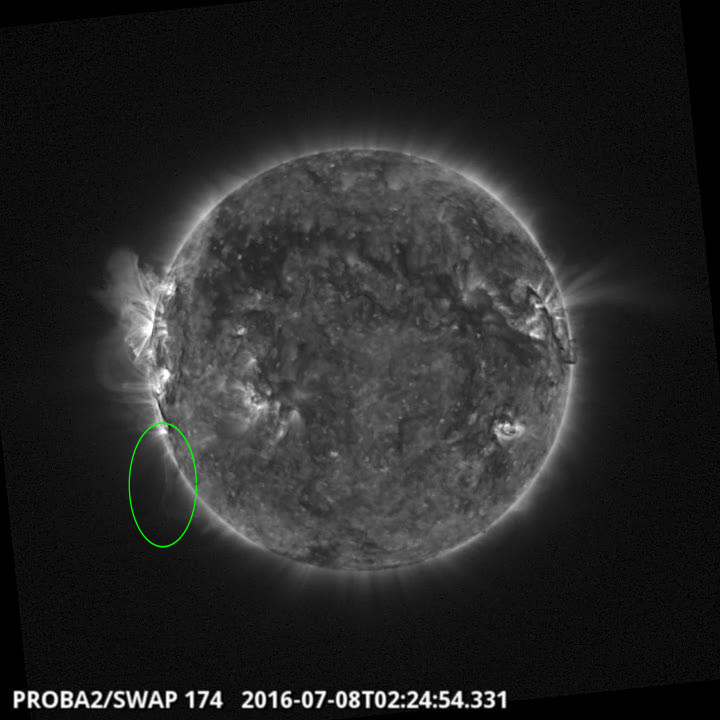
A moving filament was observed by SWAP on the east limb of the Sun on 2016Jul08 at 02:24
UT
Find a movie of the events here (SWAP movie)
http://proba2.oma.be/swap/data/mpg/movies/20160708_swap_movie.mp4
Saturday Jul 09
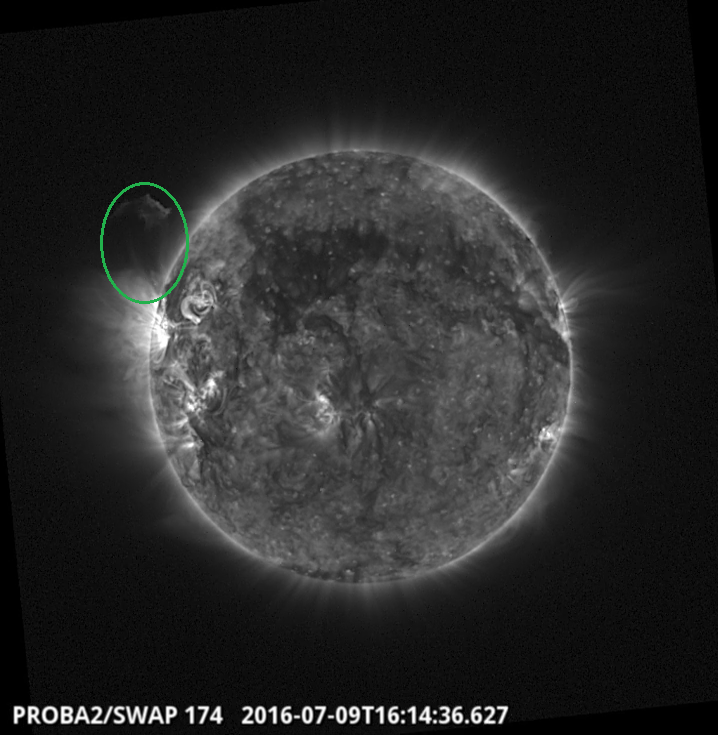
A C2.6 class flare was observed by SWAP on the northeast limb of the Sun on 2016Jul09 at
16:14 UT
Find a movie of the events here (SWAP movie)
http://proba2.oma.be/swap/data/mpg/movies/20160709_swap_movie.mp4
Sunday Jul 10
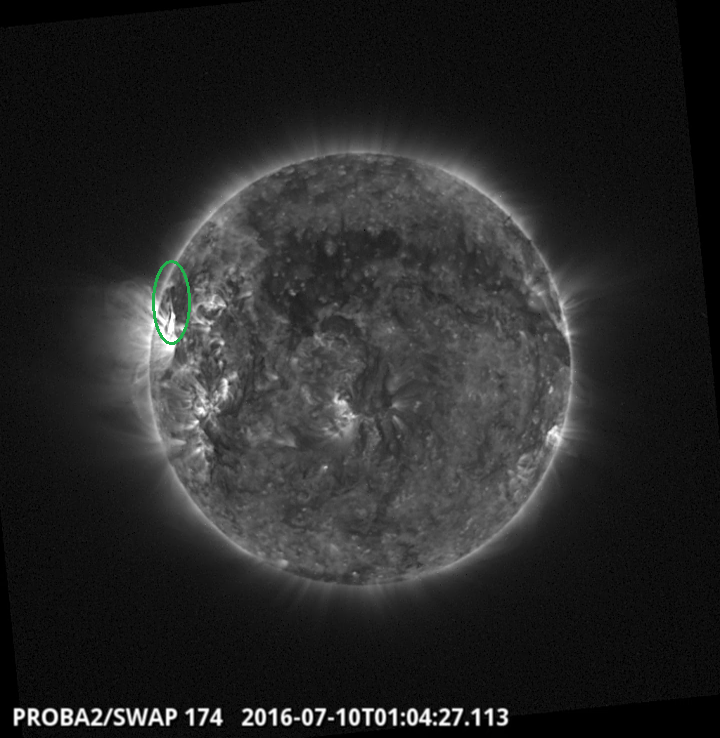
A C8.2 class flare was observed by SWAP on the northeast limb of the Sun on 2016Jul10 at
01:04 UT
Find a movie of the events here(SWAP movie)
http://proba2.oma.be/swap/data/mpg/movies/20160710_swap_movie.mp4
Review of geomagnetic activity
The solar wind observed by ACE was disturbed by a co-rotating interaction region (CIR), followed by a coronal hole high speed stream (CH HSS) starting at the end of 6 July (UT time).
The phi angle (direction of the interplanetary magnetic field ; blue curve underneath) started the week with a negative orientation (towards the Sun), but turned to a positive one (away from the Sun) at the start of the disturbance. The magnitude of the magnetic field (white curve) reached a maximum of 14 nT, with a fluctuating north-south component (red curve). The solar wind speed (yellow curve) went up to 650 km/s.
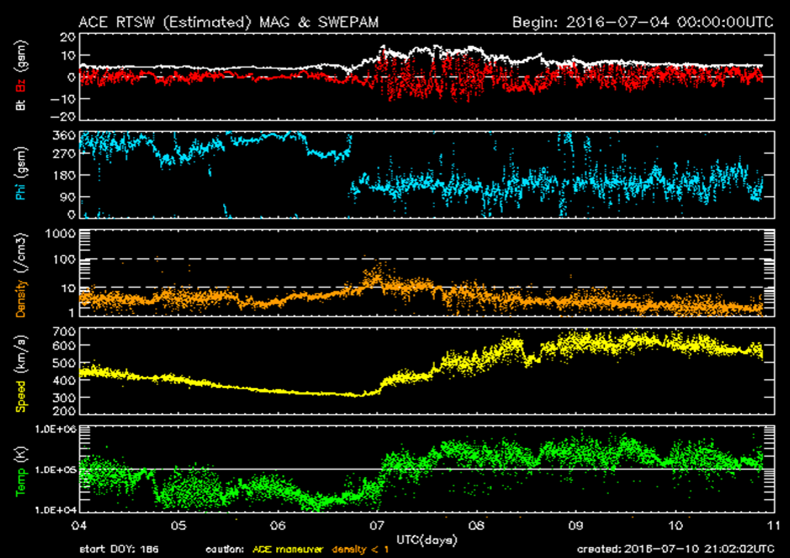
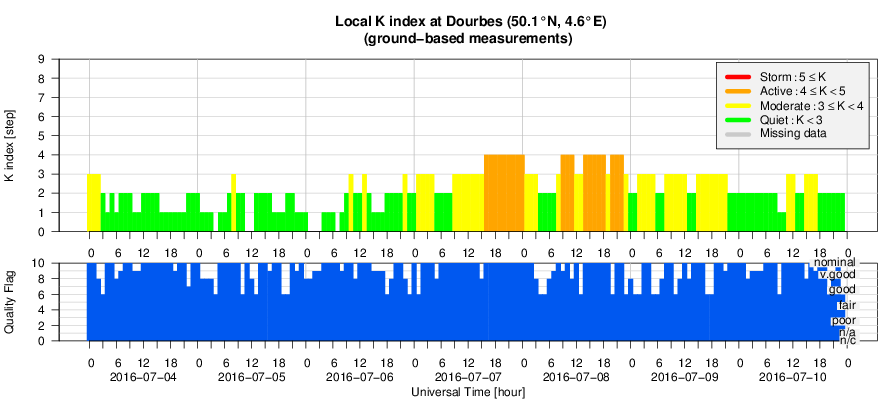
Geomagnetic levels up to K=4 were reached (at local level in Dourbes, at global level in Potzdam) and even up to K=5 (at global level in NOAA estimated Kp) on 7 and 8 July. Quiet to unsettled conditions were recorded for the remainder of the week.
Geomagnetic Observations at Dourbes (4 Jul 2016 - 10 Jul 2016)
Review of ionospheric activity (4 Jul 2016 - 10 Jul 2016)
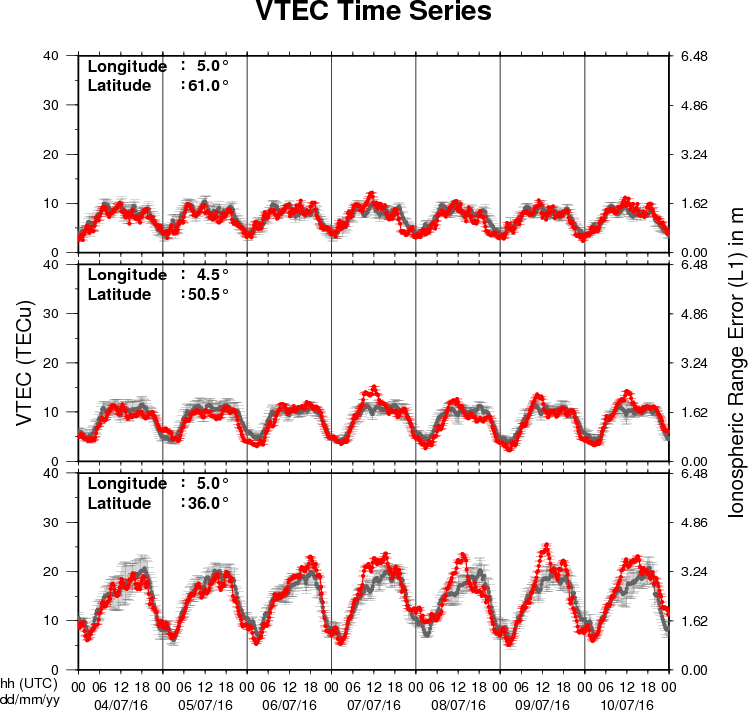
The figure shows the time evolution of the Vertical Total Electron Content (VTEC) (in red) during the last week at three locations:
a) in the northern part of Europe(N61°, 5°E)
b) above Brussels(N50.5°, 4.5°E)
c) in the southern part of Europe(N36°, 5°E)
This figure also shows (in grey) the normal ionospheric behaviour expected based on the median VTEC from the 15 previous days.
The VTEC is expressed in TECu (with TECu=10^16 electrons per square meter) and is directly related to the signal propagation delay due to the ionosphere (in figure: delay on GPS L1 frequency).
The Sun's radiation ionizes the Earth's upper atmosphere, the ionosphere, located from about 60km to 1000km above the Earth's surface.The ionization process in the ionosphere produces ions and free electrons. These electrons perturb the propagation of the GNSS (Global Navigation Satellite System) signals by inducing a so-called ionospheric delay.
See http://stce.be/newsletter/GNSS_final.pdf for some more explanations ; for detailed information, see http://gnss.be/ionosphere_tutorial.php
Future Events
For more details, see http://www.spaceweather.eu/en/event/future
Global Modelling of the Space Weather Chain in Helsinki, Finland
Start : 2016-10-24 - End : 2016-10-28
This event brings together solar, heliospheric, magnetospheric,
and ionospheric communities to discuss the current state and future
challenges in global modelling of the entire space weather chain.
Major developments in forecasting space weather, and understanding
the effects of solar eruptions requires increased communication and
collaboration of these often rather distinct communities. We
welcome submissions from these modelling communities and also
synergetic studies utilising both observations and numerical
models.
Website:
https://pnst.ias.u-psud.fr/sites/pnst/files/global_modelling_space_weather_oct2016.pdf
European Space Weather Week in Ostend, Belgium
Start : 2016-11-14 - End : 2016-11-18
The ESWW is the main annual event in the European Space Weather
calendar. It is the European forum for Space Weather as proven by
the high attendance to the past editions. The agenda will be
composed of plenary/parallel sessions, working meetings and
dedicated events for service end-users. The ESWW will again adopt
the central aim of bringing together the diverse groups in Europe
working on different aspects of Space Weather.
Website:
http://www.stce.be/esww13/
Solar Orbiter Workshop 7: Exploring the solar environs in Granada, Spain
Start : 2017-04-03 - End : 2017-04-06
This event will be hosted by the Instituto de Astrofisica de
Andalucia - CSIC. Please mind that on April 7th the 20th SWT
meeting will take place at the same venue.
Website: Unkown