- Table of Content
- 1.PROBA2's 45 X-...
- 2.PROBA2 Observa...
- 3.Review of sola...
- 4.The Internatio...
- 5.Noticeable Sol...
- 6.Review of geom...
- 7.Geomagnetic Ob...
- 8.Review of iono...
- 9.Future Events
2. PROBA2 Observations (28 Nov 2016 - 4 Dec 2016)
3. Review of solar activity (28 Nov 2016 - 4 Dec 2016)
4. The International Sunspot Number
5. Noticeable Solar Events (28 Nov 2016 - 4 Dec 2016)
6. Review of geomagnetic activity
7. Geomagnetic Observations at Dourbes (28 Nov 2016 - 4 Dec 2016)
8. Review of ionospheric activity (28 Nov 2016 - 4 Dec 2016)
9. Future Events
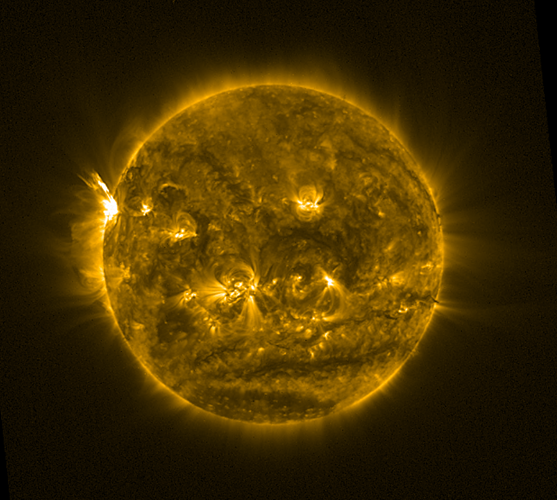
PROBA2's 45 X-class flares
The PROBA2 satellite (http://proba2.oma.be/ ) was launched in November 2009, well in time to catch the first X-class flare of the new solar cycle (15 February 2011). The "X" in X-class flares stands for "eXtreme", and that's exactly what these flares are: the strongest class of x-ray flares that the Sun can produce.
Since then, various active regions on the Sun have produced a total of 45 X-class flares. All these were observed by the PROBA2's extreme ultraviolet (EUV) imager SWAP and its soft X-ray to mid-ultraviolet irradiance monitor LYRA, the 08 November 2013 flare being the sole exception. The folks from the PROBA2 team made a very nice collage of these events. For each X-class flare, they put a SWAP picture together with a LYRA graph. The astonishing result can be seen at the PROBA2's website http://proba2.oma.be/SWT14announcement
The poster (http://proba2.oma.be/sites/default/files/field/image/Flares%20Poster.jpg ) contains also additional information on flares and instruments, and was presented at the most recent ESWW13 (http://www.stce.be/esww13/ ).

Forty-five X-class events for one solar cycle is not that much, compared to e.g. the 126 observed during the previous solar cycle (SC23). The last X-class event already dates back from 05 May 2015, that's 1.5 years ago! Though we are well in the declining phase of the current solar cycle, the emergence of a magnetically complex region remains possible, and thus a chance remains on one or a few X-class flares before the next cycle minimum. Above image shows SWAP's first X-class flare (15 February 2011; X2.2), and the image underneath shows the -for the moment- last observed X-class event (05 May 2015; X2.7).
PROBA2 Observations (28 Nov 2016 - 4 Dec 2016)
Solar Activity
Solar flare activity fluctuated between very low and moderate during the week.
In order to view the activity of this week in more detail, we suggest to go to the following website from which all the daily (normal and difference) movies can be accessed: http://proba2.oma.be/ssa
This page also lists the recorded flaring events.
A weekly overview movie can be found here (SWAP week 349).
http://proba2.oma.be/swap/data/mpg/movies/weekly_movies/weekly_movie_2016_11_28.mp4
Details about some of this week’s events, can be found further below.
If any of the linked movies are unavailable they can be found in the P2SC movie repository here
http://proba2.oma.be/swap/data/mpg/movies/
Monday Nov 28
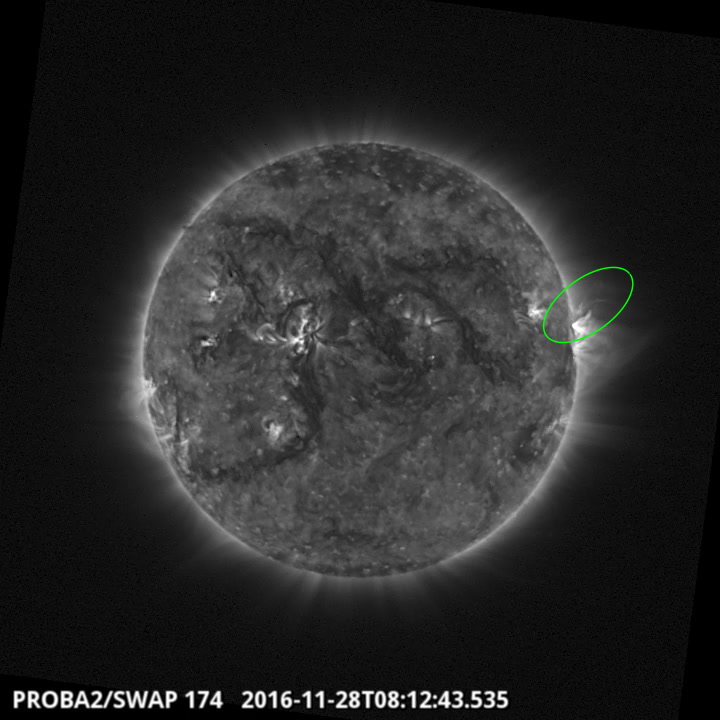
An eruption was observed by SWAP on the west limb of the Sun on 2016-Nov-28 at 08:12 UT
Find a movie of the event here (SWAP movie)
http://proba2.oma.be/swap/data/mpg/movies/20161128_swap_movie.mp4
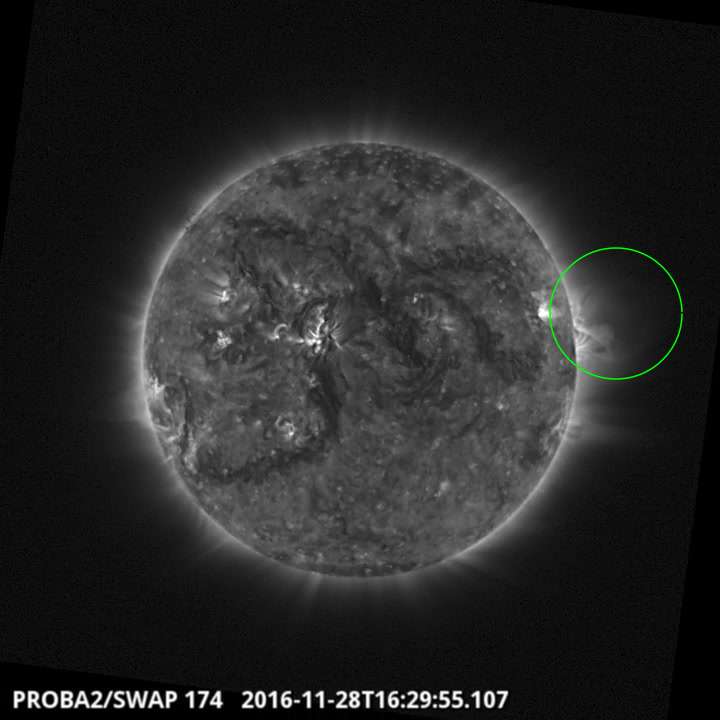
An eruption was observed by SWAP on the west limb of the Sun on 2016-Nov-28 at 16:29 UT
Find a movie of the event here (SWAP movie)
http://proba2.oma.be/swap/data/mpg/movies/20161128_swap_movie.mp4
Sunday Dec 04
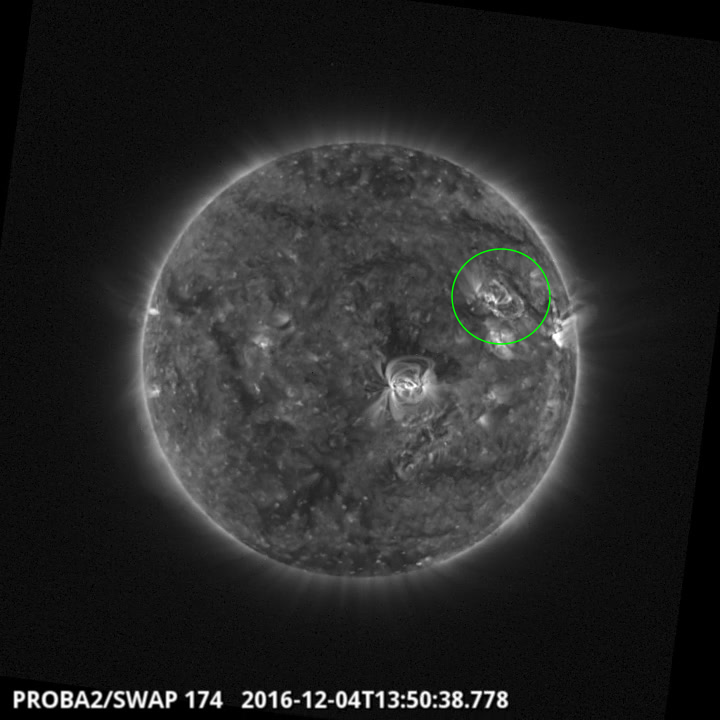
An eruption was observed by SWAP in the north west quadrant of the Sun on 2016-Dec-04 at
13:50 UT
Find a movie of the event here (SWAP movie)
http://proba2.oma.be/swap/data/mpg/movies/20161204_swap_movie.mp4
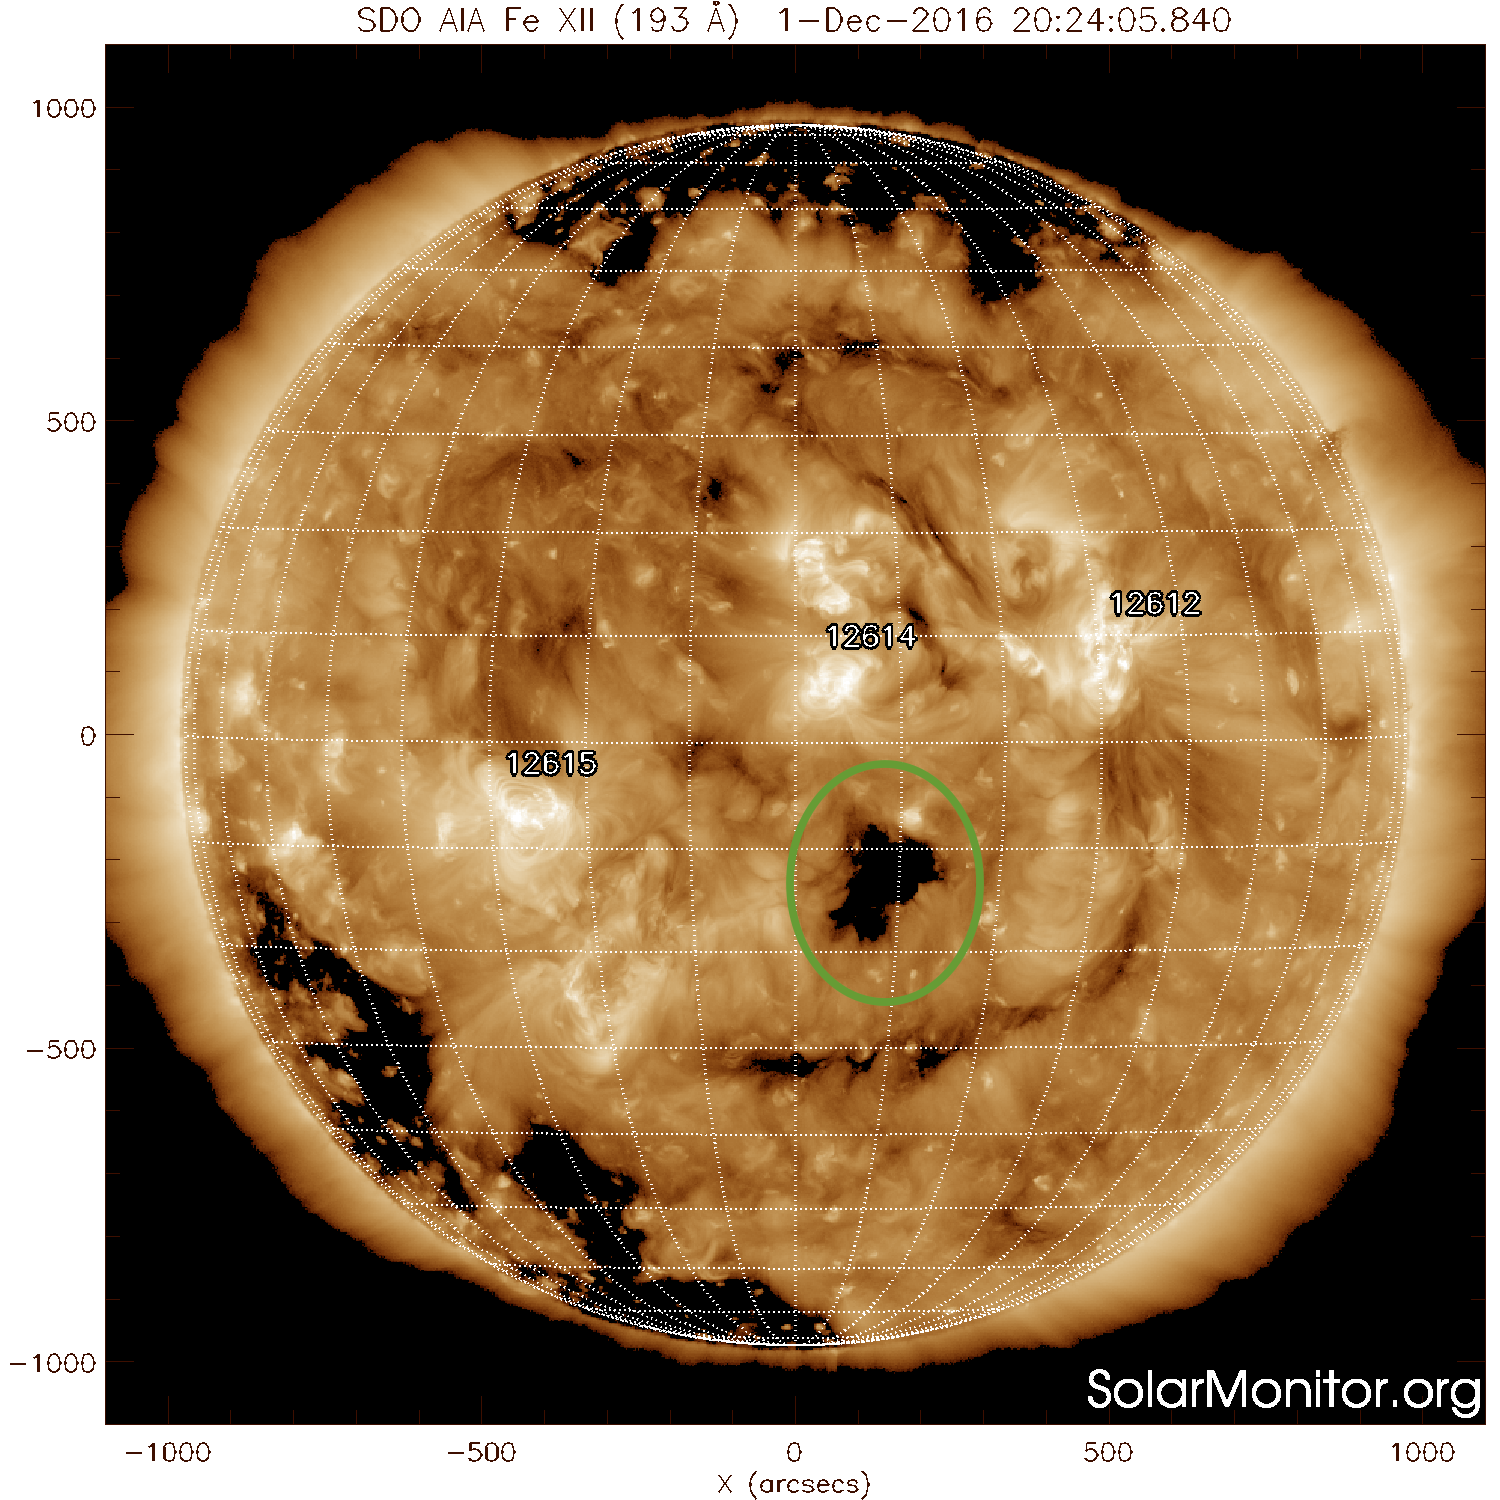
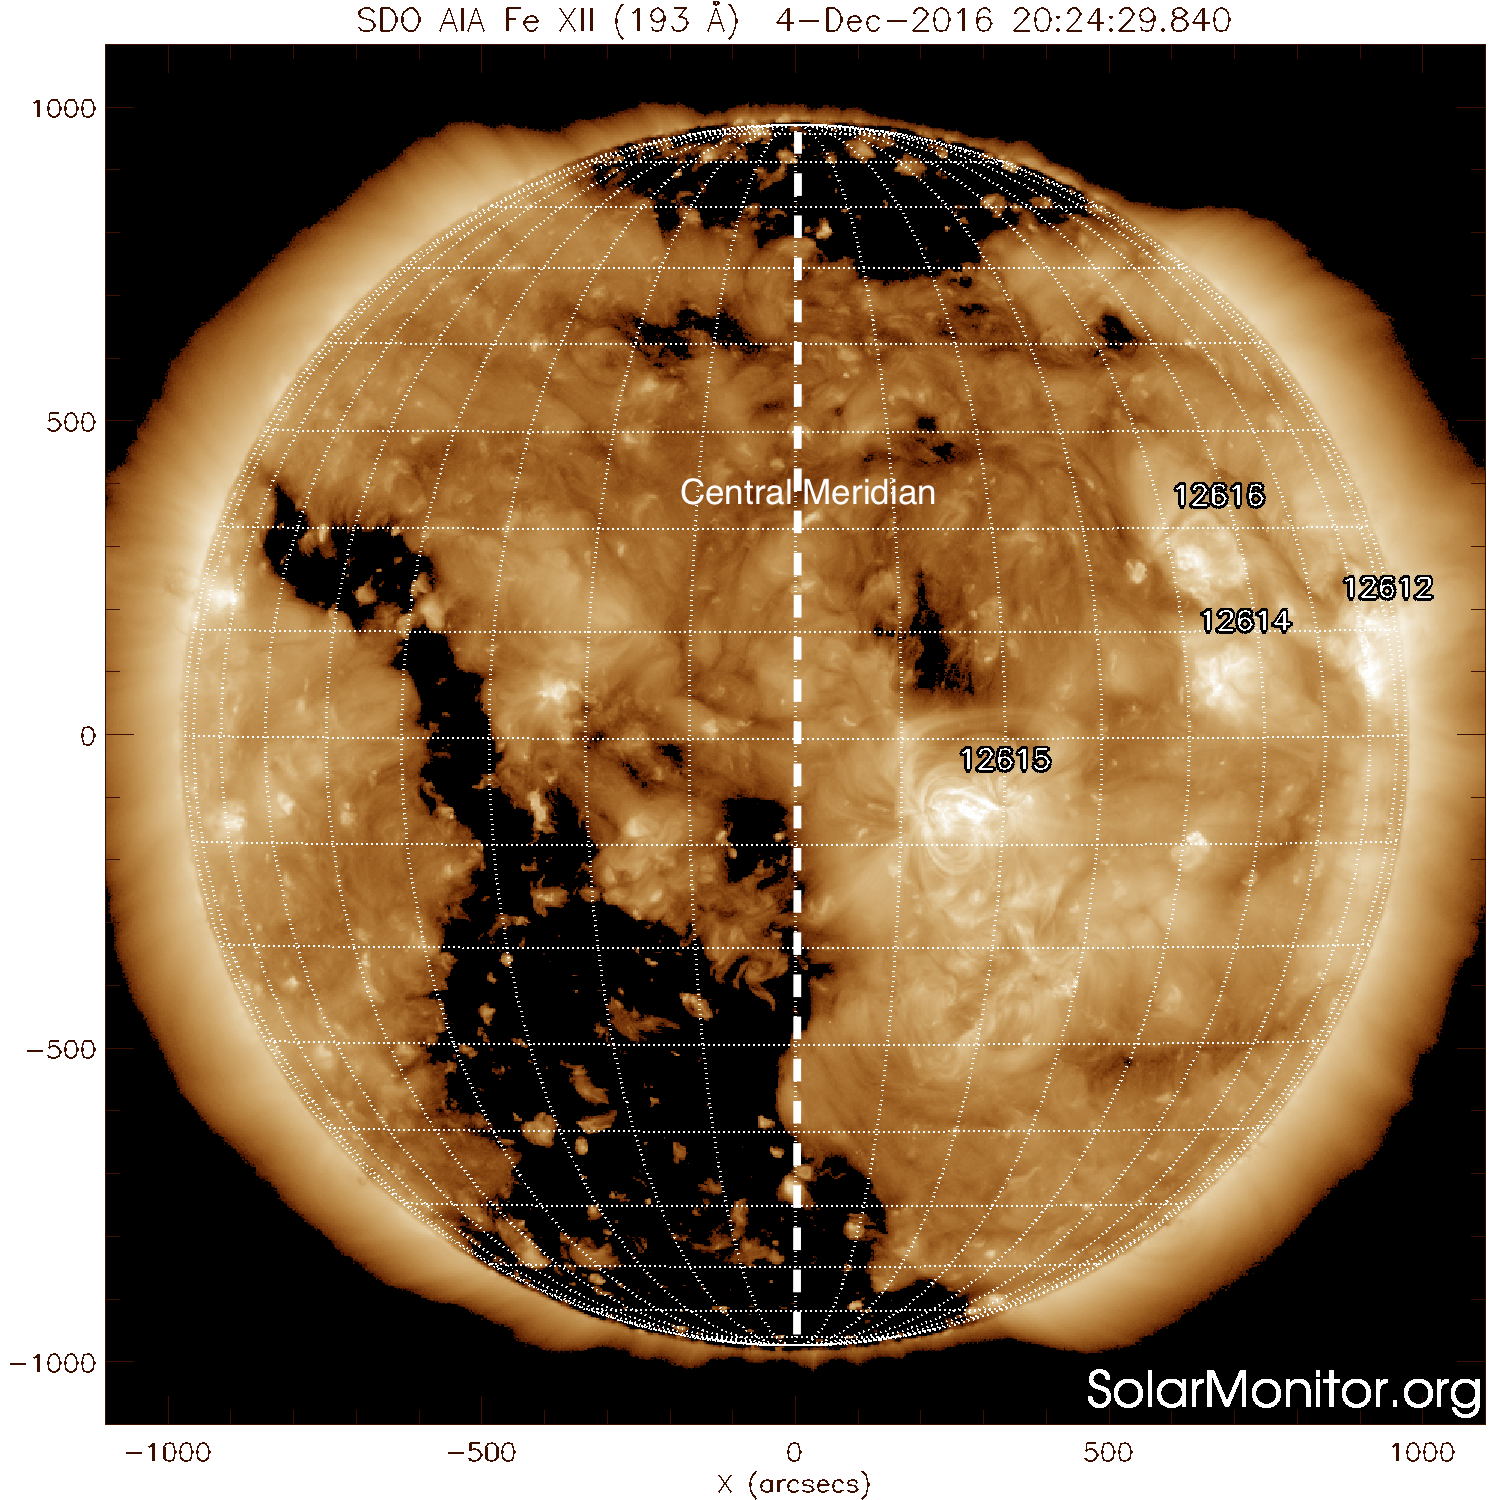
Review of solar activity (28 Nov 2016 - 4 Dec 2016)
Solar activity ranged from very low to moderate. NOAA 2615 started to develop on 28 November near the east limb as a small but magnetically complex region with a small delta in its middle portion. It was the source of 2 M1 flares on 29 November.
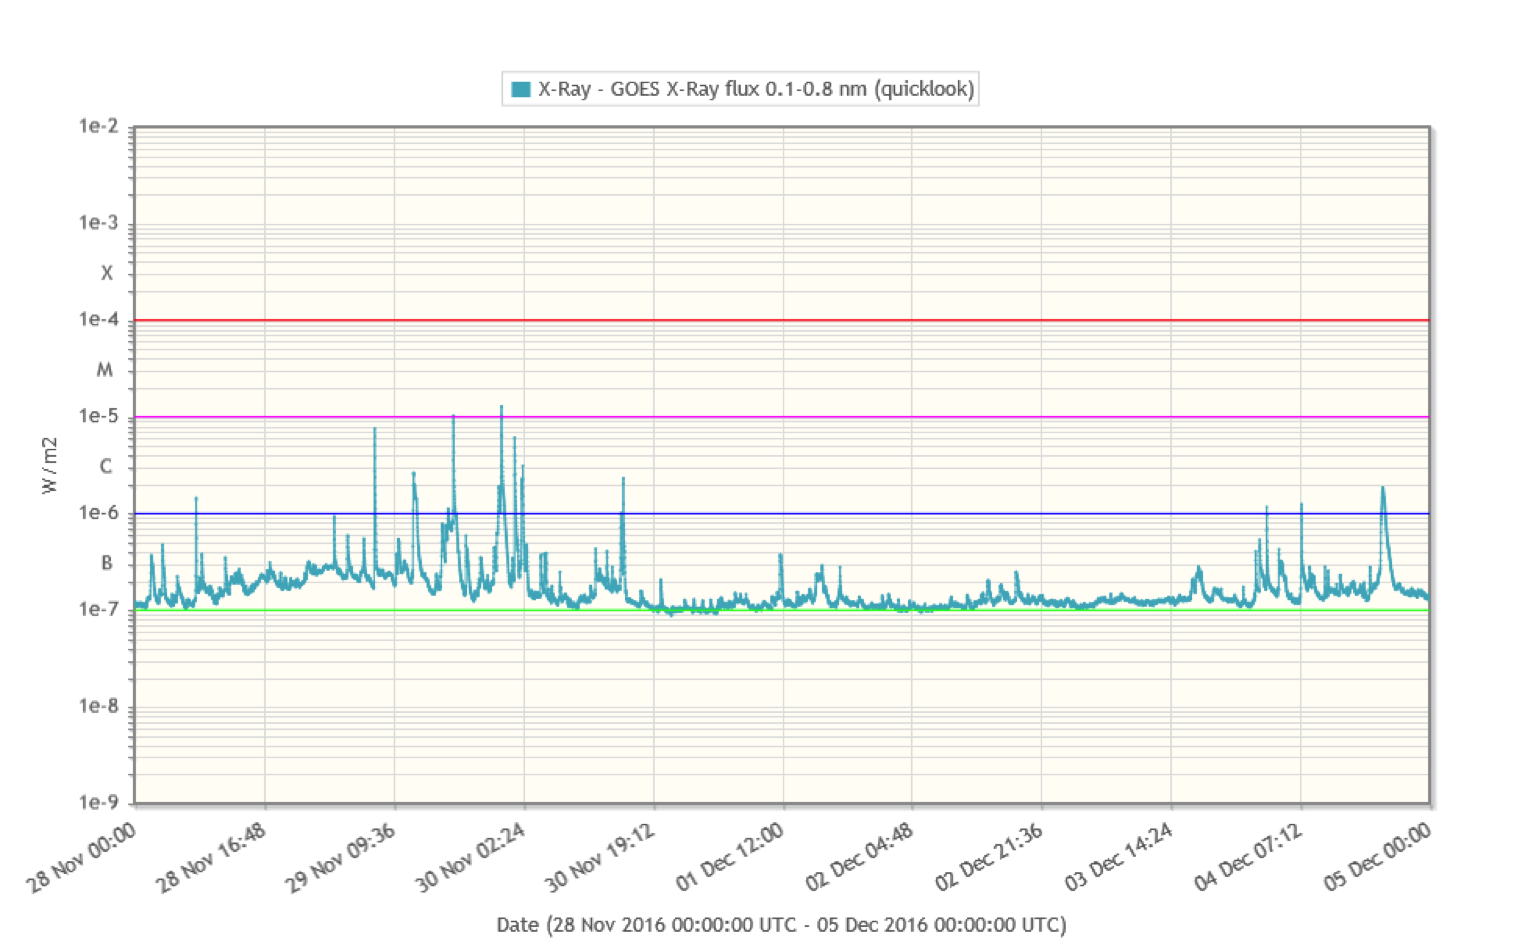
The region gradually gained sunspot area, but became flare quiet after 30 November with flaring below C-class level on 1, 2 and 3 December. On 4 December, continuing its growth, new opposite polarity flux emerged in the spot's middle and trailing section resulting in renewed C-class flare activity.
The solar surface in visible light on 30 November, by SDO/HMI:
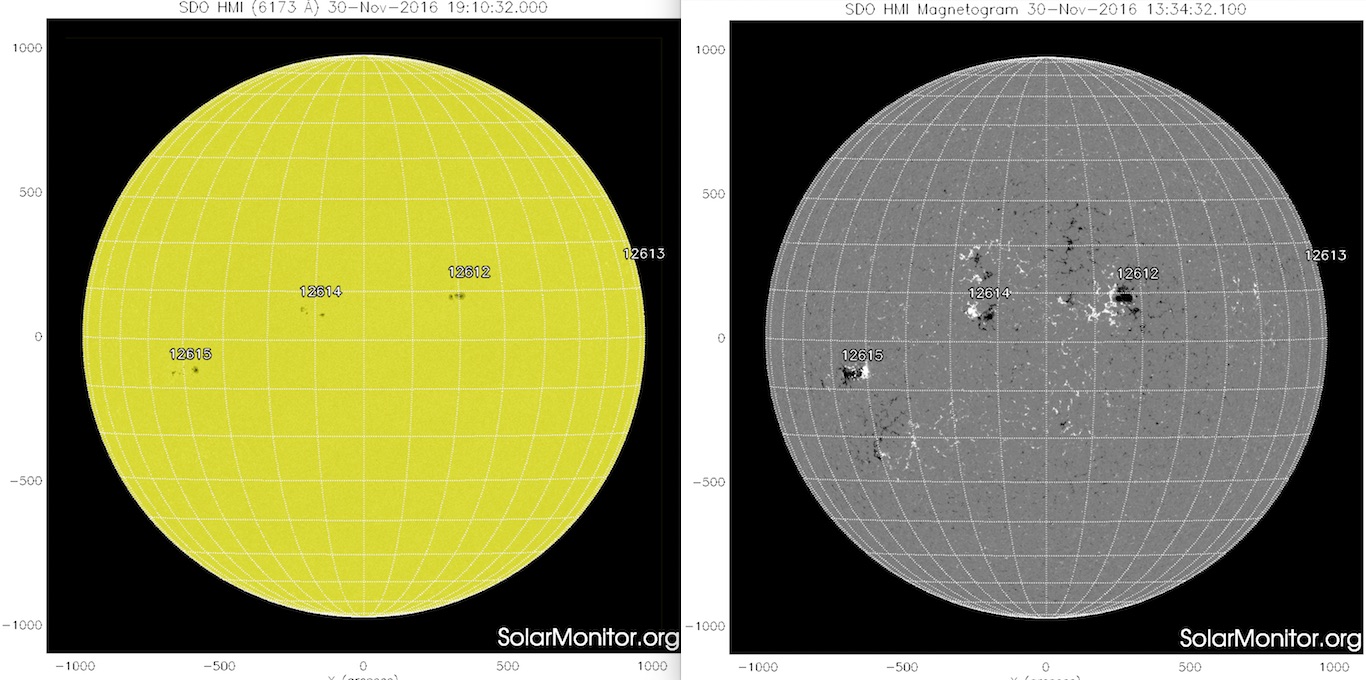
A SDO/HMI movie, 28/11 - 04/12: http://www.stce.be/movies/20161204200336_512_hmiif.mp4
A SDO/HMI magnetogram movie, 28/11 - 04/12: http://www.stce.be/movies/20161204200923_512_hmib.mp4
A movie on the M1.0 and M1.2 flares on 29 November, the first M-class flares since 07 August 2016: http://www.stce.be/movies/20161129_JHV.mp4
Four other sunspot regions were on disk during the week, but they were quiet.
No earth-directed coronal mass ejections (CMEs) were observed in available coronagraphic imagery. The greater than 10MeV proton flux was at nominal levels.
The International Sunspot Number
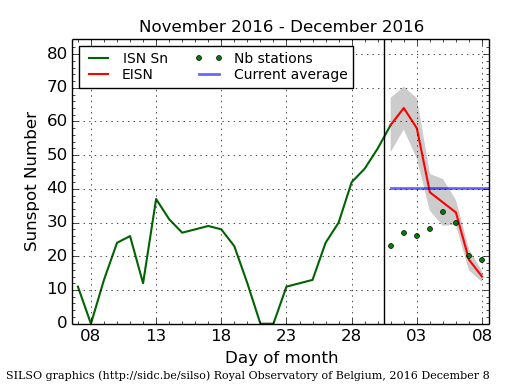
The daily Estimated International Sunspot Number (EISN, red curve with shaded error) derived by a simplified method from real-time data from the worldwide SILSO network. It extends the official Sunspot Number from the full processing of the preceding month (green line). The plot shows the last 30 days (about one solar rotation). The horizontal blue line shows the current monthly average, while the green dots give the number of stations included in the calculation of the EISN for each day.
Noticeable Solar Events (28 Nov 2016 - 4 Dec 2016)
| DAY | BEGIN | MAX | END | LOC | XRAY | OP | 10CM | TYPE | Cat | NOAA |
| 29 | 1719 | 1723 | 1726 | S7E55 | M1.0 | SN | 2615 | |||
| 29 | 2329 | 2338 | 2340 | S8E52 | M1.2 | SF | 2615 |
| LOC: approximate heliographic location | TYPE: radio burst type |
| XRAY: X-ray flare class | Cat: Catania sunspot group number |
| OP: optical flare class | NOAA: NOAA active region number |
| 10CM: peak 10 cm radio flux |
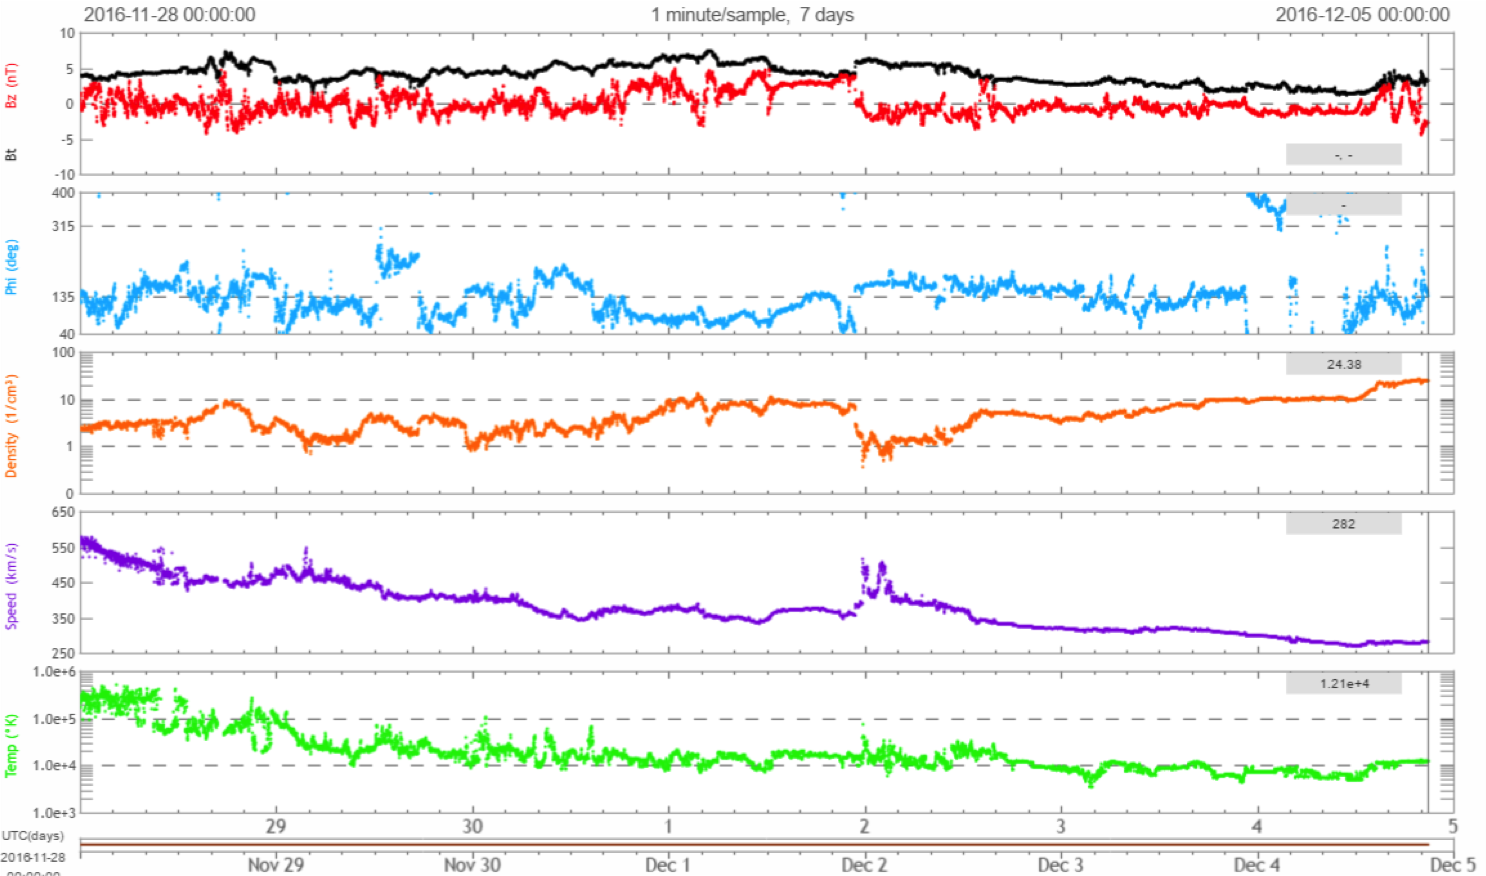
Review of geomagnetic activity
At the beginning of the week, the earth-environment recovered from the high speed stream from a large coronal hole. Solar wind speed continued its decline from about 600 km/s to 280 km/s by the end of the week. Bz fluctuated between -4 and +5 nT. The interplanetary magnetic field was mostly directed away from the Sun until 4 December, when there was some switching between towards and away from the Sun.
A small positive coronal at latitude S15 transited the solar disk, but no sign of the associated wind stream has been observed in DSCOVR data.
The extension of a large negative polar coronal hole was at the central meridian by the end of the period.
The geomagnetic field was mostly at quiet levels, except for some isolated unsettled episodes at the beginning of the week in response to the waning effects of the high speed stream from the coronal hole.
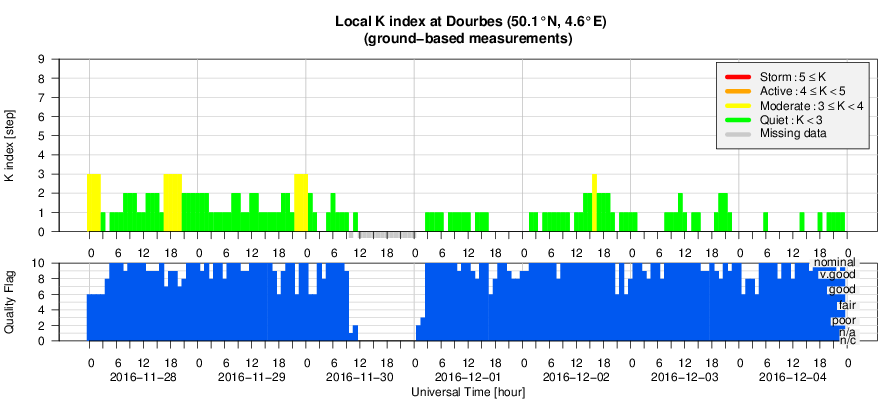
Geomagnetic Observations at Dourbes (28 Nov 2016 - 4 Dec 2016)
Review of ionospheric activity (28 Nov 2016 - 4 Dec 2016)
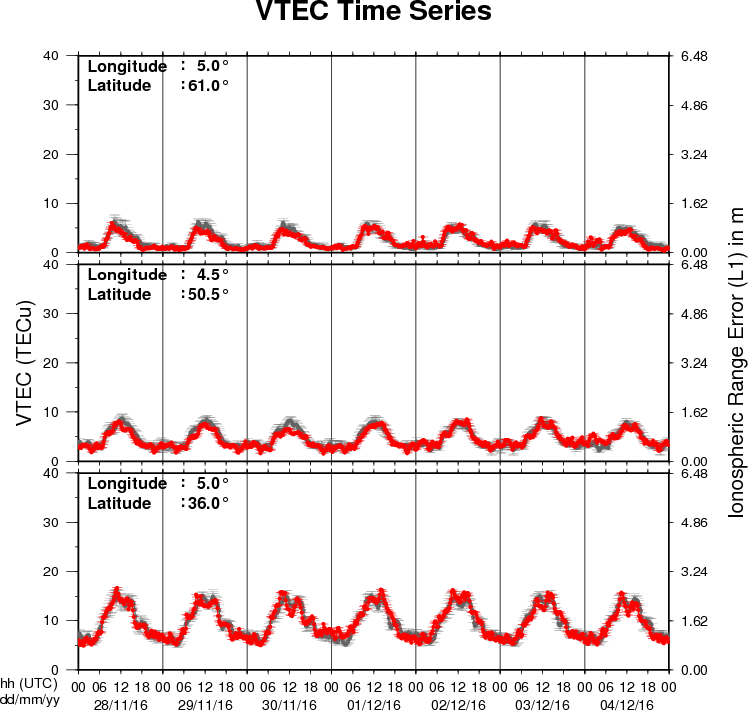
The figure shows the time evolution of the Vertical Total Electron Content (VTEC) (in red) during the last week at three locations:
a) in the northern part of Europe(N61°, 5°E)
b) above Brussels(N50.5°, 4.5°E)
c) in the southern part of Europe(N36°, 5°E)
This figure also shows (in grey) the normal ionospheric behaviour expected based on the median VTEC from the 15 previous days.
The VTEC is expressed in TECu (with TECu=10^16 electrons per square meter) and is directly related to the signal propagation delay due to the ionosphere (in figure: delay on GPS L1 frequency).
The Sun's radiation ionizes the Earth's upper atmosphere, the ionosphere, located from about 60km to 1000km above the Earth's surface.The ionization process in the ionosphere produces ions and free electrons. These electrons perturb the propagation of the GNSS (Global Navigation Satellite System) signals by inducing a so-called ionospheric delay.
See http://stce.be/newsletter/GNSS_final.pdf for some more explanations ; for detailed information, see http://gnss.be/ionosphere_tutorial.php
Future Events
For more details, see http://www.spaceweather.eu/en/event/future
4th SOLARNET Meeting: The Physics of the Sun from the Interior to the Outer Atmosphere, in Lanzarote (Spain)
Start : 2017-01-16 - End : 2017-01-20
The IV SOLARNET MEETING 'The physics of the Sun from the
interior to the outer atmosphere' will take place in Lanzarote
(Spain) from 16th to 20th of January 2017, organized by the
Instituto de AstrofÃsica de Canarias (IAC).
SOLARNET (High-resolution Solar Physics Network) is an EU-FP7
project coordinated by IAC with the aim of bringing together and
integrating the major European research infrastructures in the
field of high-resolution solar physics. SOLARNET involves all
pertinent European research institutions, infrastructures, and data
repositories. Networking activities, access to first-class
infrastructures and joint research and development activities are
being covered under SOLARNET to improve, in quantity and quality,
the service provided by this European community.
The purpose of this conference is to provide a coherent picture
of the Sun as a single physical system playing all the underlying
physical processes measured and observed in the solar atmosphere to
date.
Website:
http://www.iac.es/congreso/solarnet-4meeting/
Solar Orbiter Workshop 7: Exploring the solar environs in Granada, Spain
Start : 2017-04-03 - End : 2017-04-06
This event will be hosted by the Instituto de Astrofisica de
Andalucia - CSIC. Please mind that on April 7th the 20th SWT
meeting will take place at the same venue.
Website: Unkown