- Table of Content
- 1.Reappearance
- 2.PROBA2 Observa...
- 3.Review of sola...
- 4.SIDC space wea...
- 5.The Internatio...
- 6.Geomagnetic Ob...
- 7.Review of iono...
2. PROBA2 Observations (27 Nov 2017 - 3 Dec 2017)
3. Review of solar and geomagnetic activity
4. SIDC space weather briefing
5. The International Sunspot Number
6. Geomagnetic Observations at Dourbes (27 Nov 2017 - 3 Dec 2017)
7. Review of ionospheric activity (27 Nov 2017 - 3 Dec 2017)
Reappearance
Solar filaments are clouds of ionized gas above the solar surface squeezed between magnetic regions of opposite polarity. Being cooler and denser than the plasma underneath and their surroundings, they appear as dark lines when seen on the solar disk and as bright blobs when seen near the solar limb (then they are called "prominences"). Special filters are required to observe these features, and one such a filter is the Hydrogen-alpha (H-alpha) line in the red part of the solar spectrum. It shows the cool inner atmosphere of the Sun. Filaments can appear in e.g. sunspot regions, where they are called active region filaments. They can also appear completely isolated on the solar disk, and then they are called quiescent filaments. These can become very long and last for one or more solar rotations. Pending the stability of the surrounding magnetic regions, the longer filaments eventually may erupt.
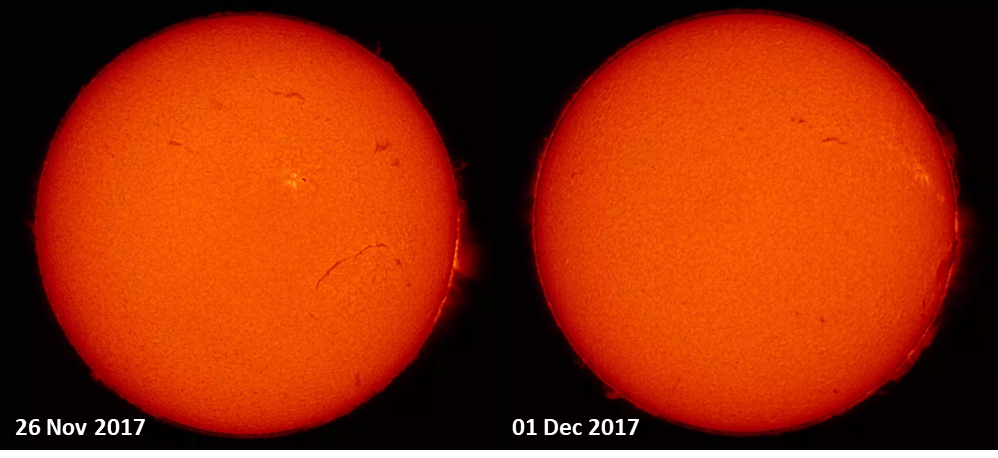
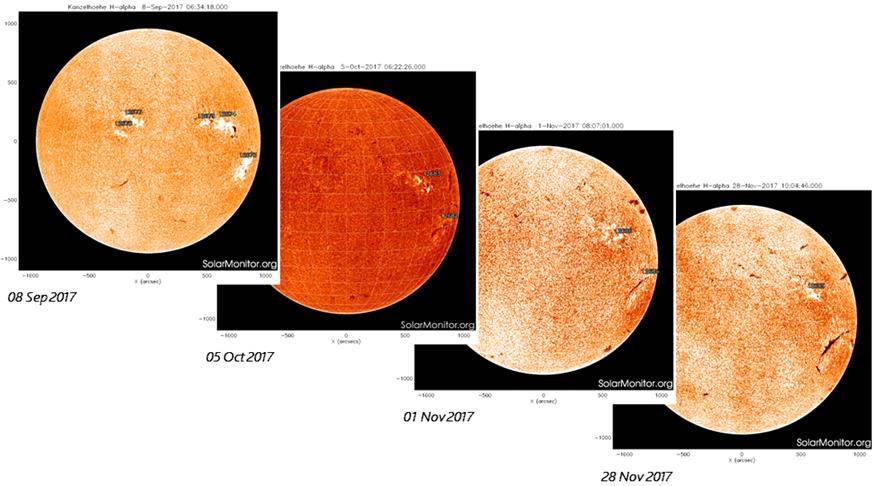
In the images above (see the animation at http://www.stce.be/news/409/welcome.html ), several filaments can be seen, and in particular one 40 degrees long filament in the southwestern solar quadrant. The images show an H-alpha picture from the GONG network (http://halpha.nso.edu/ ) overlaid on a extreme ultraviolet (EUV) picture in the SDO AIA 304 filter (https://sdo.gsfc.nasa.gov/ ). H-alpha depicts the Sun's atmosphere close to about 10,000 degrees, but AIA 304 images the Sun at temperatures between 50,000-100,000 degrees. Hence, as the filament rotates over the southwestern solar limb, the "cold" filament plasma (charged particles) shows up darkish against the somewhat hotter, brighter background as imaged by the AIA 304 filter. As can be seen, despite its length, the filament did not erupt and quietly rounded the solar limb, towering about 5 to 6 earth diameters above it.
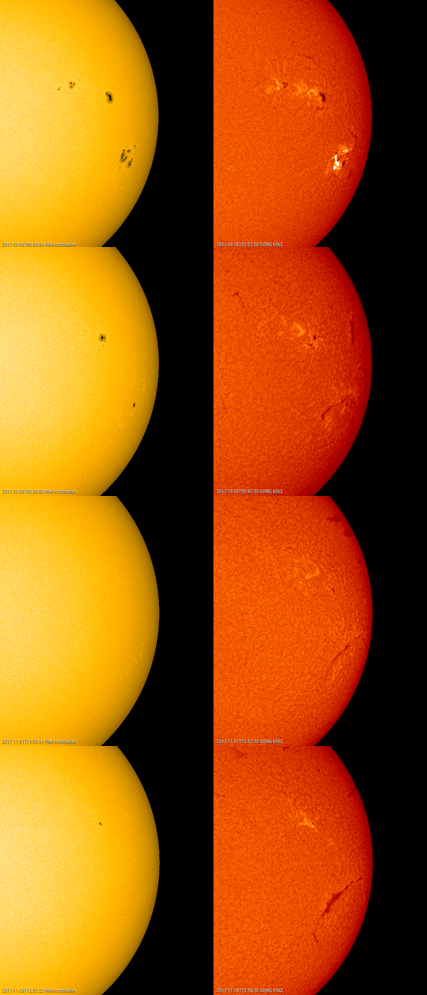
Trying to see how long this particular filament already survives, white light (SDO/HMI) and H-alpha imagery have been combined for the last 3 solar rotations (image above, for the dates of 8 September, 5 October, 1 November and 28 November. One arrives at the surprizing conclusion that this filament is in the same location as the active region NOAA 2673 early September this year (see e.g. http://www.stce.be/news/402/welcome.html and http://www.stce.be/news/400/welcome.html ), which was the source of the two most intense solar flares of the ongoing solar cycle 24. It is quite impressive that this filament is the still visible scar of the violent magnetic activity on the Sun more than 3 months ago. A reappearance of this filament within 2 weeks (around 14 December) is certainly not excluded.
PROBA2 Observations (27 Nov 2017 - 3 Dec 2017)
Solar Activity
Solar flare activity was very low during the week.
In order to view the activity of this week in more detail, we suggest to go to the following website from which all the daily (normal and difference) movies can be accessed: http://proba2.oma.be/ssa
This page also lists the recorded flaring events.
A weekly overview movie can be found here (SWAP week 401): http://proba2.oma.be/swap/data/mpg/movies/weekly_movies/weekly_movie_2017_11_27.mp4
Details about some of this week’s events, can be found further below.
If any of the linked movies are unavailable they can be found in the P2SC movie repository here: http://proba2.oma.be/swap/data/mpg/movies/
Thursday Nov 30
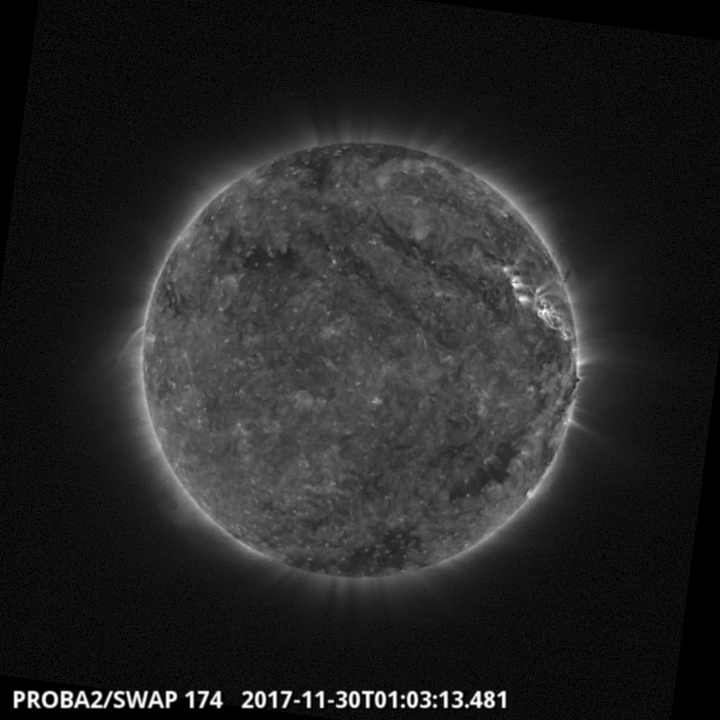
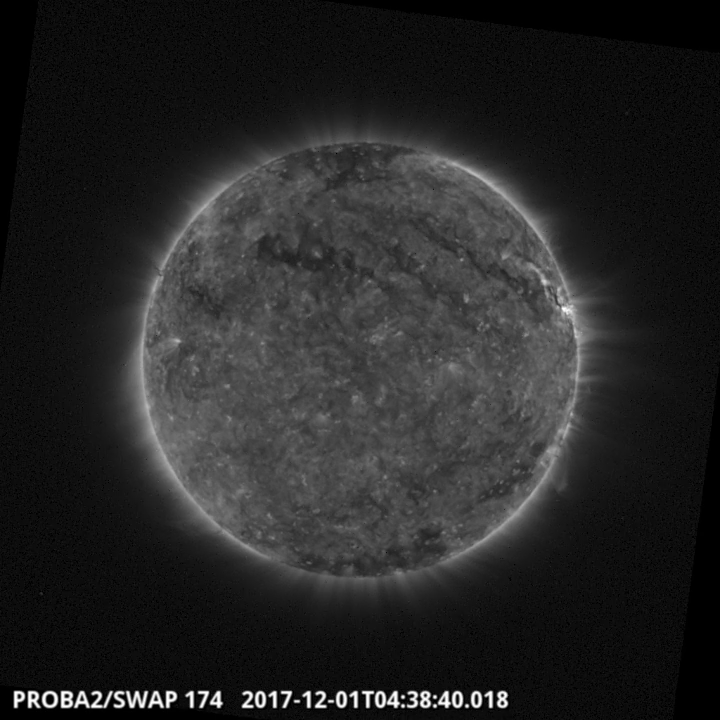
A 40 degrees long filament rotated over the southwestern solar limb and erupted on 2017-11-30 around 01:00 UT, see the SWAP image above. Find a movie of the events here (SWAP movie): http://proba2.oma.be/swap/movies/20171130_swap_movie.mp4
Friday Dec 01
Early on 1 December, the extension of a positive northern polar coronal hole started
transiting the central meridian. This Coronal hole was visible until the end of the week.
Find a movie of the event here (SWAP movie): http://proba2.oma.be/swap/movies/20171201_swap_movie.mp4
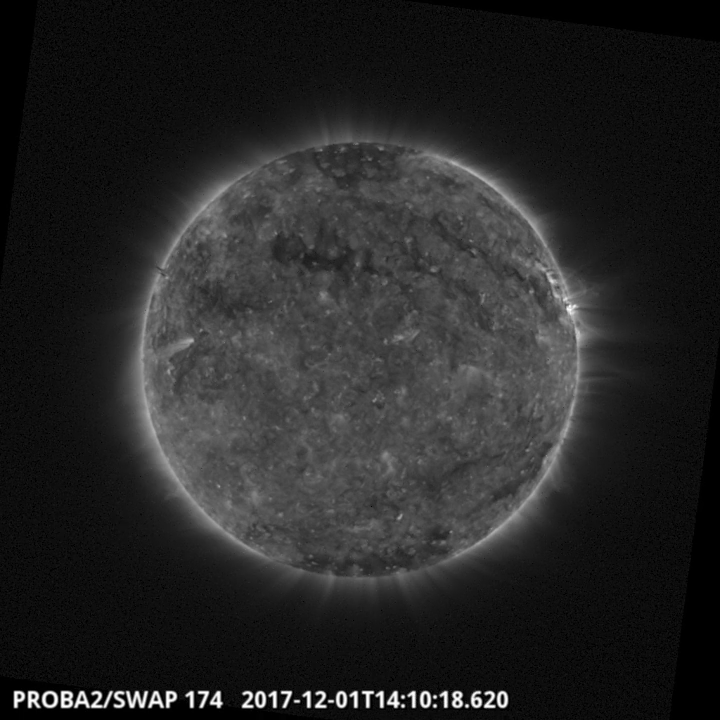
A B1.0 flare was produced from the single sunspot group (NOAA 2689) was observed by SWAP on 2017-Dec-01. The flare is visible on the Western limb of the Sun in the SWAP image above at 14:10 UT. Find a movie of the event here (SWAP movie): http://proba2.oma.be/swap/movies/20171201_swap_movie.mp4
Review of solar and geomagnetic activity
Solar Activity
Solar activity was very low. Decaying active region NOAA 2689 was the only visible sunspot group on the solar disk and produced a few low-level B-class flares. The Sun was reported spotless from 01 December onwards.
Early on 1 December, the extension of a positive northern polar coronal hole started transiting the central meridian.
A 40 degrees long filament rotated quietly over the southwestern solar limb. No earth-directed coronal mass ejections (CMEs) were observed throughout the week.
The greater than 10 MeV proton flux was at nominal levels.
Geomagnetic Activity
The earth environment was under the influence of a weak solar wind stream from the extensions of the negative southern polar coronal hole. Solar wind speed was at slightly enhanced levels with brief excursions to 490-530 km/s on 27, 28, 30 November and on 01 December.
By the end of the period, the solar wind speed was near 310 km/s. Bz varied mostly between -5 and +7 nT, except for two brief periods early on 28 and 30 November when Bz was around -9 nT. The interplanetary magnetic field was mostly directed towards the Sun, i.e. phi between 270 and 360 degrees.
Mostly quiet to unsettled geomagnetic conditions were observed throughout the week, with active intervals in Kp recorded early on 28 and 30 November. Geomagnetic activity was very low on 03 December with K-indices at 0 for several intervals.
SIDC space weather briefing
The Space Weather Briefing presented by the forecaster on duty from November 27 to December 3. It reflects in images and graphs what is written in the Solar and Geomagnetic Activity report.
pdf format: http://www.stce.be/briefings/SIDCbriefing-20171204.pdf
movie NOAA 2689: http://www.stce.be/briefings/20171204_JHV1.mp4
movie Small B-flare in NOAA 2689: http://www.stce.be/briefings/20171204_JHV2.mp4
movie Filaments: http://www.stce.be/briefings/20171204_JHV3.mp4
movie CME1: http://www.stce.be/briefings/20171204_JHV4.mp4
movie CME2: http://www.stce.be/briefings/20171204_JHV5.mp4
The International Sunspot Number
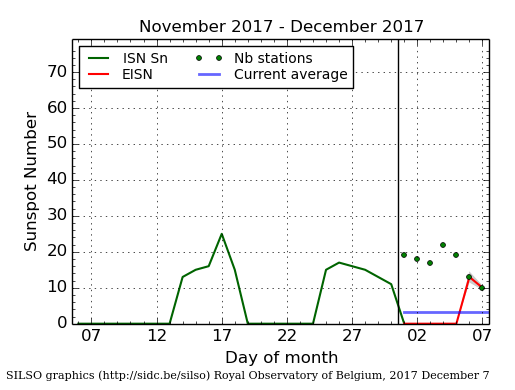
The daily Estimated International Sunspot Number (EISN, red curve with shaded error) derived by a simplified method from real-time data from the worldwide SILSO network. It extends the official Sunspot Number from the full processing of the preceding month (green line). The plot shows the last 30 days (about one solar rotation). The horizontal blue line shows the current monthly average, while the green dots give the number of stations included in the calculation of the EISN for each day.
Geomagnetic Observations at Dourbes (27 Nov 2017 - 3 Dec 2017)

Review of ionospheric activity (27 Nov 2017 - 3 Dec 2017)
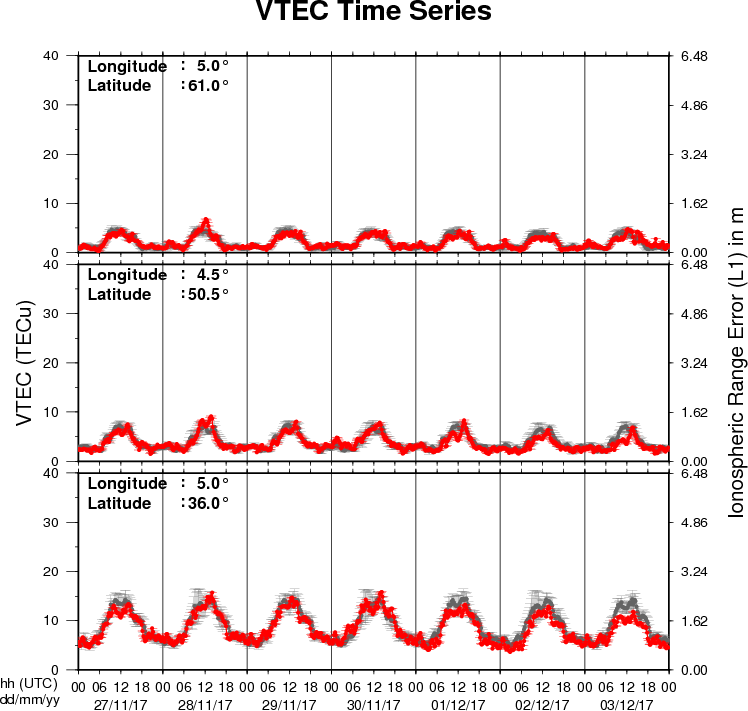
The figure shows the time evolution of the Vertical Total Electron Content (VTEC) (in red) during the last week at three locations:
a) in the northern part of Europe(N61°, 5°E)
b) above Brussels(N50.5°, 4.5°E)
c) in the southern part of Europe(N36°, 5°E)
This figure also shows (in grey) the normal ionospheric behaviour expected based on the median VTEC from the 15 previous days.
The VTEC is expressed in TECu (with TECu=10^16 electrons per square meter) and is directly related to the signal propagation delay due to the ionosphere (in figure: delay on GPS L1 frequency).
The Sun's radiation ionizes the Earth's upper atmosphere, the ionosphere, located from about 60km to 1000km above the Earth's surface.The ionization process in the ionosphere produces ions and free electrons. These electrons perturb the propagation of the GNSS (Global Navigation Satellite System) signals by inducing a so-called ionospheric delay.
See http://stce.be/newsletter/GNSS_final.pdf for some more explanations ; for detailed information, see http://gnss.be/ionosphere_tutorial.php