- Table of Content
- 1.Two Topical Is...
- 2.A new referenc...
- 3.Review of sola...
- 4.PROBA2 Observa...
- 5.The Internatio...
- 6.Review of geom...
- 7.Geomagnetic Ob...
- 8.Geomagnetic Ob...
- 9.Review of iono...
- 10.Review of iono...
2. A new reference solar spectrum
3. Review of solar activity (18 Dec 2017 - 31 Dec 2017)
4. PROBA2 Observations (25 Dec 2017 - 31 Dec 2017)
5. The International Sunspot Number
6. Review of geomagnetic activity (18 Dec 2017 - 31 Dec 2017)
7. Geomagnetic Observations at Dourbes (18 Dec 2017 - 24 Dec 2017)
8. Geomagnetic Observations at Dourbes (25 Dec 2017 - 31 Dec 2017)
9. Review of ionospheric activity (18 Dec 2017 - 24 Dec 2017)
10. Review of ionospheric activity (25 Dec 2017 - 31 Dec 2017)
Two Topical Issues for the SWSC Journal
Benefiting from the highly successful ESWW14 (http://www.stce.be/esww14/ ), the open-access Journal of Space Weather and Space Climate (SWSC, https://www.swsc-journal.org/ ) has opened two topical issues (TI), as listed underneath. Questions regarding these topical issues are to be addressed to the respective topical editor-in-chief. For questions concerning the submission process, please contact the Editorial Office (swsc@edpsciences.org ). Manuscripts have to be submitted in PDF format via the SWSC online submission tool (https://articlestatus.edpsciences.org/is/swsc/ ) before the respective deadlines.
These topical issues are completely open to all contributors, i.e. they are NOT limited to ESWW14 conference participants.
Topical Issue 1: Planetary Space Weather
Link to scope and guidelines: https://www.swsc-journal.org/news
The Topical Editor-in-Chief is Nicolas Andre (nicolas.andre@irap.omp.eu ).
Deadline for submission: 15 April 2018
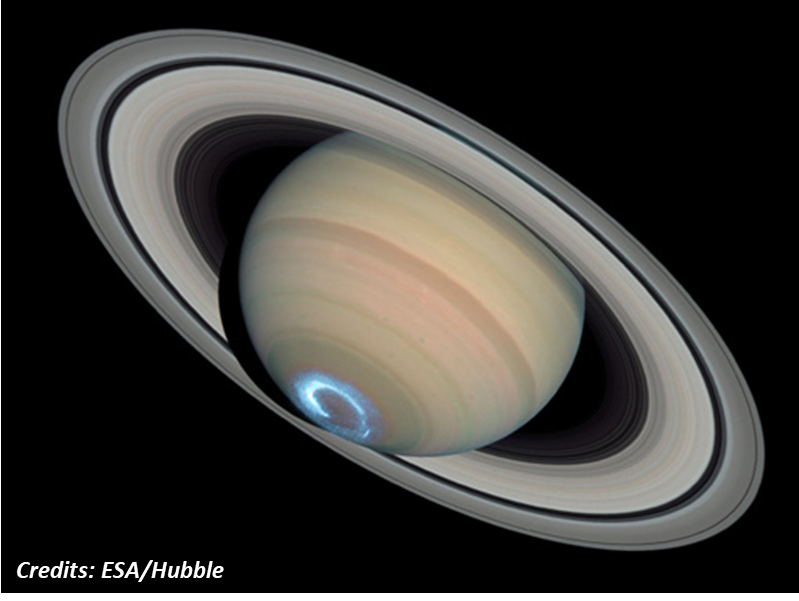
Topical Issue 2: System Science: Application to Space Weather Analysis, Modelling, and Forecasting
Link to scope and guidelines: https://www.swsc-journal.org/news
The Topical Editor-in-Chief is Richard Boynton (r.boynton@sheffield.ac.uk ).
Deadline for submission: 15 May 2018
A new reference solar spectrum
Our colleagues from BIRA-IASB (http://www.aeronomie.be/en/ ) announced a new reference solar spectrum based on SOLAR/SOLSPEC observations on board the International Space Station. Such a spectrum provides fundamental input for research in e.g. solar physics and climate change.
Indeed, the role of solar variability on climate change remains a topic of strong scientific and societal interest. An international scientific team, with an important role for the Royal Belgian Institute for Space Aeronomy (BIRA-IASB), has accurately determined a new solar reference spectrum from measurements made by the SOLAR/SOLSPEC instrument on board the International Space Station.
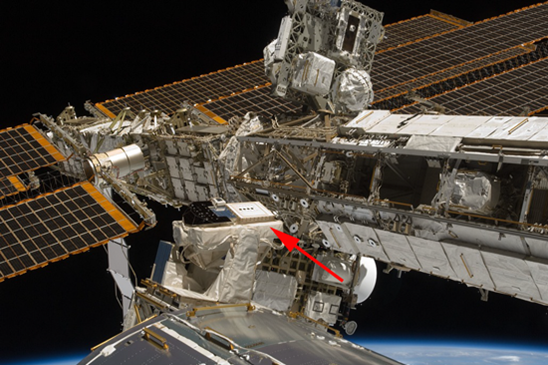
SOLAR/SOLSPEC is the result of a long collaboration between the Laboratoire Atmosphères, Milieux, Observations Spatiales (LATMOS) and the Royal Belgian Institute for Space Aeronomy (BIRA-IASB) that already made possible to measure the solar spectrum from several space missions (ESA and NASA).
The SOLAR/SOLSPEC instrument data will also be used to track the spectral variability of solar irradiance over nearly a solar cycle (from 2008 to 2017). These are essential and valuable data for modeling the Earth's climate with climate chemistry models of the atmosphere.
The full press release, as well as a picture of the new reference solar spectrum, can be found on the BIRA-IASB website at http://www.aeronomie.be/en/news-press/2017-12-19-solar-spectrum-iss.htm
The source paper Meftah et al. (2017) was published in Astronomy and Astrophysics (DOI: https://doi.org/10.1051/0004-6361/201731316 ).
Review of solar activity (18 Dec 2017 - 31 Dec 2017)
Solar activity was very low throughout the week, no C-class flares were observed.
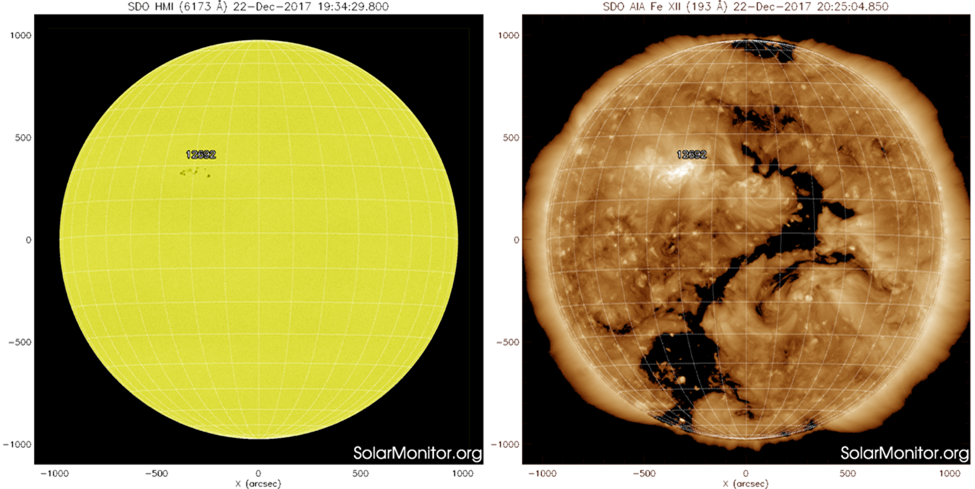
There was only one region visible on disk (Catania group 67, NOAA active region 2692). This sunspot group started to develop on 19 December, but had a relatively simple beta magnetic field configuration. Hence, it produced only a small number of modest B-class flares, in particular late on 21 and on 22 December. The region had decayed to an alpha configuration by 27 December, and became a spotless plage on 28 December.
No earth-directed coronal mass ejections (CMEs) were observed and the proton fluxes remained at background levels.
The SDO images underneath show the Sun on 22 December in white light (left) and in extreme ultraviolet (right; AIA 193: temperature of about 1.3 million degrees). Active region NOAA 2692 is prominently visible. The EUV image also shows the extension of a southern polar coronal hole that would start influencing the earth environment about a day later.
PROBA2 Observations (25 Dec 2017 - 31 Dec 2017)
Solar Activity
Solar flare activity remained very low during the week.
In order to view the activity of this week in more detail, we suggest to go to the following website from which all the daily (normal and difference) movies can be accessed: http://proba2.oma.be/ssa
This page also lists the recorded flaring events.
A weekly overview movie can be found here (SWAP week 405): http://proba2.oma.be/swap/data/mpg/movies/weekly_movies/weekly_movie_2017_12_25.mp4
Details about some of this week's events, can be found further below.
If any of the linked movies are unavailable they can be found in the P2SC movie repository here: http://proba2.oma.be/swap/data/mpg/movies/
Thursday Dec 28
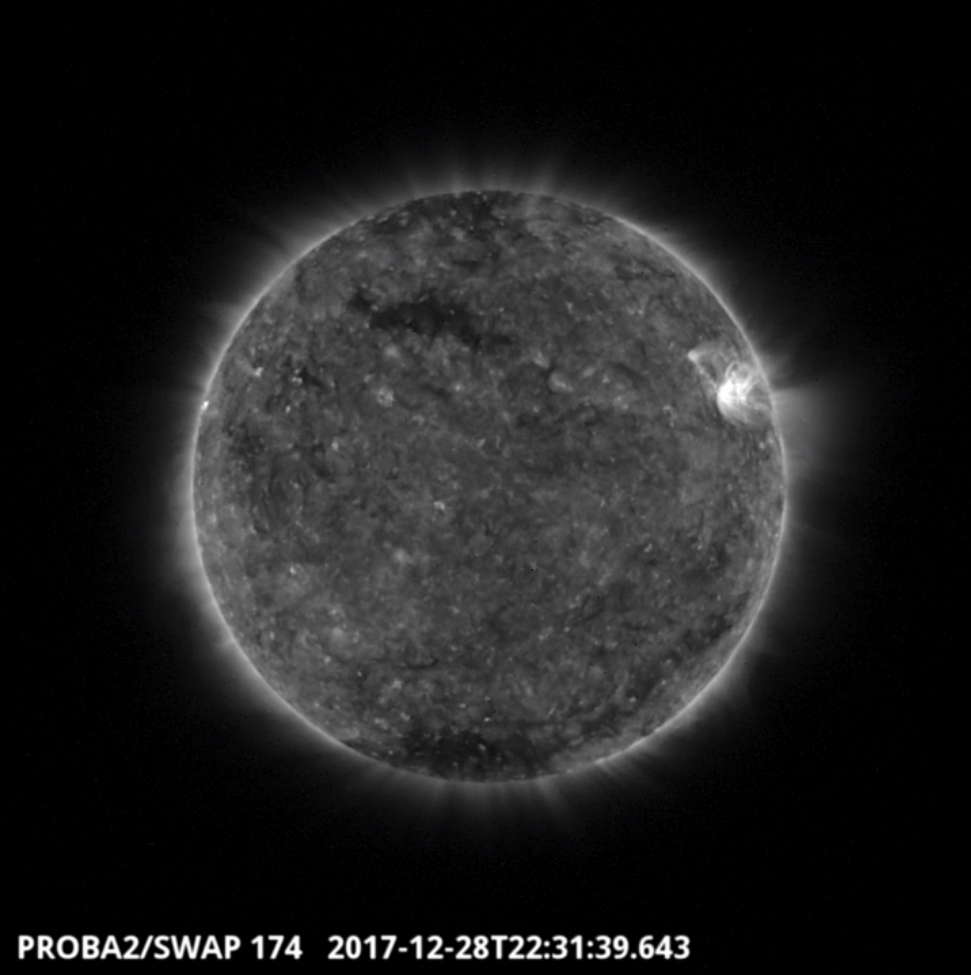
The largest flare of the week was a B-class (B8.3) flare and was observed by SWAP on 2017-Dec-28. The flare is visible near the east limb in the SWAP image above at 22:31 UT.
Find a movie of the event here (SWAP movie): http://proba2.oma.be/swap/movies/20171228_swap_movie.mp4
The International Sunspot Number
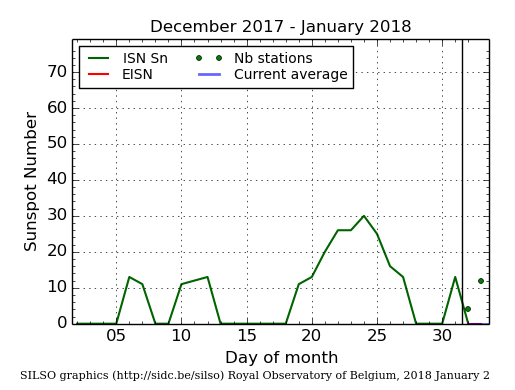
The daily Estimated International Sunspot Number (EISN, red curve with shaded error) derived by a simplified method from real-time data from the worldwide SILSO network. It extends the official Sunspot Number from the full processing of the preceding month (green line). The plot shows the last 30 days (about one solar rotation). The horizontal blue line shows the current monthly average, while the green dots give the number of stations included in the calculation of the EISN for each day.
Review of geomagnetic activity (18 Dec 2017 - 31 Dec 2017)
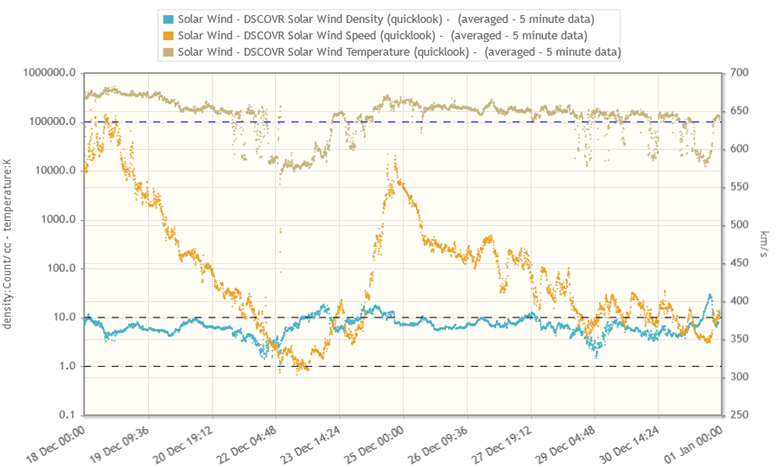
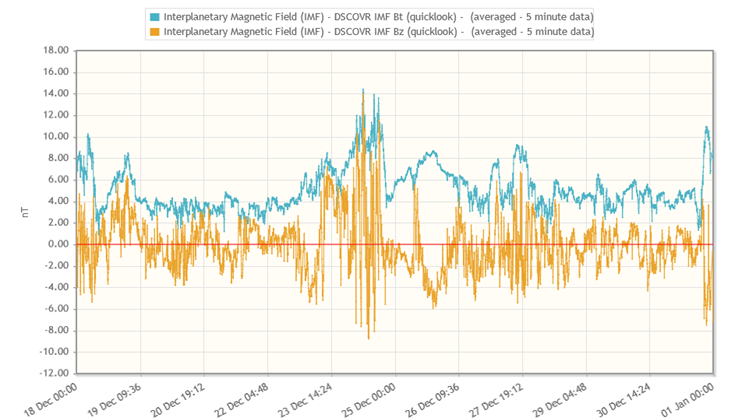
At the start of the period, the earth environment was under the influence of a high speed stream (HSS) from a positive polarity equatorial coronal hole (CH). Solar wind speed reached a peak of around 650 km/s and started to decline from the afternoon of 18 December onwards. By late on 22 December, the solar wind speed had dropped to 320 km/s, but then gradually started a new increase due to the influence of a HSS from the low latitude extension of the southern polar CH (negative polarity). Values around 550 km/s were reached late on 24 December, with Bz oscillating between -9 and + 13 nT.
Geomagnetic conditions were mostly quiet to unsettled throughout the period, with some active periods -associated to the high speed streams- observed by NOAA and Dourbes on 18 and 26 December, and by Dourbes also on 24 December.
The charts underneath were created with STAFF viewer (http://www.staff.oma.be ) and show the evolution of the solar wind and the interplanetary magnetic field for the period of 18 till 31 December 2017.
Review of ionospheric activity (18 Dec 2017 - 24 Dec 2017)

The figure shows the time evolution of the Vertical Total Electron Content (VTEC) (in red) during the last week at three locations:
a) in the northern part of Europe(N61°, 5°E)
b) above Brussels(N50.5°, 4.5°E)
c) in the southern part of Europe(N36°, 5°E)
This figure also shows (in grey) the normal ionospheric behaviour expected based on the median VTEC from the 15 previous days.
The VTEC is expressed in TECu (with TECu=10^16 electrons per square meter) and is directly related to the signal propagation delay due to the ionosphere (in figure: delay on GPS L1 frequency).
The Sun's radiation ionizes the Earth's upper atmosphere, the ionosphere, located from about 60km to 1000km above the Earth's surface.The ionization process in the ionosphere produces ions and free electrons. These electrons perturb the propagation of the GNSS (Global Navigation Satellite System) signals by inducing a so-called ionospheric delay.
See http://stce.be/newsletter/GNSS_final.pdf for some more explanations ; for detailed information, see http://gnss.be/ionosphere_tutorial.php
Review of ionospheric activity (25 Dec 2017 - 31 Dec 2017)

The figure shows the time evolution of the Vertical Total Electron Content (VTEC) (in red) during the last week at three locations:
a) in the northern part of Europe(N61°, 5°E)
b) above Brussels(N50.5°, 4.5°E)
c) in the southern part of Europe(N36°, 5°E)
This figure also shows (in grey) the normal ionospheric behaviour expected based on the median VTEC from the 15 previous days.
The VTEC is expressed in TECu (with TECu=10^16 electrons per square meter) and is directly related to the signal propagation delay due to the ionosphere (in figure: delay on GPS L1 frequency).
The Sun's radiation ionizes the Earth's upper atmosphere, the ionosphere, located from about 60km to 1000km above the Earth's surface.The ionization process in the ionosphere produces ions and free electrons. These electrons perturb the propagation of the GNSS (Global Navigation Satellite System) signals by inducing a so-called ionospheric delay.
See http://stce.be/newsletter/GNSS_final.pdf for some more explanations ; for detailed information, see http://gnss.be/ionosphere_tutorial.php

