- Table of Content
- 1.The last C-cla...
- 2.ESWW15 - call ...
- 3.PROBA2 Observa...
- 4.Review of sola...
- 5.The Internatio...
- 6.Review of geom...
- 7.Geomagnetic Ob...
- 8.SIDC space wea...
- 9.Review of iono...
2. ESWW15 - call for sessions
3. PROBA2 Observations (8 Jan 2018 - 14 Jan 2018)
4. Review of solar activity
5. The International Sunspot Number
6. Review of geomagnetic activity
7. Geomagnetic Observations at Dourbes (8 Jan 2018 - 14 Jan 2018)
8. SIDC space weather briefing
9. Review of ionospheric activity (8 Jan 2018 - 14 Jan 2018)
The last C-class flare
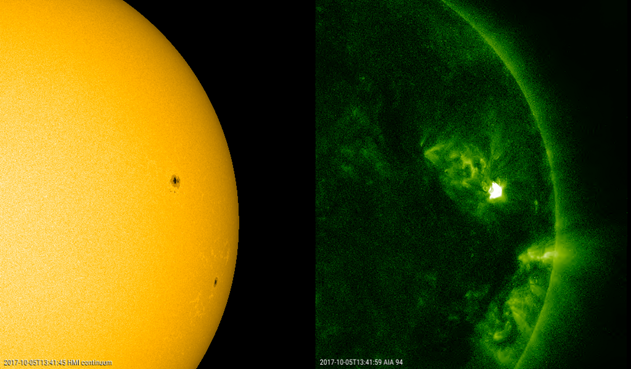
With only a few small inactive sunspot regions and the recent series of spotless days, it comes as no surprise that no C-class or stronger flares have been observed for quite a while. In fact, the last C-class flare dates back from 5 October 2017 (NOAA 2683, C1.0 - see SDO white light and extreme ultraviolet imagery underneath), that is 103 days ago. This is no record, with the time-frame from 3 April till 3 November 2008 (213 consecutive days!) being the longest period without C-class flares since systematic GOES x-ray measurements started in 1976. Nonetheless, this is a quite unusually long period, as only 3 other stretches with more than 100 days between two C-class flares have been recorded.
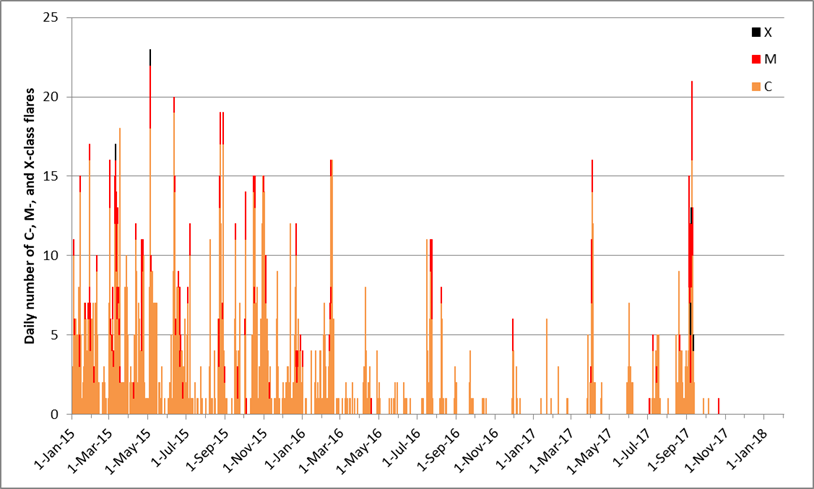
Interestingly, there was a single M-class flare (M1.1) on 20 October 2017, which was produced by NOAA 2685 while it was still just beyond the east limb. As the region rotated onto the solar disk, it became clear this was only a small region, and it did not produce any other C- or M-class flares. The record consecutive days with no M-class flares is 664 days (25 March 2008 - 19 January 2010), for X-class flares this is no less than 1523 days (14 December 2006 - 15 February 2011). The recent period from 5 May 2015 till 6 September 2017 (854 days) ranks third. Including the 4 X-class flares from September 2017, the current solar cycle (SC24) counts 49 X-class flares so far (see e.g. http://www.stce.be/news/370/welcome.html and http://www.stce.be/news/346/welcome.html ).
The graph underneath is an update from the 29 March 2017 news item (http://www.stce.be/news/383/welcome.html ), and shows the daily number of C-, M- and X-class flares (Common, Medium and eXtreme flares, resp. in orange, red and black colors) for the period 2015 till mid-January 2018. The burst in activity early September last year was due to active region NOAA 2673, which produced 4 X-class flares in as many days, including the 2 strongest so far this solar cycle. The strong activity was extensively covered in the STCE news items, e.g. at http://www.stce.be/news/402/welcome.html and http://www.stce.be/news/400/welcome.html As can be seen from the graph, solar flare activity stalled shortly afterwards...
ESWW15 - call for sessions
European Space Weather Week 15
November 5-9, 2018, Leuven, Belgium
website: http://www.stce.be/esww15/
Call for sessions - second announcement
Dear Colleagues
Each year, during the European Space Weather Week (ESWW) conference, people from all over the world gather to discuss the newest insights in space weather and try to find appropriate answers to the challenges and threats that space weather imposes. Science, data exploitation, observations, service development, operational models, engineering, industrial challenges, etc. are all relevant and most important aspects of space weather.
One of the strengths of the conference is that the participants can contribute largely to its content. For ESWW15, we foresee sessions in 3 flavours:
* plenary sessions, one oriented towards Users and one towards Operations/Services;
* parallel Science and Research sessions;
* parallel 100% community driven or Open sessions.
Read more on the 3 flavours: http://www.stce.be/esww15/sessionflavours.php
We would like to invite and encourage you and your colleagues to submit a proposal for a session or apply as a candidate to convene a session: http://www.stce.be/esww15/call4sessions.php .
The deadline for submission is 4 February 2018, included.
The ESWW Programme Committee (PC) will decide which of the submitted sessions are accepted. Session conveners will be notified by the end of February.
Happy submission!
Mauro Messerotti and Petra Vanlommel, on behalf of the ESWW15 PC
PROBA2 Observations (8 Jan 2018 - 14 Jan 2018)
Solar Activity
Solar flare activity was very low during the week.
In order to view the activity of this week in more detail, we suggest to go to the following website from which all the daily (normal and difference) movies can be accessed: http://proba2.oma.be/ssa
This page also lists the recorded flaring events.
A weekly overview movie can be found here (SWAP week 407).
http://proba2.oma.be/swap/data/mpg/movies/weekly_movies/weekly_movie_2018_01_08.mp4
Details about some of this week’s events, can be found further below. If any of the linked movies are unavailable they can be found in the P2SC movie repository here
http://proba2.oma.be/swap/data/mpg/movies/
Tuesday Jan 09
.png)
A coronal hole reached the central meridian in the morning of January 09
Find a movie of the events here (SWAP movie)
http://proba2.oma.be/swap/movies/20180109_swap_movie.mp4
Friday Jan 12
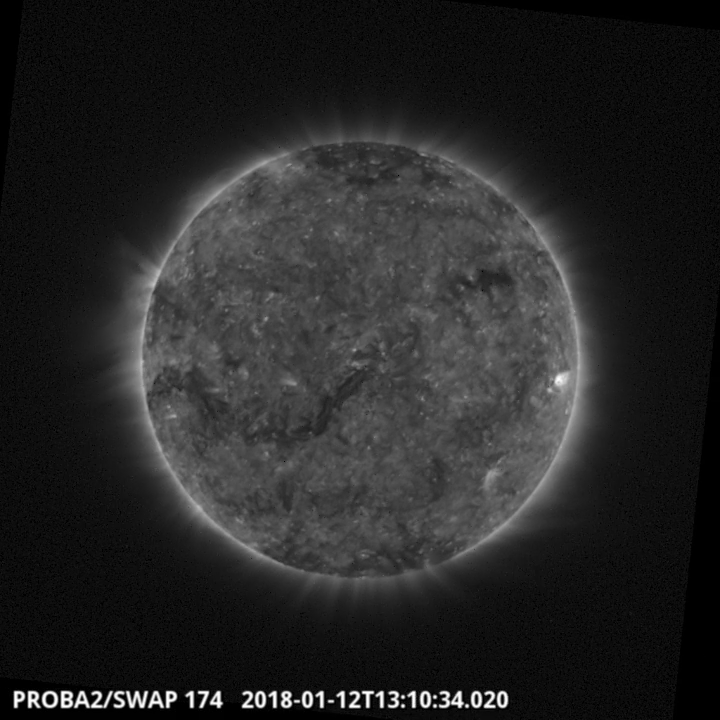
The single flare of the week, a B1.9, is visible near the western limb of the Sun in the SWAP image above. Find a movie of the events here (SWAP movie)
http://proba2.oma.be/swap/movies/20180112_swap_movie.mp4
Review of solar activity
Solar flaring activity was very low, no C-class or even B-class flares were reported.
All three sunspot groups (NOAA ARs 2693, 2694, 2695) present on the solar disc, had a simple alpha or beta configuration of the photospheric magnetic field.
No CMEs were reported by CACTus, the software that detects CMEs in LASCO-images. LASCO is a coronagraph onboard of the satellite SOHO. The solar protons remained at background levels.
On January 9, a coronal hole in the Northern hemisphere reached the central meridian. It was a rather small coronal hole situated close to equator (between N05 and N30).
The International Sunspot Number
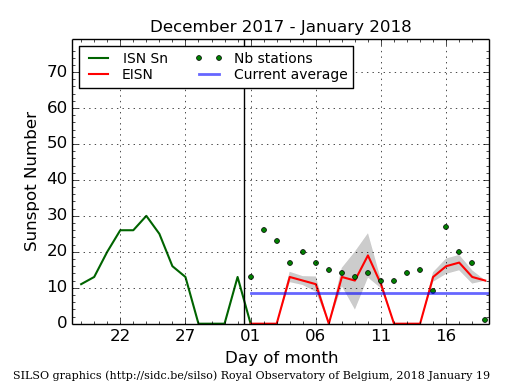
The daily Estimated International Sunspot Number (EISN, red curve with shaded error) derived by a simplified method from real-time data from the worldwide SILSO network. It extends the official Sunspot Number from the full processing of the preceding month (green line). The plot shows the last 30 days (about one solar rotation). The horizontal blue line shows the current monthly average, while the green dots give the number of stations included in the calculation of the EISN for each day.
Review of geomagnetic activity
A coronal hole introducing a shock at L1
A shock passing the L1 point on January 08, 05:55 UT was detected by the DSCOVR satellite. The solar wind speed suddenly increased from about 290 to 350 km/s. Simultaneously, the density, temperature and the interplanetary magnetic field magnitude increased.
Since the solar wind speed was rather low, and the Bz component of the interplanetary magnetic field was mostly positive, the shock and the trailing solar wind did not disturb the geomagnetic field much.
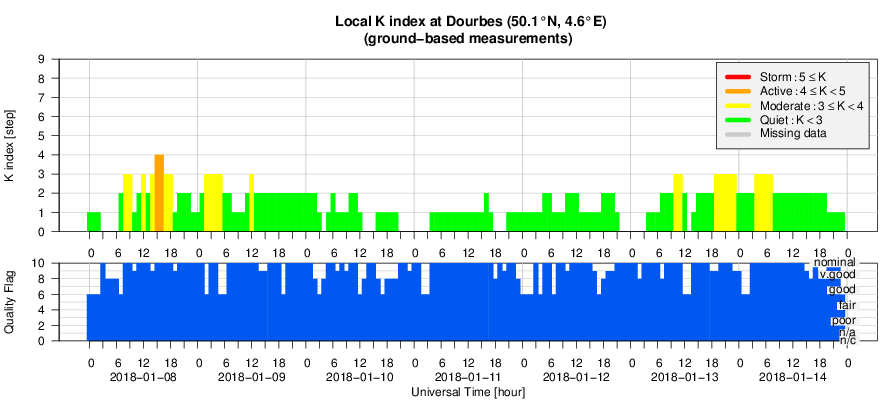
It was the fast flow from the low latitude extension of the Northern polar coronal hole which reached central meridian on late evening of January 04 that caught up with the slow solar wind in front of it creating a shock before the L1 point. The interaction of the fast solar wind with the geomagnetic field gave rise to active geomagnetic conditions on January 08. The local station at Dourbes measured K=4, NOAA reported Kp=4.
Another coronal hole influence
The fast solar wind from the coronal hole that reached the central meridian on January 09, arrived at Earth in the late evening of January 13. The solar wind speed reached 610 km/s while the Bz component of the interplanetary magnetic field went down to -12 nT. The fast flow induced disturbed geomagnetic conditions early January 14. NOAA reported Kp=5 and the local station at Dourbes measured K=3.
Geomagnetic Observations at Dourbes (8 Jan 2018 - 14 Jan 2018)
SIDC space weather briefing
The Space Weather Briefing presented by the forecaster on duty from January 8 to 14. It reflects in images and graphs what is written in the Solar and Geomagnetic Activity report.
The briefing in pdf-format: http://www.stce.be/briefings/SIDCbriefing-20180115.pdf
Review of ionospheric activity (8 Jan 2018 - 14 Jan 2018)
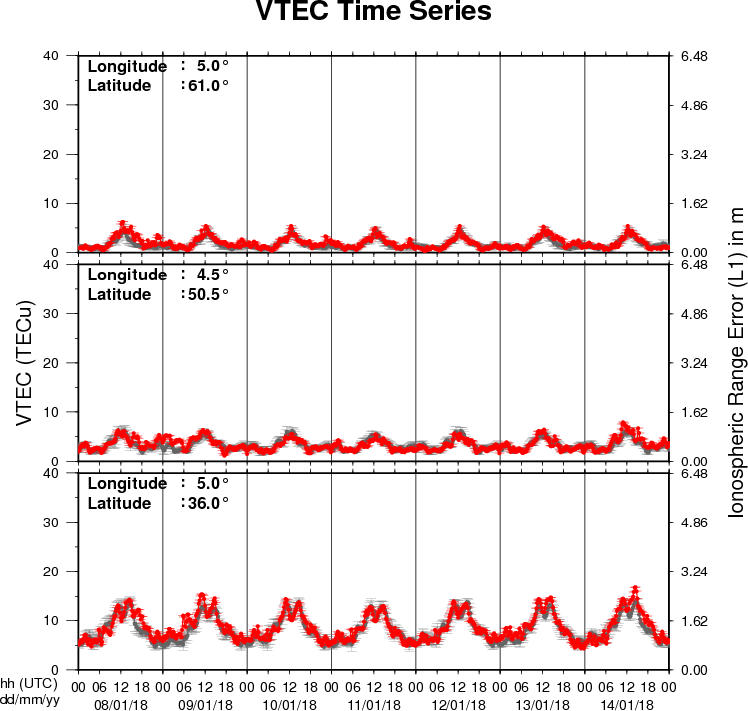
The figure shows the time evolution of the Vertical Total Electron Content (VTEC) (in red) during the last week at three locations:
a) in the northern part of Europe(N61°, 5°E)
b) above Brussels(N50.5°, 4.5°E)
c) in the southern part of Europe(N36°, 5°E)
This figure also shows (in grey) the normal ionospheric behaviour expected based on the median VTEC from the 15 previous days.
The VTEC is expressed in TECu (with TECu=10^16 electrons per square meter) and is directly related to the signal propagation delay due to the ionosphere (in figure: delay on GPS L1 frequency).
The Sun's radiation ionizes the Earth's upper atmosphere, the ionosphere, located from about 60km to 1000km above the Earth's surface.The ionization process in the ionosphere produces ions and free electrons. These electrons perturb the propagation of the GNSS (Global Navigation Satellite System) signals by inducing a so-called ionospheric delay.
See http://stce.be/newsletter/GNSS_final.pdf for some more explanations ; for detailed information, see http://gnss.be/ionosphere_tutorial.php