- Table of Content
- 1.STCE annual me...
- 2.PROBA2 Observa...
- 3.Review of sola...
- 4.SIDC space wea...
- 5.The Internatio...
- 6.Geomagnetic Ob...
- 7.Review of iono...
2. PROBA2 Observations (15 Jan 2018 - 21 Jan 2018)
3. Review of solar and geomagnetic activity
4. SIDC space weather briefing
5. The International Sunspot Number
6. Geomagnetic Observations at Dourbes (15 Jan 2018 - 21 Jan 2018)
7. Review of ionospheric activity (15 Jan 2018 - 21 Jan 2018)
STCE annual meeting: June 7 2018
We have the pleasure to announce the date for the 2018 STCE annual meeting: June 7.
In the past, we learned about the work done at the plateau, we had workshops, discussion rounds and Meet and Greets, we were submerged in the magic of the planeterrella, we did a Points of Interest tour, we visited windy roofs and dark and dusty basements, watched a launch of a weather balloon to wuthering heights , ate 10y celebration cake, …
You will hear soon what we plan for 2018.
For now, mark your calendar!
Kevin, Jan and Petra, on behalf of the STCE Executive Committee

PROBA2 Observations (15 Jan 2018 - 21 Jan 2018)
Solar Activity
Solar flare activity remained very low during the week.
In order to view the activity of this week in more detail, we suggest to go to the following website from which all the daily (normal and difference) movies can be accessed: http://proba2.oma.be/ssa
This page also lists the recorded flaring events.
A weekly overview movie can be found here (SWAP week 408): http://proba2.oma.be/swap/data/mpg/movies/weekly_movies/weekly_movie_2018_01_15.mp4
Details about some of this week’s events, can be found further below.
If any of the linked movies are unavailable they can be found in the P2SC movie repository here: http://proba2.oma.be/swap/data/mpg/movies/
Thursday Jan 18
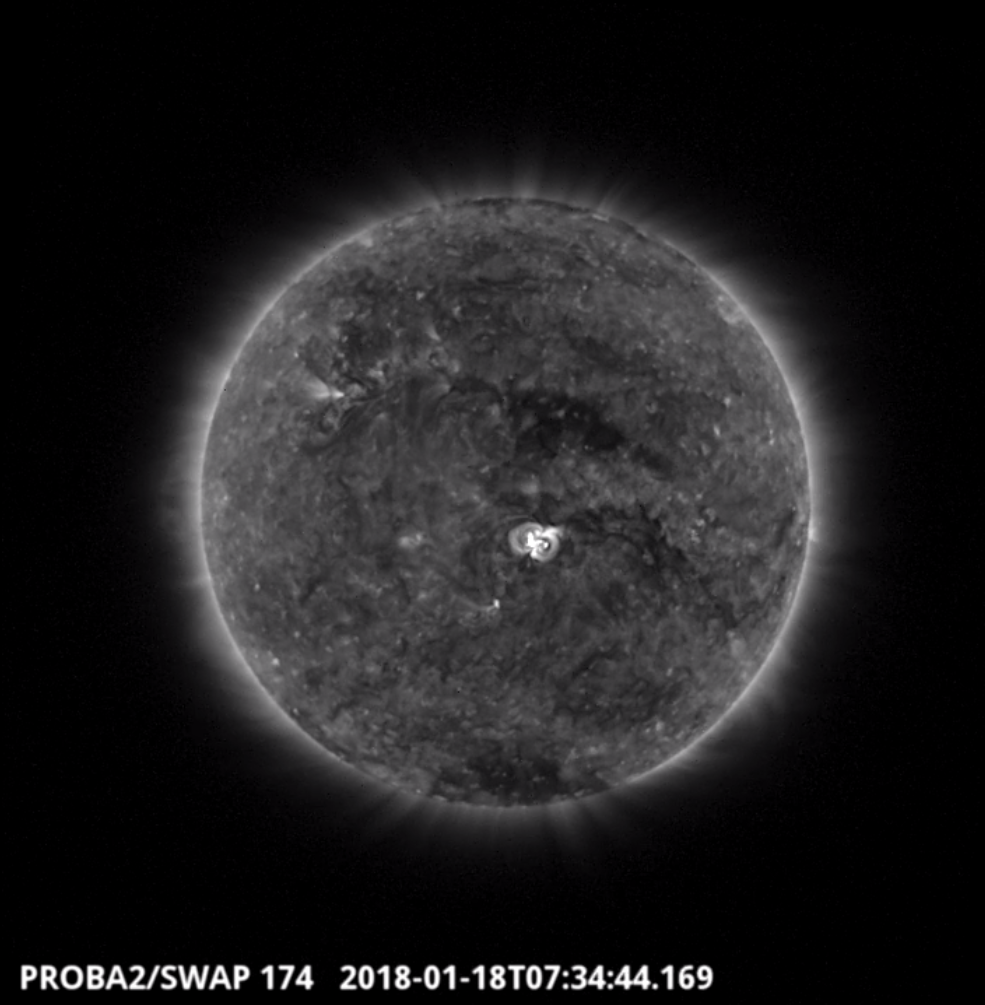
The largest flare of the week was a B-class (B9.7) flare associated with NOAA AR 2696 and was observed by SWAP on 2018-Jan-18. The flare is visible in centre of the solar disk in the SWAP image above at 07:34 UT.
Find a movie of the event here (SWAP movie): http://proba2.oma.be/swap/movies/20180118_swap_movie.mp4
Sunday Jan 21
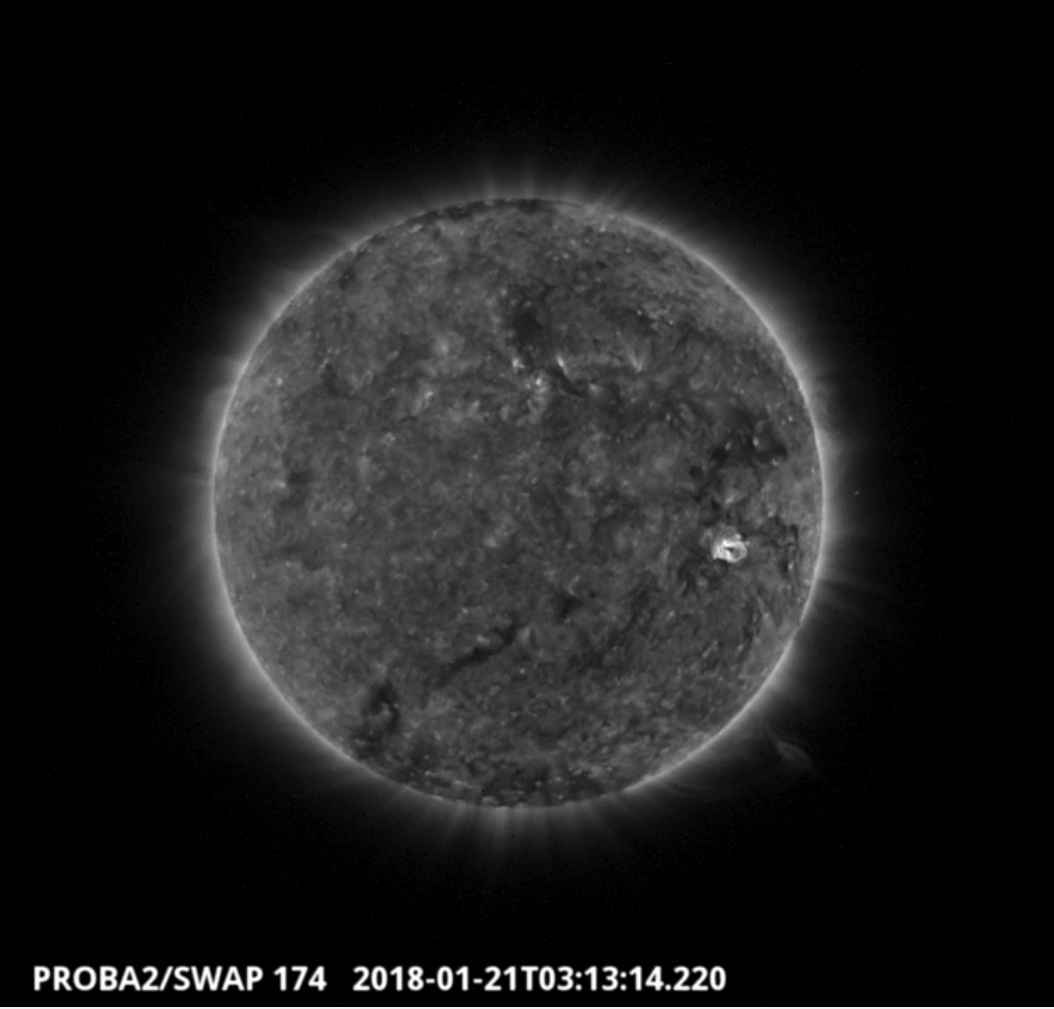
An eruption was observed by SWAP on 2018-Jan-21 off the south west limb of the Sun as shown in the SWAP image above at 03:13 UT.
Find a movie of the event here (SWAP movie): http://proba2.oma.be/swap/movies/20180121_swap_movie.mp4
Review of solar and geomagnetic activity
SOLAR ACTIVITY
The Sun was quiet. No significant flares have been recorded. A sunspot group linked with AR 2696 popped onto the solar disk on January 16. It produced no significant flares.
No Earth directed Coronal Mass Ejections (CMEs) have been detected.
The greater than 10MeV proton flux remained at background levels throughout the week.
GEOMAGNETIC ACTIVITY
The solar wind speed has fluctuated between 300 and 500 km/s over the past week. The total magnetic field strength has fluctuated between 4 nT to 12 nT. The Bz component has ranged between -10 and +10 nT.
The solar wind speeds started the week in decline but then began increasing again due to the presence of a small coronal hole on the Sun and the resultant High Speed Stream (HSS) at Earth.
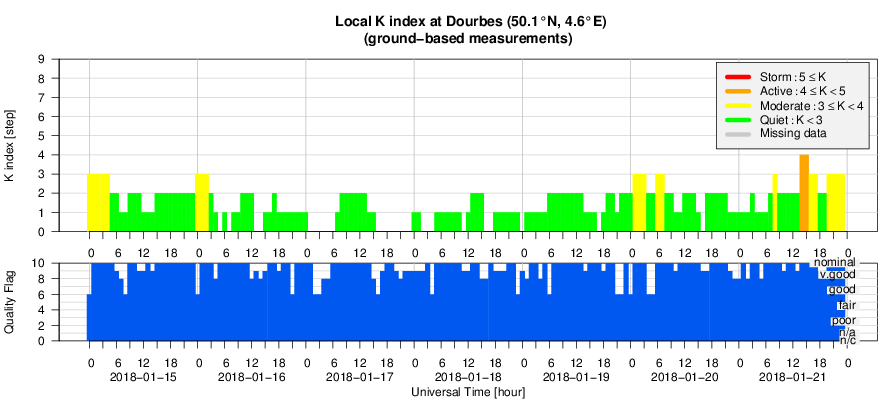
Geomagnetic conditions ranged between Kp index 0-3 (NOAA) and local K index 0-4 (Dourbes).
SIDC space weather briefing
The Space Weather Briefing presented by the forecaster on duty from January 15 to 21. It reflects in images and graphs what is written in the Solar and Geomagnetic Activity report.
The briefing in pdf-format: http://www.stce.be/briefings/SIDCbriefing-20180122.pdf
The International Sunspot Number
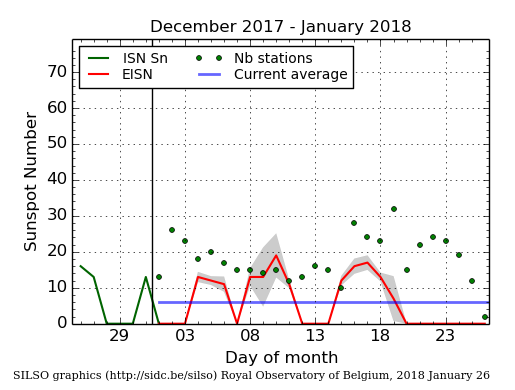
The daily Estimated International Sunspot Number (EISN, red curve with shaded error) derived by a simplified method from real-time data from the worldwide SILSO network. It extends the official Sunspot Number from the full processing of the preceding month (green line). The plot shows the last 30 days (about one solar rotation). The horizontal blue line shows the current monthly average, while the green dots give the number of stations included in the calculation of the EISN for each day.
We landed in the period that the number of contributing stations exceeds the Estimated International Sunspot Number on a regular base.
Geomagnetic Observations at Dourbes (15 Jan 2018 - 21 Jan 2018)
Review of ionospheric activity (15 Jan 2018 - 21 Jan 2018)
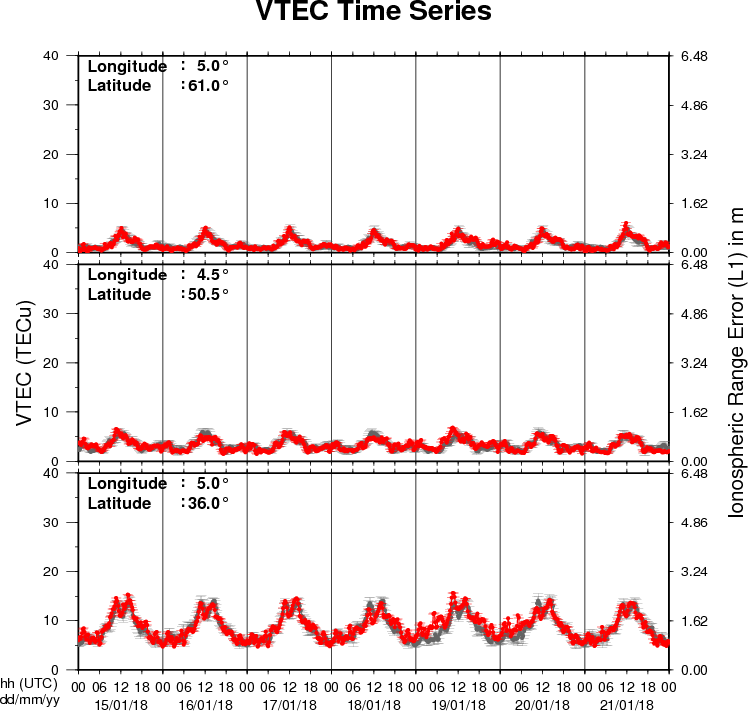
The figure shows the time evolution of the Vertical Total Electron Content (VTEC) (in red) during the last week at three locations:
a) in the northern part of Europe(N61°, 5°E)
b) above Brussels(N50.5°, 4.5°E)
c) in the southern part of Europe(N36°, 5°E)
This figure also shows (in grey) the normal ionospheric behaviour expected based on the median VTEC from the 15 previous days.
The VTEC is expressed in TECu (with TECu=10^16 electrons per square meter) and is directly related to the signal propagation delay due to the ionosphere (in figure: delay on GPS L1 frequency).
The Sun's radiation ionizes the Earth's upper atmosphere, the ionosphere, located from about 60km to 1000km above the Earth's surface.The ionization process in the ionosphere produces ions and free electrons. These electrons perturb the propagation of the GNSS (Global Navigation Satellite System) signals by inducing a so-called ionospheric delay.
See http://stce.be/newsletter/GNSS_final.pdf for some more explanations ; for detailed information, see http://gnss.be/ionosphere_tutorial.php