- Table of Content
- 1.It takes two t...
- 2.PROBA2 Observa...
- 3.Review of sola...
- 4.The SIDC Space...
- 5.The Internatio...
- 6.Geomagnetic Ob...
- 7.Review of iono...
2. PROBA2 Observations (22 Jan 2018 - 28 Jan 2018)
3. Review of solar and geomagnetic activity
4. The SIDC Space Weather Briefing
5. The International Sunspot Number
6. Geomagnetic Observations at Dourbes (22 Jan 2018 - 28 Jan 2018)
7. Review of ionospheric activity (22 Jan 2018 - 28 Jan 2018)
It takes two to Tango!
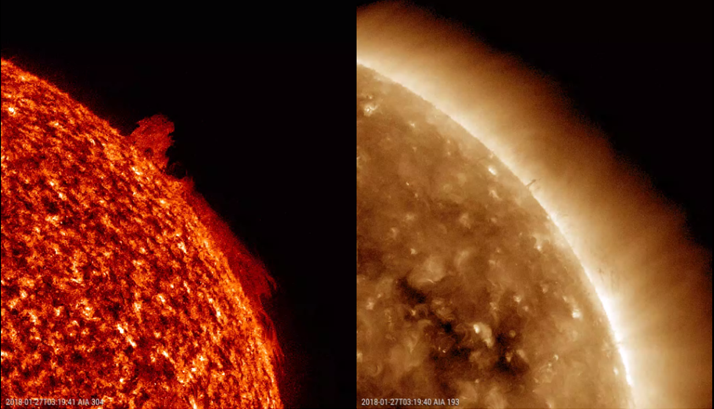
Solar activity was again very low. Fortunately, at the end of the week, some interesting prominences appeared at the solar limb. Prominences are relatively cool and dense structures reaching all the way up into the corona, the Sun's hot outer atmosphere. They are clouds of ionized gas above the solar surface squeezed between magnetic regions of opposite polarity. In dedicated filters such as Hydrogen-alpha (H-alpha, 656.3 nm or in EUV (extreme ultraviolet) such as observed by SDO/AIA 304 (https://sdo.gsfc.nasa.gov/ ), they appear as bright structures hovering over the solar limb, and as dark line-shaped features on the solar disk where they are called filaments. The imagery underneath (AIA 304) shows the most significant prominences near the northeast and especially the northwest limb on 27 January.

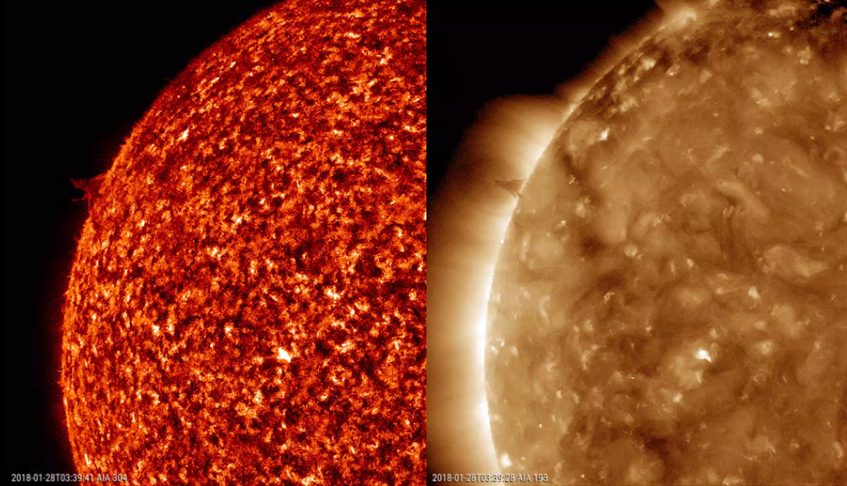
In AIA 304, we observe solar plasma (charged particles) at a temperature of about 80,000 degrees. The plasma in the higher chromosphere and lower transition region emits at this wavelength. This temperature is higher than that of the plasma seen in Hydrogen-alpha (H-alpha, 656.3 nm; about 10,000 degrees), but much cooler than most of the other extreme ultraviolet (EUV) filters of SDO, such as AIA 193 (about 1.3 million degrees). Hence, these "cool" prominences seen in 30.4 nm (left image underneath) are usually somewhat beefed up compared to H-alpha, whereas they are hardly visible in the "hotter" SDO filters such as AIA 193 (right image underneath). There, if visible at all, they are mostly observed as dark features against the brighter coronal background. Over three days (from 27 to 29 January), the AIA 304 images clearly show how the prominence chunks gradually interact more with each other, performing a lovely dance as they get connected to each other by a plasma bridge. In AIA 193, the already barely visible densest parts of the structures gradually fade from view. See the movies at http://www.stce.be/news/416/welcome.html
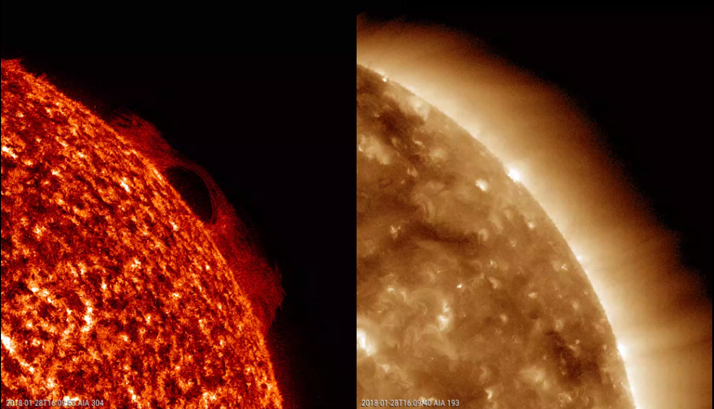
At the northeast limb, a smaller and less dynamic prominence becomes visible during this period. It is denser than its northwestern counterpart, and hence better visible against the bright coronal background in AIA 193. Interestingly, in AIA 193, one can see a semi-circular structure around this prominence (see imagery underneath). This is called a coronal prominence cavity. Prominences are often seen to be associated with these coronal cavities. Cavities are the upper parts of the filament channels. They appear darker than the surrounding corona, because there are 30-50% less particles present. They are also higher than the prominences. Because the outlook of the whole structure resembles somewhat the three-part structure of a coronal mass ejection (CME; see e.g. this news item at http://www.stce.be/news/342/welcome.html ), and because many have actually been observed erupting into a CME, coronal cavities are still a major field of research.
PROBA2 Observations (22 Jan 2018 - 28 Jan 2018)
Solar Activity
Solar flare activity remained very low during the week.
In order to view the activity of this week in more detail, we suggest to go to the following website from which all the daily (normal and difference) movies can be accessed: http://proba2.oma.be/ssa
This page also lists the recorded flaring events.
A weekly overview movie can be found here (SWAP week 409): http://proba2.oma.be/swap/data/mpg/movies/weekly_movies/weekly_movie_2018_01_22.mp4
Details about some of this week's events, can be found further below.
If any of the linked movies are unavailable they can be found in the P2SC movie repository here: http://proba2.oma.be/swap/data/mpg/movies/
Monday Jan 22
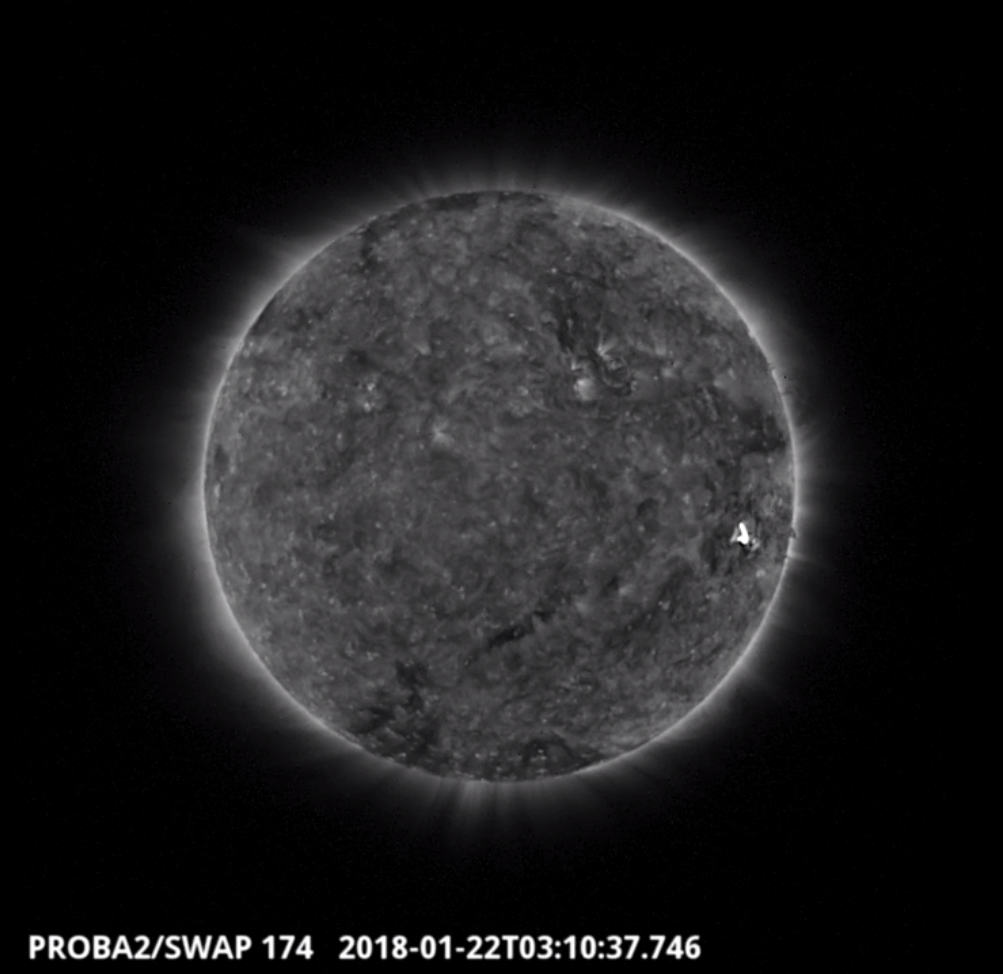
A CME with a B-class (B9.5) flare, associated with NOAA AR 2696, was observed by SWAP on 2018-Jan-22. The flare is visible towards the east of the solar disk in the SWAP image above at 03:10 UT.
For a full visualisation of the event see the movie of the day here (SWAP movie): http://proba2.oma.be/swap/movies/20180122_swap_movie.mp4
Review of solar and geomagnetic activity
SOLAR ACTIVITY
Solar activity was very low. No sunspot groups were observed this week. Spotless active region NOAA 2969 (location S12W55) produced a B9 flare on 22 January. The associated coronal mass ejection (CME) was not directed to Earth.
A diffuse extension of the positive northern polar coronal hole (CH) as well as a small and diffuse negative equatorial CH transited the central meridian.
No earth-directed CMEs were observed throughout the week.
The greater than 10 MeV proton flux was at nominal levels.
GEOMAGNETIC ACTIVITY
The earth environment was under the influence of a weak solar wind stream from a long but patchy extension of the negative southern polar coronal hole (CH). Solar wind speed was at slightly enhanced levels (500-530 km/s) on 22, 23 and 26 January. By the end of the period, the solar wind speed was near 350 km/s. Bz was mostly oscillating, in particular on 22 and from 24 till 26 January, reaching values between -9 and +8 nT. The interplanetary magnetic field was mostly directed towards the Sun, except on 24 January when it was in a predominantly away sector.
Mostly quiet to unsettled geomagnetic conditions were observed throughout the week, with a single active episode observed on 24 January (21-24UT interval).
The SIDC Space Weather Briefing
The Space Weather Briefing presented by the forecaster on duty from Jan 22 to 28. It reflects in images and graphs what is written in the Solar and Geomagnetic Activity report.
Movie of the B9.5 flare on January 22: http://www.stce.be/briefings/1-JHV_2018-01-22_07.25.40.mp4
Movie of the CME associated with the B9.5 flare on January 22: http://www.stce.be/briefings/2-CME_22Jan2018.mp4
The briefing in pdf-format: http://www.stce.be/briefings/SIDCbriefing-20180129.pdf
The International Sunspot Number
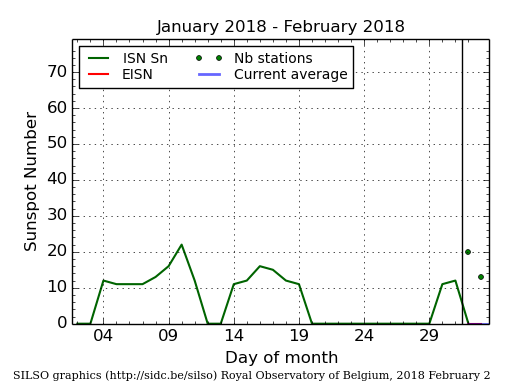
The daily Estimated International Sunspot Number (EISN, red curve with shaded error) derived by a simplified method from real-time data from the worldwide SILSO network. It extends the official Sunspot Number from the full processing of the preceding month (green line). The plot shows the last 30 days (about one solar rotation). The horizontal blue line shows the current monthly average, while the green dots give the number of stations included in the calculation of the EISN for each day.
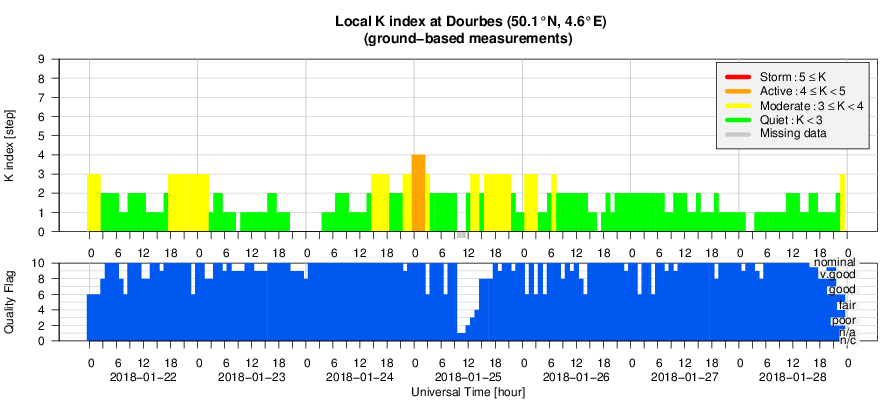
Geomagnetic Observations at Dourbes (22 Jan 2018 - 28 Jan 2018)
Review of ionospheric activity (22 Jan 2018 - 28 Jan 2018)
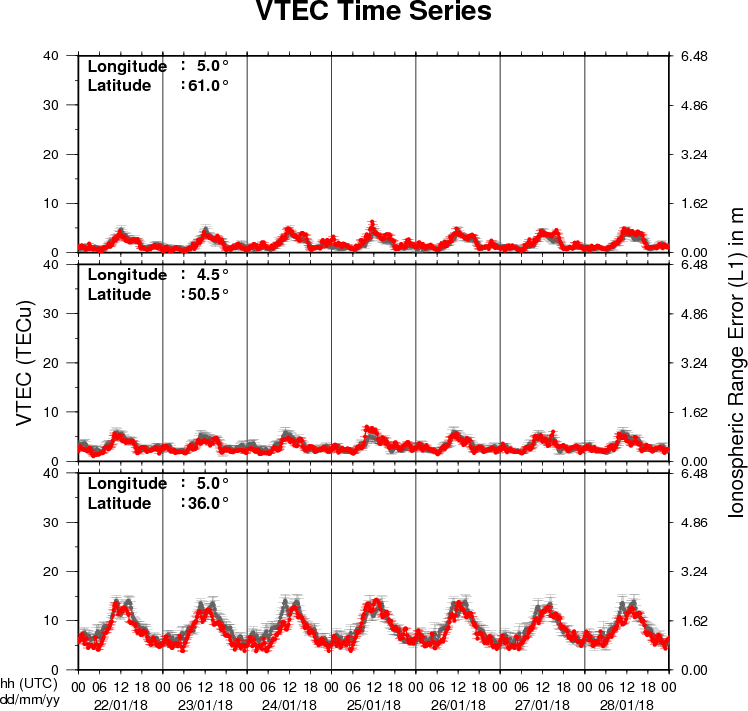
The figure shows the time evolution of the Vertical Total Electron Content (VTEC) (in red) during the last week at three locations:
a) in the northern part of Europe(N61°, 5°E)
b) above Brussels(N50.5°, 4.5°E)
c) in the southern part of Europe(N36°, 5°E)
This figure also shows (in grey) the normal ionospheric behaviour expected based on the median VTEC from the 15 previous days.
The VTEC is expressed in TECu (with TECu=10^16 electrons per square meter) and is directly related to the signal propagation delay due to the ionosphere (in figure: delay on GPS L1 frequency).
The Sun's radiation ionizes the Earth's upper atmosphere, the ionosphere, located from about 60km to 1000km above the Earth's surface.The ionization process in the ionosphere produces ions and free electrons. These electrons perturb the propagation of the GNSS (Global Navigation Satellite System) signals by inducing a so-called ionospheric delay.
See http://stce.be/newsletter/GNSS_final.pdf for some more explanations ; for detailed information, see http://gnss.be/ionosphere_tutorial.php