- Table of Content
- 1.Basic Solar Ph...
- 2.PROBA2 Observa...
- 3.Review of sola...
- 4.The Internatio...
- 5.Review of geom...
- 6.Geomagnetic Ob...
- 7.The SIDC Space...
- 8.Review of iono...
2. PROBA2 Observations (12 Feb 2018 - 18 Feb 2018)
3. Review of solar activity
4. The International Sunspot Number
5. Review of geomagnetic activity
6. Geomagnetic Observations at Dourbes (12 Feb 2018 - 18 Feb 2018)
7. The SIDC Space Weather Briefing
8. Review of ionospheric activity (12 Feb 2018 - 18 Feb 2018)
Basic Solar Physics Seminars

We just had the ninth in the series of STCE seminars on the basics of solar and heliospheric physics. Christophe Marqué introduced us to the world of radio antenna's. We want to bring the eighth seminar of Sergei Shestov to your attention. Sergei introduced us to spectrometers.
Watch the eighth seminar: https://events.oma.be/indico/event/41/
PROBA2 Observations (12 Feb 2018 - 18 Feb 2018)
Solar Activity
Solar flare activity fluctuated between very low and low during the week.
In order to view the activity of this week in more detail, we suggest to go to the following website from which all the daily (normal and difference) movies can be accessed: http://proba2.oma.be/ssa
This page also lists the recorded flaring events.
A weekly overview movie can be found here (SWAP week 412).
http://proba2.oma.be/swap/data/mpg/movies/weekly_movies/weekly_movie_2018_02_12.mp4
Details about some of this week’s events, can be found further below.
If any of the linked movies are unavailable they can be found in the P2SC movie repository here
http://proba2.oma.be/swap/data/mpg/movies/
Monday Feb 12
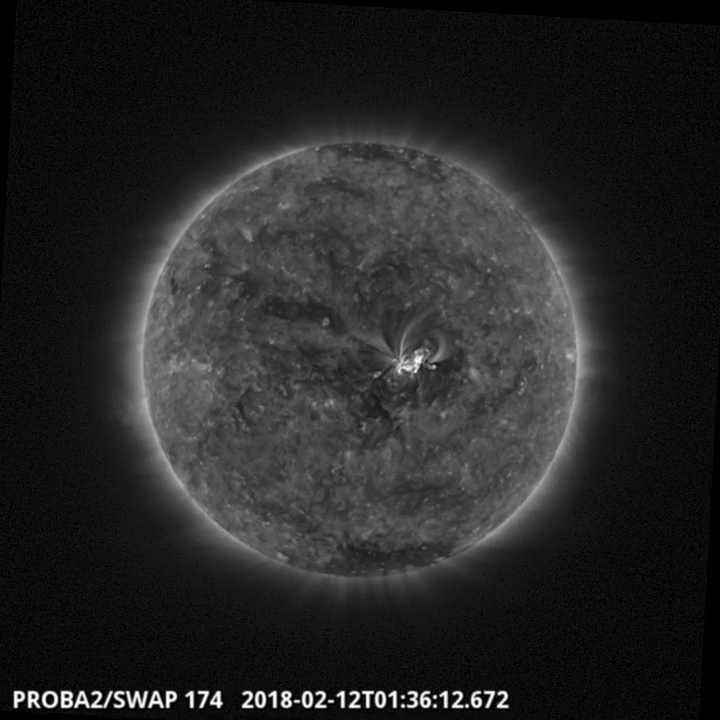
A C-class (C1.5) flare, associated with NOAA AR 2699, was observed by SWAP on 2018-Feb-12. The flare is visible near the solar disk center in the SWAP image above at 01:36 UT. This flare was followed by several B-class flares throughout the week. Find a movie of the events here(SWAP movie)
http://proba2.oma.be/swap/data/mpg/movies/20180212_swap_movie.mp4
Thursday Feb 15
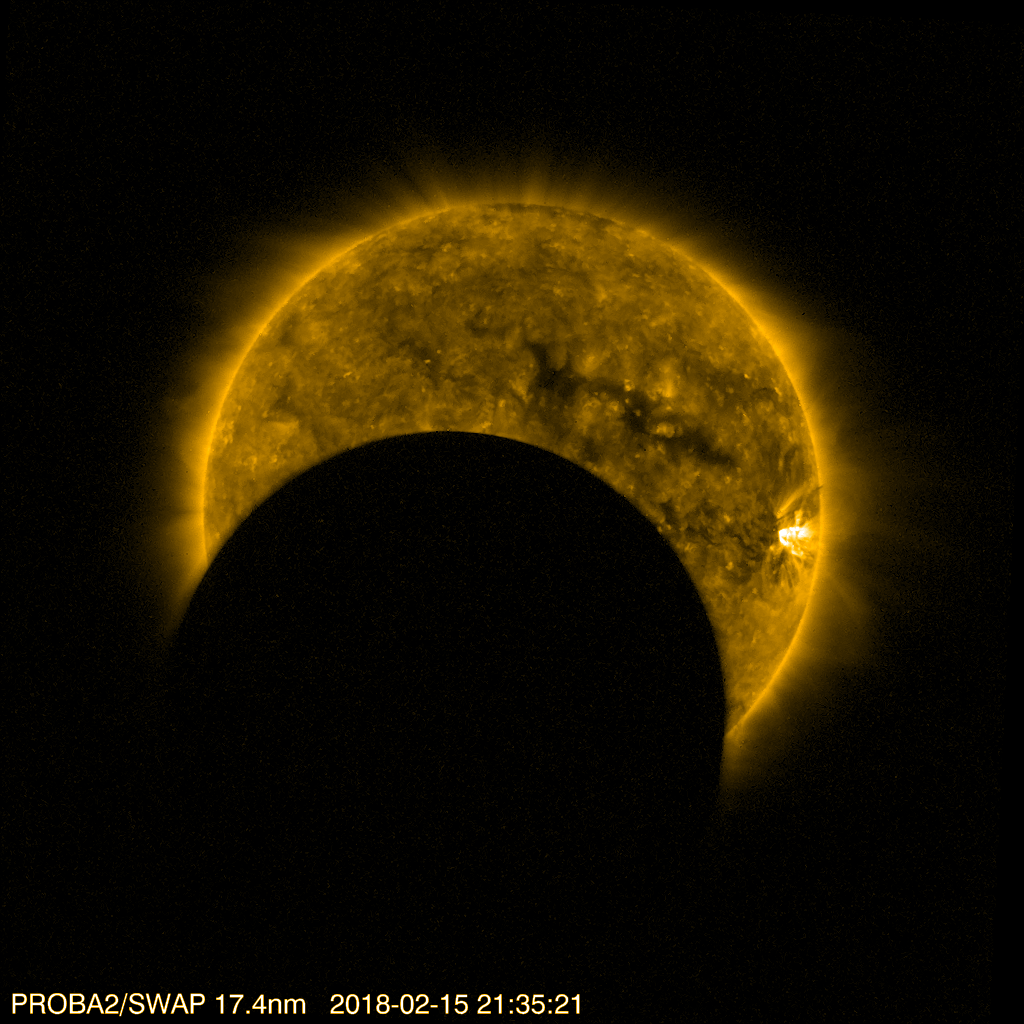
On February 15, two eclipses occured (between 19:59 and 20:11 UT, and between 21:28 and 21:41 UT respectively). The SWAP image above was taken during the second one. Additionally, the Moon appeared two more times in the SWAP and LYRA field of view, but without obscuring the solar disk.Find a movie of the events here(SWAP movie)
http://proba2.oma.be/Events/2018-Feb-15-SolarEclipse/movies/swap_eclipse_2018_02_15_timestamp_compressed.mp4
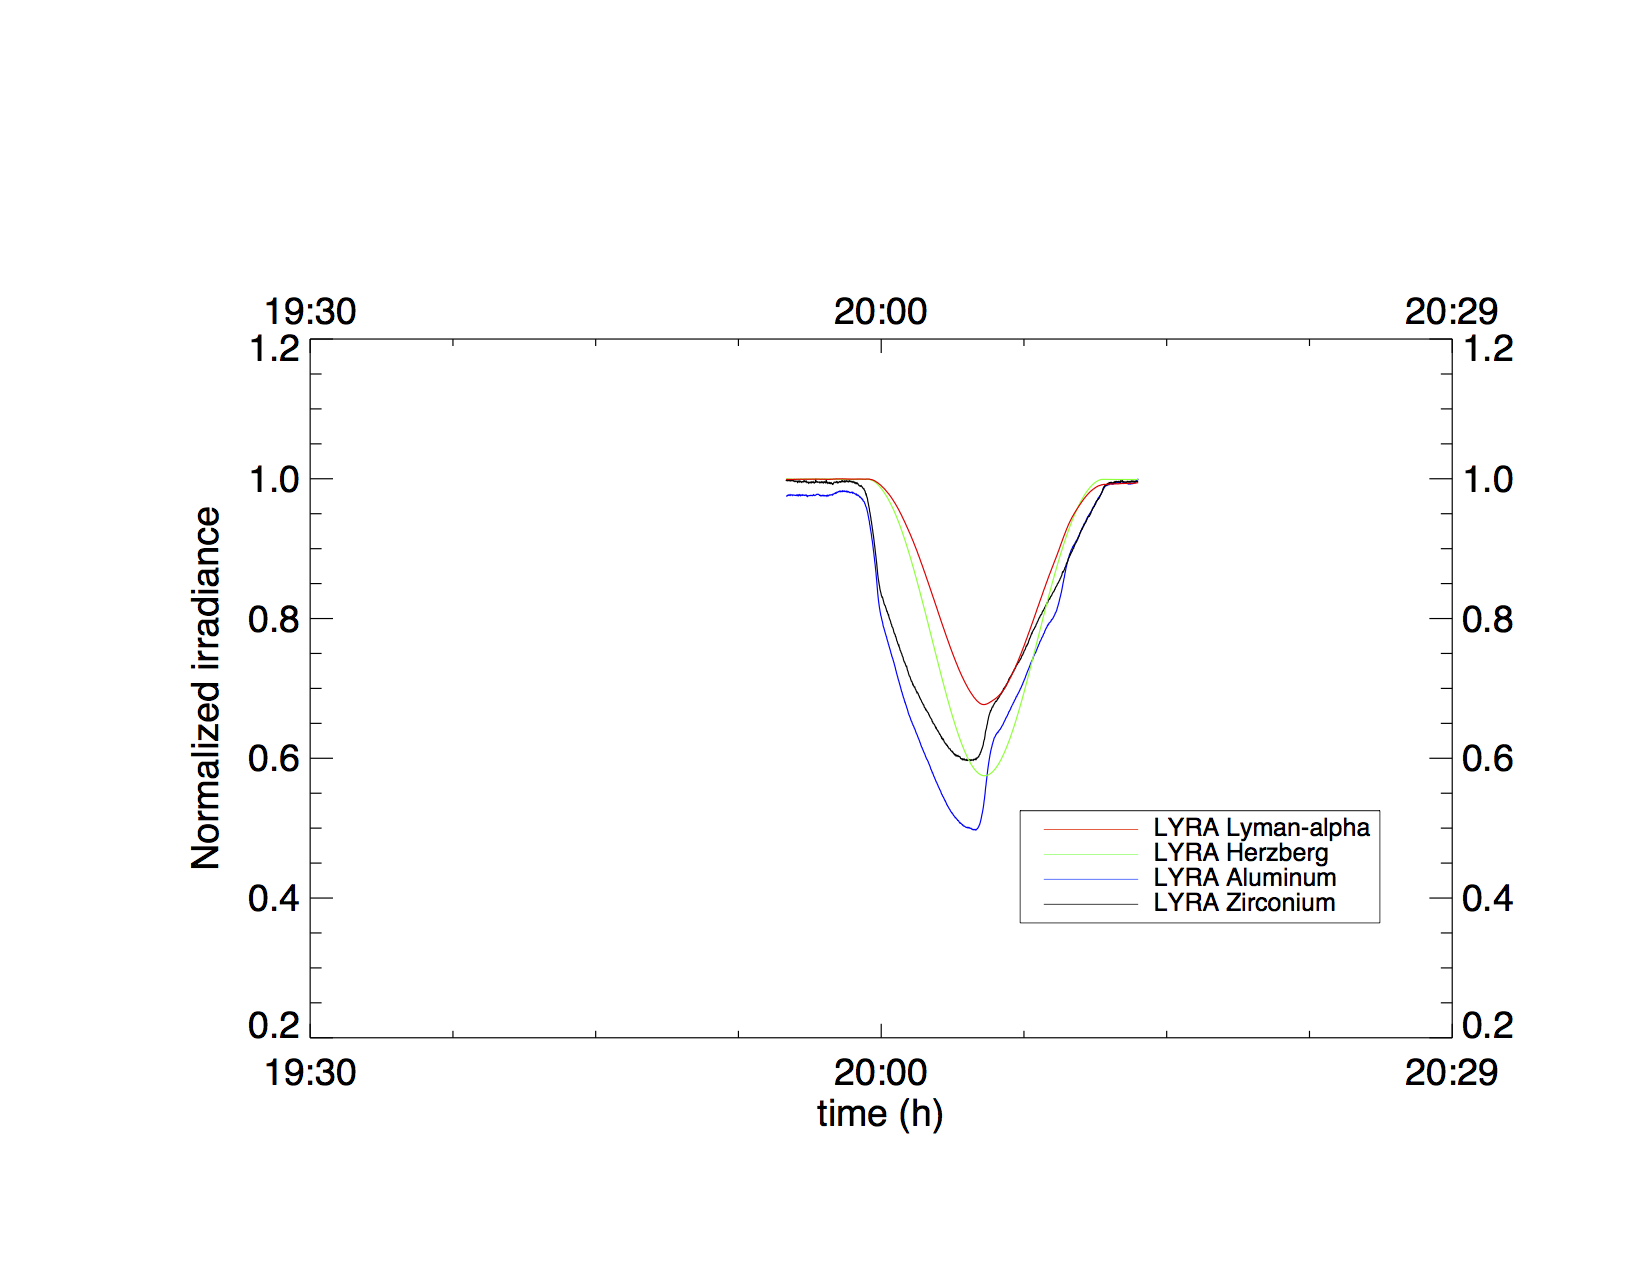
On February 15, the first partial eclipse (between 19:59 and 20:11 UT) was observed by LYRA, the above image shows the irradiance curves from LYRA throughout the event. Find LYRA fits files for this event here.
http://proba2.oma.be/Events/2018-Feb-15-SolarEclipse/lyra/
Review of solar activity
Flares
Solar activity was low.
The largest flare was a C1.5 class flare. Active Region (AR) 2699 was most active, showing considerable flux emergence and cancellation, producing the C1.5-class flare, which peaked at 01:35 UT on 12-feb-2018.
Solar wind: Coronal Mass Ejection
A halo CME was observed in the SOHO/LASCO C2 field of view at 01:25 UT on 2018-Feb-12. The CME had a speed of approximately 509 km/s and reached the Earth on 15-Feb-2018 at approximately 16:00 UT. The source region of the CME was NOAA AR 2699 which was near disk centre.
Proton flux
The greater than 10MeV proton flux remained at background levels throughout the week.
The International Sunspot Number
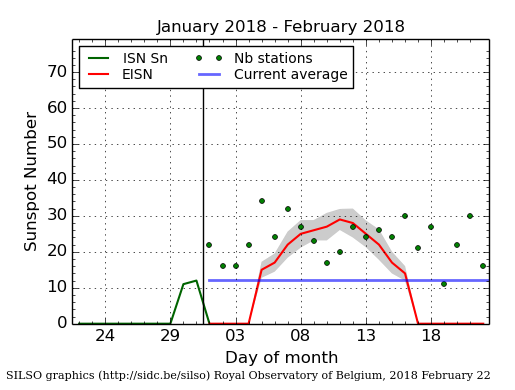
The daily Estimated International Sunspot Number (EISN, red curve with shaded error) derived by a simplified method from real-time data from the worldwide SILSO network. It extends the official Sunspot Number from the full processing of the preceding month (green line). The plot shows the last 30 days (about one solar rotation). The horizontal blue line shows the current monthly average, while the green dots give the number of stations included in the calculation of the EISN for each day.
Review of geomagnetic activity
Solar wind at L1
Over the past week the solar wind speed increased from around 250 to around 650 km/s. The total magnetic field strength fluctuated between 3 and 15 nT, peaking on 16-Feb-2018. The Bz component has fluctuated between -15 and +15 nT.
Magnetic conditions on Earth
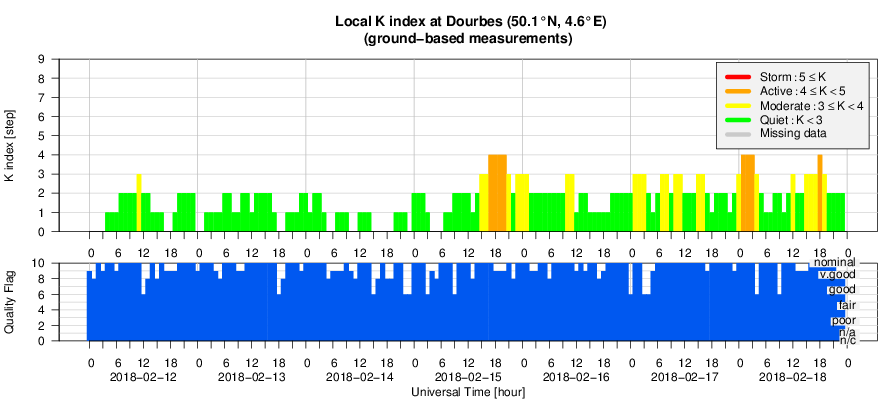
Geomagnetic conditions ranged between Kp index 0-4 (NOAA) and local K index 0-4 (Dourbes) over the past week.
Details on the impact of a Coronal Hole and Coronal Mass Ejection
A small negative polarity coronal hole passed the central meridian at the beginning of the week and the resulting High Speed Stream (HSS) caused enhancements in solar wind speeds and geomagnetic activity in the second half of the week.
The halo CME produced on 2018-Feb-12 created a shock, first observed on 15-Feb-2018 in DSCOVR observations, and enhanced solar wind speeds at Earth, causing enhanced geomagnetic conditions which reached Kp index 4 (NOAA) and local K index 4 (Dourbes).
Geomagnetic Observations at Dourbes (12 Feb 2018 - 18 Feb 2018)
The SIDC Space Weather Briefing
The Space Weather Briefing presented by the forecaster on duty from Feb 12 to 18. It reflects in images and graphs what is written in the Solar and Geomagnetic Activity report.
The pdf version: http://www.stce.be/briefings/SIDCbriefing-20180219.pdf
Review of ionospheric activity (12 Feb 2018 - 18 Feb 2018)
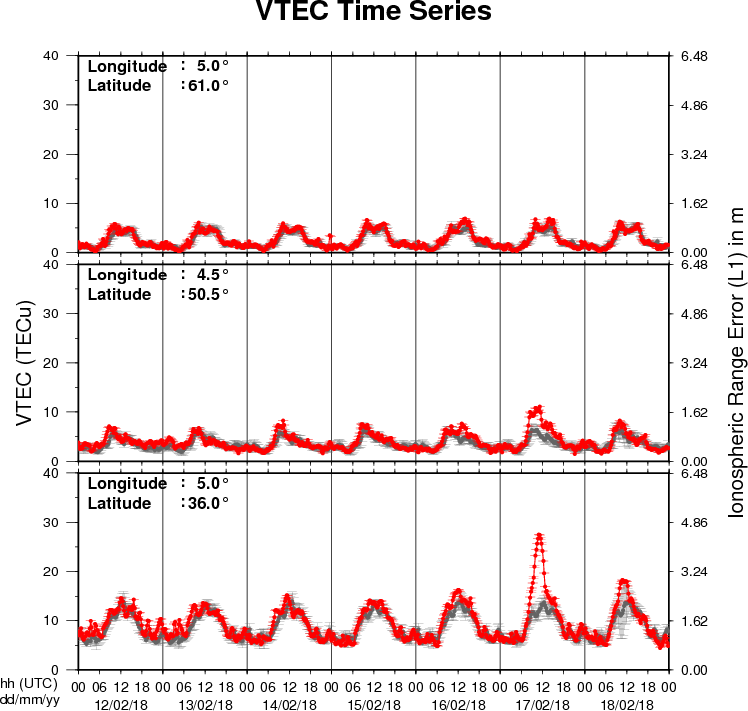
The figure shows the time evolution of the Vertical Total Electron Content (VTEC) (in red) during the last week at three locations:
a) in the northern part of Europe(N61°, 5°E)
b) above Brussels(N50.5°, 4.5°E)
c) in the southern part of Europe(N36°, 5°E)
This figure also shows (in grey) the normal ionospheric behaviour expected based on the median VTEC from the 15 previous days.
The VTEC is expressed in TECu (with TECu=10^16 electrons per square meter) and is directly related to the signal propagation delay due to the ionosphere (in figure: delay on GPS L1 frequency).
The Sun's radiation ionizes the Earth's upper atmosphere, the ionosphere, located from about 60km to 1000km above the Earth's surface.The ionization process in the ionosphere produces ions and free electrons. These electrons perturb the propagation of the GNSS (Global Navigation Satellite System) signals by inducing a so-called ionospheric delay.
See http://stce.be/newsletter/GNSS_final.pdf for some more explanations ; for detailed information, see http://gnss.be/ionosphere_tutorial.php