- Table of Content
- 1.Gravitational ...
- 2.Basic Solar Ph...
- 3.PROBA2 Observa...
- 4.Review of sola...
- 5.The Internatio...
- 6.Geomagnetic Ob...
- 7.Review of iono...
2. Basic Solar Physics seminars
3. PROBA2 Observations (26 Feb 2018 - 4 Mar 2018)
4. Review of solar and geomagnetic activity
5. The International Sunspot Number
6. Geomagnetic Observations at Dourbes (26 Feb 2018 - 4 Mar 2018)
7. Review of ionospheric activity (26 Feb 2018 - 4 Mar 2018)
Gravitational waves
In 2017, the detection of gravitational waves was honoured with the Nobel price for physics. A gravitational wave is a travelling disturbance of space-time. Any wave transports energy, in this case gravitational energy that moves at the speed of light. This is similar to electromagnetic waves, simply light, which is a moving disturbance of the electromagnetic field.
Contrary to measuring light, it is not so easy to measure a gravitational wave. It is more accurate to say that it is a challenge with a big C. The amplitude of the wave is so small that you can't imagine it. Its wavelength is so large that you need really large installations to 'see' the wave passing. Although we are surrounded with gravitational waves (we ourself disturb the gravitational field continuously), we can't easily 'see' or 'feel' the gravitational waves. Only really large events that involve the most massive objects of the universe like black holes, can create gravitational waves that are suitable candidates to be observed.
On June 20, 2018 Promoptica, the belgian association for the promotion of optics (http://www.promoptica.be/index.html) in collaboration with the STCE organises a conference in which the technical challenges of observing gravitational waves will be discussed.
June 20, Space Pole, Brussels, Belgium
Check: https://events.oma.be/indico/event/52/
Basic Solar Physics seminars
This is your change to revive the seminar on 'Solar radio observations'. It all started in 1902 with a first (failed) attempt to observe radio waves from the Sun in the French Alps, near Chamonix. These days, radio astronomy is a well established. The STCE has a group of very active radio astronomers doing really cool stuff in Humain, Belgium with a drone that listens to the name RAMONE, fat dipoles and horn antennas.

Check here: https://events.oma.be/indico/event/42/
PROBA2 Observations (26 Feb 2018 - 4 Mar 2018)
Solar Activity
Solar flare activity fluctuated between very low and low during the week.
In order to view the activity of this week in more detail, we suggest to go to the following website from which all the daily (normal and difference) movies can be accessed: http://proba2.oma.be/ssa
This page also lists the recorded flaring events.
A weekly overview movie can be found here (SWAP week 414).
http://proba2.oma.be/swap/data/mpg/movies/weekly_movies/weekly_movie_2018_02_26.mp4
Details about some of this week’s events, can be found further below.
If any of the linked movies are unavailable they can be found in the P2SC movie repository here
http://proba2.oma.be/swap/data/mpg/movies/
Friday Mar 02
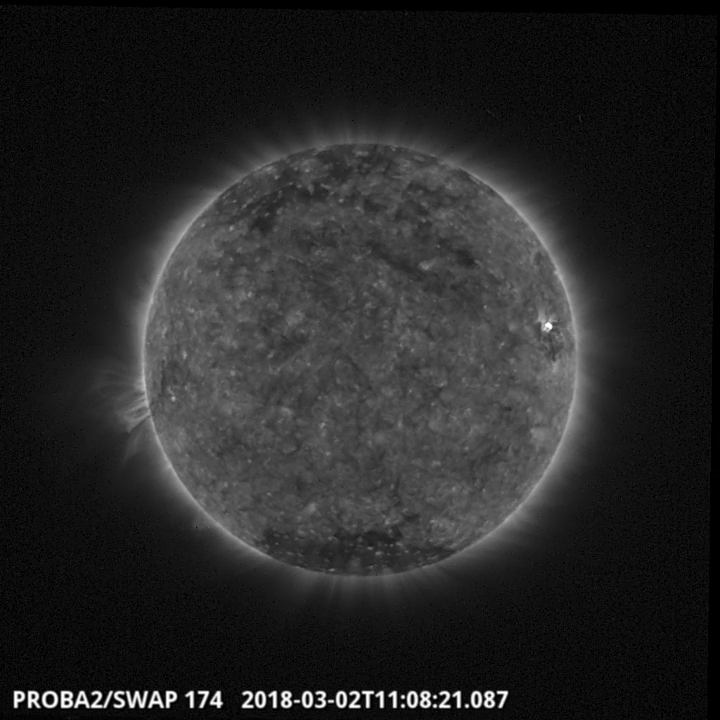
The largest flare of the week was a C-class (C1.9) flare associated with NOAA AR 2700. The flare is visible in the North-West part of the solar disk in the SWAP image above at 11:08 UT. The AR produced B-class flares throughout the whole week. Find a movie of the event here (SWAP movie)
http://proba2.oma.be/swap/data/mpg/movies/20180302_swap_movie.mp4
Review of solar and geomagnetic activity
SOLAR ACTIVITY
Solar flaring activity was low, with only one C-class and 11 B-class flares reported. All the flaring activity originated from the only sunspot group observed on the visible side of the solar disc, Catania sunspot group 73 (NOAA AR 2700).
No wide or Earth-directed CMEs were observed and the solar protons measured by the geostationary satellite GOES remained at the background level .
Three coronal holes were observed, on the visible side of the solar disc this week.
The coronal hole which reached the central meridian on February 26, was a small and patchy coronal hole near the solar equator.
Another coronal hole reached the central meridian on March 03, 2018. This southern coronal hole had a low latitude.
The third coronal hole of importance concerned the low latitude extension of a northern polar coronal hole which reached the central meridian on March 04, 2018.
GEOMAGNETIC ACTIVITY
A fast solar wind associated with the equatorial coronal hole which reached the central meridian on February 22 (previous week) arrived at Earth on February 26. The solar wind reached its maximum speed of about 560 km/s on February 27, around 15 UT. The longer intervals of the negative value of the Bz component of the interplanetary magnetic field combined with the fast solar wind induced disturbed geomagnetic conditions on February 27 (NOAA reported Kp=5 and local station at Dourbes reported K=4).
The increase of the solar wind speed (up to 460 km/s), the interplanetary magnetic field with strength up to 10 nT, the simultaneously decrease of density on March 03-04 at the L1 points, was probably associated with the solar equatorial coronal hole which reached the central meridian on February 26. This induced quiet to unsettled geomagnetic conditions.
The International Sunspot Number

The daily Estimated International Sunspot Number (EISN, red curve with shaded error) derived by a simplified method from real-time data from the worldwide SILSO network. It extends the official Sunspot Number from the full processing of the preceding month (green line). The plot shows the last 30 days (about one solar rotation). The horizontal blue line shows the current monthly average, while the green dots give the number of stations included in the calculation of the EISN for each day.
Geomagnetic Observations at Dourbes (26 Feb 2018 - 4 Mar 2018)

Review of ionospheric activity (26 Feb 2018 - 4 Mar 2018)

The figure shows the time evolution of the Vertical Total Electron Content (VTEC) (in red) during the last week at three locations:
a) in the northern part of Europe(N61°, 5°E)
b) above Brussels(N50.5°, 4.5°E)
c) in the southern part of Europe(N36°, 5°E)
This figure also shows (in grey) the normal ionospheric behaviour expected based on the median VTEC from the 15 previous days.
The VTEC is expressed in TECu (with TECu=10^16 electrons per square meter) and is directly related to the signal propagation delay due to the ionosphere (in figure: delay on GPS L1 frequency).
The Sun's radiation ionizes the Earth's upper atmosphere, the ionosphere, located from about 60km to 1000km above the Earth's surface.The ionization process in the ionosphere produces ions and free electrons. These electrons perturb the propagation of the GNSS (Global Navigation Satellite System) signals by inducing a so-called ionospheric delay.
See http://stce.be/newsletter/GNSS_final.pdf for some more explanations ; for detailed information, see http://gnss.be/ionosphere_tutorial.php