- Table of Content
- 1.The battle of ...
- 2.ESWW2018 - sub...
- 3.PROBA2 Observa...
- 4.Review of sola...
- 5.Review of geom...
- 6.Which type of ...
- 7.The SIDC Space...
- 8.The Internatio...
- 9.Geomagnetic Ob...
- 10.Review of iono...
2. ESWW2018 - submission of abstracts to sessions
3. PROBA2 Observations (5 Mar 2018 - 11 Mar 2018)
4. Review of solar activity
5. Review of geomagnetic activity
6. Which type of flux rope was out there on March 9?
7. The SIDC Space Weather Briefing
8. The International Sunspot Number
9. Geomagnetic Observations at Dourbes
10. Review of ionospheric activity (5 Mar 2018 - 11 Mar 2018)
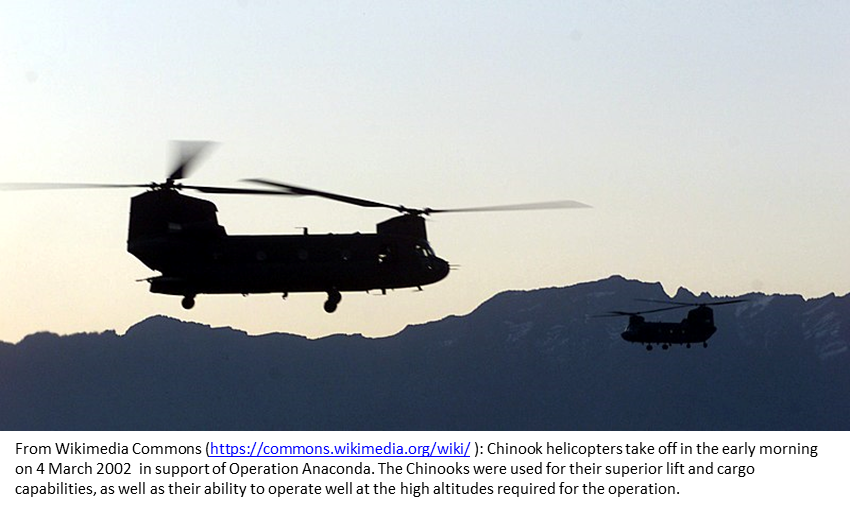
The battle of Takur Ghar
Operation Anaconda took place in Afghanistan from 1 to 18 March 2002. It was a large-scale international military campaign led by the United States aiming at the destruction of Al Qaeda and Taliban forces. A particular intense battle took place during the morning hours (before dawn) of 4 March on Takur Ghar, a 3191 meter high mountain top, as US Special Operations Forces came under heavy fire from the Al Qaeda and Taliban forces. A Chinook helicopter was directed to rescue the team. However, in view of the rocket-propelled grenades and heavy machine guns that the insurgents were using, a SATCOM (Satellite Communications) message was sent to the Chinook to avoid the mountain top. Unfortunately and despite repeated attempts, the Chinook helicopter never received that critical message. It landed on the top of Takur Ghar and came immediately under intense fire, resulting in several casualties.
A subsequent analysis of the incident blamed the radio outage on poor performance of the UHF (Ultra High Frequency) radios on the helicopters as well as on terrain radio interference. However, in 2014, Michael Kelly and his team of researchers from the John Hopkins University came to a different conclusion, offering a viable alternative for the outages. Utilizing a model that uses UV (ultraviolet) data from the TIMED spacecraft (http://www.timed.jhuapl.edu ) to retrieve the 3D electron density, they came to the conclusion that a combination of ionospheric disturbances with multipath effects (multiple radio reflections from the mountainous terrain) could also have caused the decreased communication links.
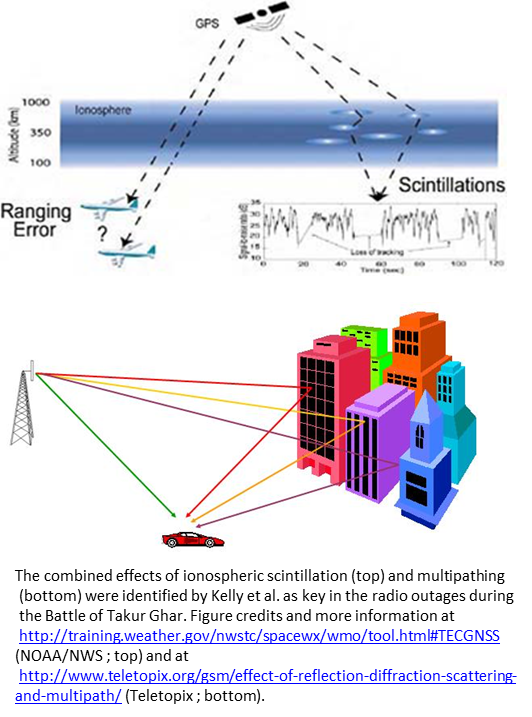
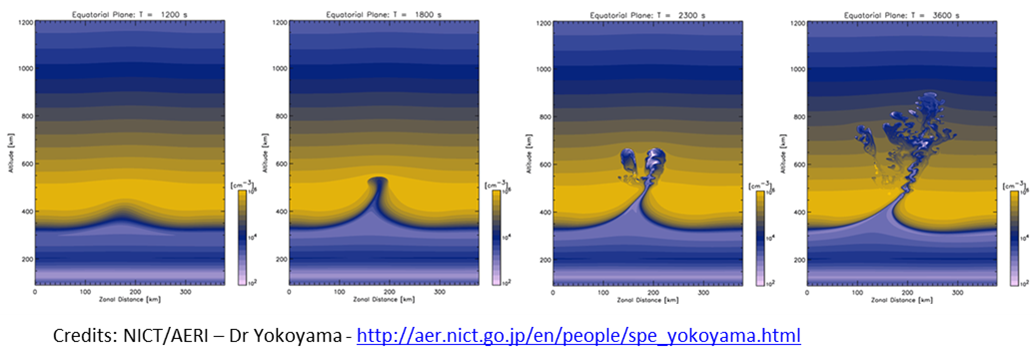
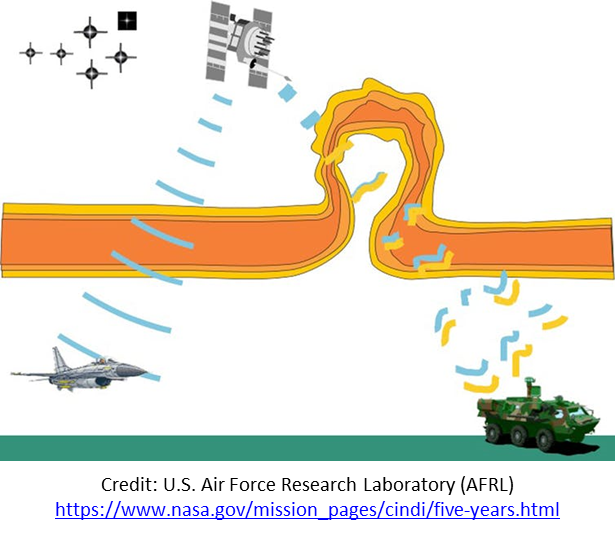
The main cause of the ionospheric unrest is the presence of equatorial plasma bubbles, i.e. depletions of electron density in the ionosphere. Their number correlates with the solar activity level, and they also are more numerous during the equinoxes (spring and autumn) than during the solstices (summer and winter). They usually form after sunset at the bottom of the F-region (main ionospheric layer), where small low-density irregularities can grow into turbulent bubbles - see a model underneath (covering 40 minutes) developed by Dr Yokoyama (NICT/AERI). The bubbles have a typical size of about 100 km and their effects usually end around midnight. They can occur during relatively minor levels of geomagnetic activity, especially during solar maximum. Radio wave propagation can be severely affected in terms of power and intensity as these waves travel through small scale structures in the ionosphere (i.e. scintillation of radio waves).
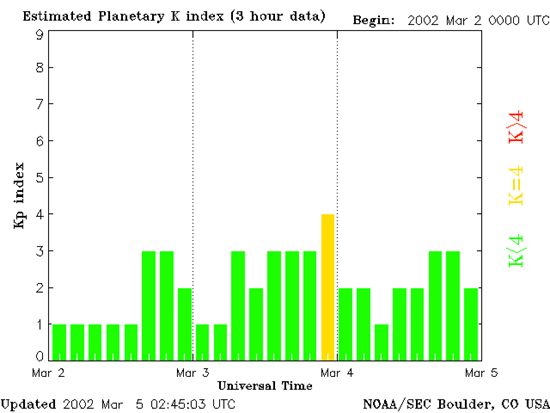
At first sight, one would expect relatively strong geomagnetic activity to explain the ionospheric disturbances, but this was not the case on 3-4 March. Quiet to unsettled geomagnetic conditions were observed, with a single active episode during the 21-24UT interval on 3 March. According to Kelly et al., this suppressed the generation of the evening-side depletions and delayed the onset of the ionospheric bubbles until after midnight.
However, analysis of the data from the TIMED satellite led Kelly and his team to conclude that the plasma bubbles affecting the Takur Ghar war theatre did not have very steep density gradients, and thus would have resulted only in mild ionospheric disturbances. Normally, this mild ionospheric "scintillation" is not a problem for SATCOM, but the intensity of the already weakened radio signals could have further been reduced by the multiple reflections from the surrounding mountains. Hence they conclude that "... the destructive multipath interference from complex terrain reflections coupled with scintillation could cause a signal blackout. ..."
Several important lessons can be learned from the incident and the related research by Kelly and his team. Ionospheric anomalies have the potential to disrupt communications during military operations, hence space-based ionospheric sensing is critical for accurate monitoring and forecasting of ionospheric effects on radio communications. These space weather anomalies have the potential to impact future operations at all times during the solar cycle, and even mild perturbations in combination with terrain interference or other sources can be sufficient to cause radio outages.
Further reading
- Kelly et al. (2014): Progress toward forecasting of space weather effects on UHF SATCOM after Operation Anaconda
http://adsabs.harvard.edu/abs/2014SpWea..12..601K
- The Conversation (2014): Bad space weather may have caused fatal Afghan gun battle
https://theconversation.com/bad-space-weather-may-have-caused-fatal-afghan-gun-battle-32081
- NASA/GSFC (2013): Celebrating NASA's CINDI on Its Fifth Anniversary
https://www.nasa.gov/mission_pages/cindi/five-years.html
- Yokoyama et al. (NICT/AERI): Observation and modeling of "ionosphere": the entrance to space
http://aer.nict.go.jp/en/people/spe_yokoyama.html
- A sketch showing the combined effect of ionospheric scintillations and multipathing was prepared by Dr Nicolar Bergeot (ROB / GNSS) at http://www.stce.be/news/420/welcome.html
Ionospheric research and products at the STCE
- ROB/GNSS: http://gnss.be/Atmospheric_Maps/ionospheric_maps.php
- RMI/Dourbes: http://digisonde.oma.be/
- BISA: http://www.aeronomie.be/en/topics/earthsystem/ionosphere.htm
ESWW2018 - submission of abstracts to sessions
15th European Space Weather Week (ESWW)
November 5-9, 2018
Leuven, Belgium
URL: http://www.stce.be/esww2018

Dear ESWW enthusiast
A while ago, the ESWW2018 Programme Committee launched the Call for Sessions. Thanks to all who contributed! The PC is now working hard to get the list of sessions streamlined. By the end of March the list will be published.
The submission of abstracts to sessions opens on April 1, without joking. The deadline for submission is May 18. We appreciate that these dates are earlier than for previous editions of ESWW, but this is necessary to avoid logistical issues that have arisen in the past.
You are probably thinking: ‘This is too early!’. But we are convinced that this shouldn’t be a problem. In fact, you know what you are working on, and you don’t have to present results in the abstract, just keep them for the conference.
Submission of contributions to sessions will be blank by default. The session conveners will assign the label 'poster' or 'oral'. If you prefer to have a poster and no oral presentation, you can indicate this choice in the submission form. You will be notified if, in case of acceptance, whether you have been assigned a poster or an oral presentation by the end of June.
For now, you can find information about the format and sessions at the URL: http://www.stce.be/esww2018/session.php
We will notify you when the list of sessions is published and when the submission of abstracts opens.
Kind regards
Mauro Messerotti and Petra Vanlommel, on behalf of the Programme Committee
PROBA2 Observations (5 Mar 2018 - 11 Mar 2018)
Solar Activity
Solar flare activity remained very low during the week.
In order to view the activity of this week in more detail, we suggest to go to the following website from which all the daily (normal and difference) movies can be accessed: http://proba2.oma.be/ssa
This page also lists the recorded flaring events.
A weekly overview movie can be found here (SWAP week 415): http://proba2.oma.be/swap/data/mpg/movies/weekly_movies/weekly_movie_2018_03_05.mp4
Details about some of this week's events, can be found further below.
If any of the linked movies are unavailable they can be found in the P2SC movie repository here: http://proba2.oma.be/swap/data/mpg/movies/
Tuesday Mar 06
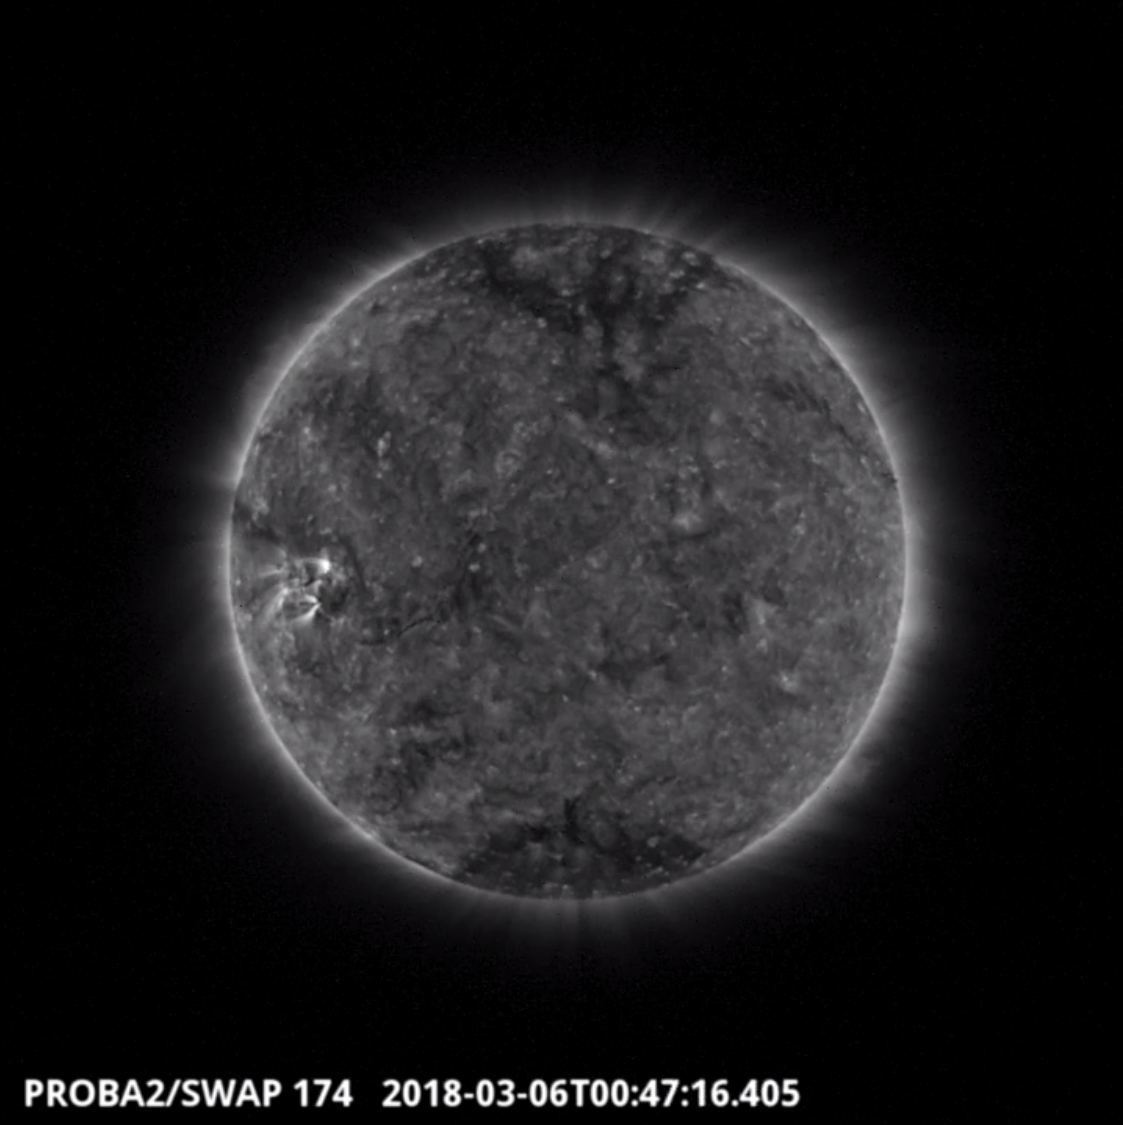
A filament was observed by SWAP on 2018-Mar-06, as shown in the SWAP image above at 00:47, where the filament appears to the east of the centre of the solar disk.
Find a movie of the feature here (SWAP movie): http://proba2.oma.be/swap/movies/20180306_swap_movie.mp4
Review of solar activity
Solar X ray flux remained below B level throughout the week. With no spotted regions on the visible disk chances for flare occurrences remained very low.
A very faint and slow CME was visible SOHO/LASCO C2 images from around March 6, 1:25 UT. It was primarily directed towards the south west and given its faint character, its angular extent could not clearly be determined. Based on Stereo A COR2 images it could not be excluded that Earth was on the propagation path. A possible arrival of the magnetic cloud was expected around March 9, 14:30UT (see more in the section 'Review of geomagnetic activity') but given its faint nature and slow speed possible impacts were anticipated to be fairly insignificant.
After 16:00 UT, March 6 SDO/AIA 304 images showed the eruption of a filament stretching from around S18E35 to the disk centre. SOHO/LASCO coronagraph images did not display any identifiable CME signature, but an associated narrow (40 degree width) CME was visible in Stereo A COR2 images from around midnight March 6/7 (propagating to the west as seen from Stereo A location). The location of the erupting filament together with the direction as seen by Stereo indicated that Earth could be on the propagation path of the ejecta. Given the slow speed (400 km/s as measured from the Stereo A COR2 images) and the faint nature of the event, possible impacts on Earth were again expected to be fairly insignificant, and were not due to arrive before noon March 10.
Proton flux levels were at background values throughout the week.
Review of geomagnetic activity
Solar wind conditions were initially near nominal with only some minor enhancements. Around 17:25UT March 9 a shock at the L1 point was detected in the solar wind marking the arrival of most probably the faint and slow CME of early March 6. By 23:00UT March 9, the solar wind speed reached around 450 km/s and the total magnetic field reached 15nT.
The passage of the CME showed a nice magnetic cloud signature. The total magnetic field remained around 15 nT for most of March 10, while speed gradually declined to under 400 km/s. The Bz component of the magnetic field was consistently negative for a significant amount of time at the start of the cloud passage (down to -12nT), then gradually becoming positive by the end of the CME passage. The magnetic field phi angle displayed a similar gradual shift due to the rotation of the magnetic field as the cloud was passing.
By noon March 11 solar wind conditions had recovered to near nominal.
There were no indications of any arrival of the second CME.
Geomagnetic conditions were mostly quiet (both local K Dourbes and NOAA Kp 0-2), but reached active conditions (NOAA Kp 4) in the afternoon of March 9 with the CME arrival and the associated consistent negative values of Bz.
Which type of flux rope was out there on March 9?
It is a nice exercise to figure out which type of flux rope - there are 8 - passed the spacecraft DSCOVR measuring solar wind parameters at L1. Let's start our investigation.
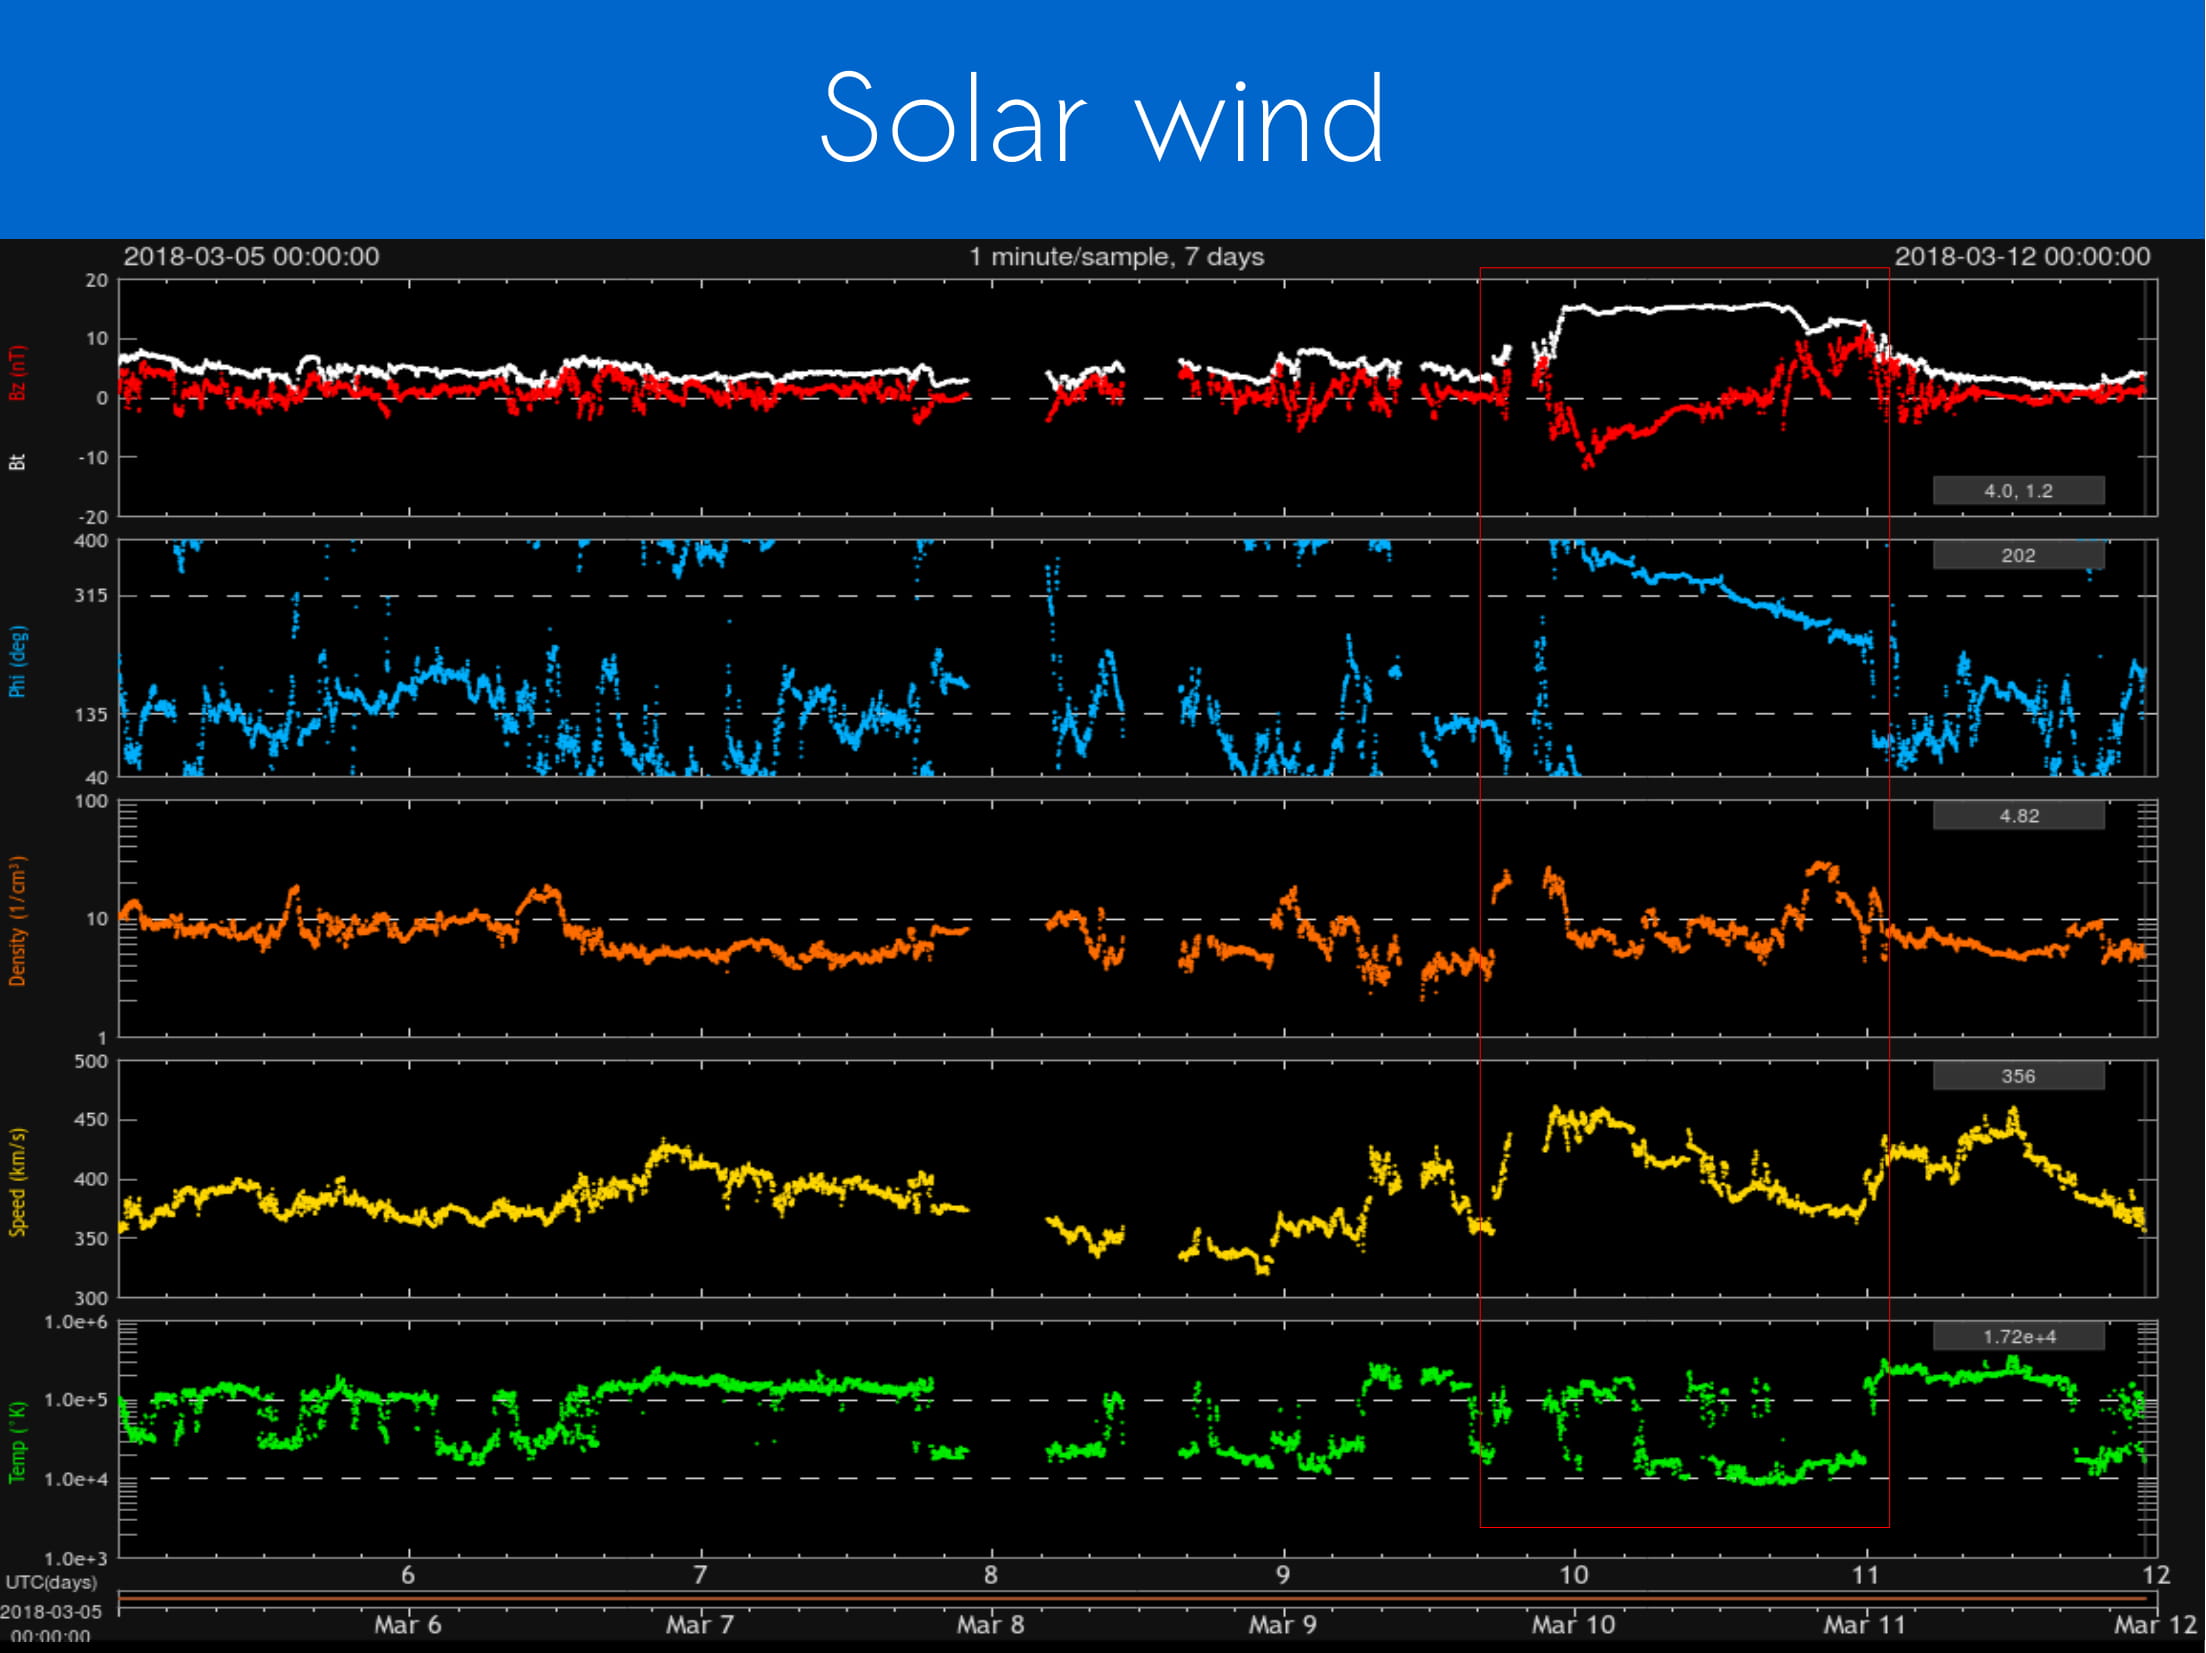
The graph below is what DSCOVR measured. The box in red shows the cloud.
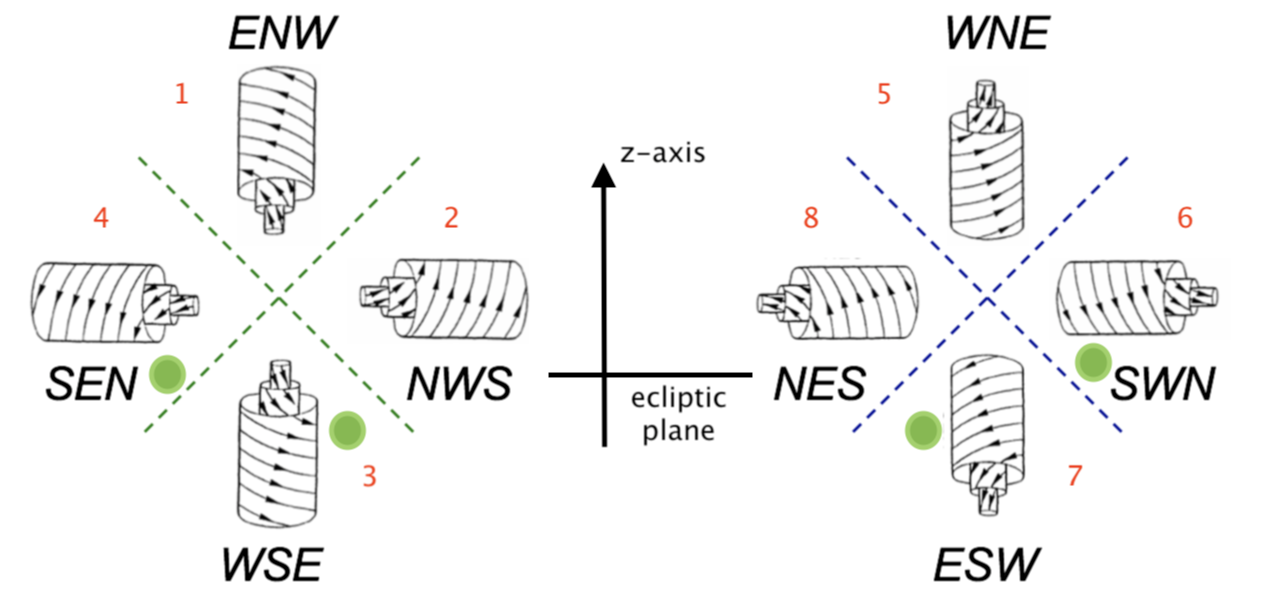
The picture below shows the 8 types of flux ropes, the ecliptic plane is a horizontal plane perpendicular to the figure. The z-axis is the vertical axis in the plane of the picture. The point of view is from Earth, so Earth is in front of the cartoon. The Sun is behind the cartoon.
Because Bz (DSCOVR, top panel, red curve) is going from negative to positive values following the DSCOVR measurements, only cartoon 3, 4, 6 and 7 are possible candidates.
Let us now use the measurements for the angle PHI (DSCOVR, second panel, blue curve). PHI gives us information about the orientation of the magnetic field in the ecliptic plane: outward (away from the Sun) when PHI is an angle between 90 and 180 degrees, inward (towards the Sun) when PHI is an angle between 270 and 360 degrees.
For cartoon 3, it would mean that the cloud passed the space craft on the left, for cartoon 4 and 6, from below, for cartoon 7, on the right (the green dot represents the spacecraft).
Because the CME was seen to go into the south west direction in LASCO images (see review of solar activity), we can conclude that cartoon 7 is the most suitable candidate. Here we finish our investigation.
The SIDC Space Weather Briefing
The Space Weather Briefing presented by the forecaster on duty from March 5 to 11. It reflects in images and graphs what is written in the Solar and Geomagnetic Activity report.
Movie on the filament eruption: http://www.stce.be/briefings/20180306_11_01_05_2018_03_06_22_59_05_AIA_304-hq2.mp4
LASCO movie: http://www.stce.be/briefings/20180308_c2_combo.mp4
COR2A movie: http://www.stce.be/briefings/20180305_18_24_00_2018_03_07_17_54_00_COR2-A-hq.mp4
The pdf version of the briefing: http://www.stce.be/briefings/SIDCbriefing-20180312.pdf
The International Sunspot Number
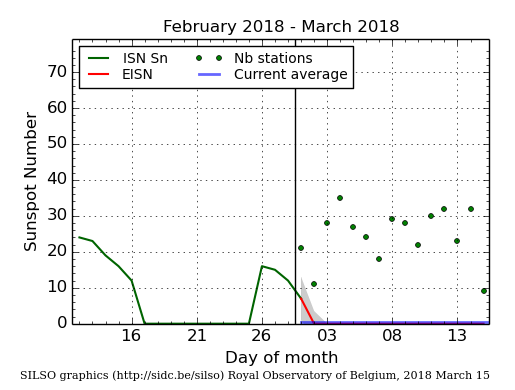
The daily Estimated International Sunspot Number (EISN, red curve with shaded error) derived by a simplified method from real-time data from the worldwide SILSO network. It extends the official Sunspot Number from the full processing of the preceding month (green line). The plot shows the last 30 days (about one solar rotation). The horizontal blue line shows the current monthly average, while the green dots give the number of stations included in the calculation of the EISN for each day.
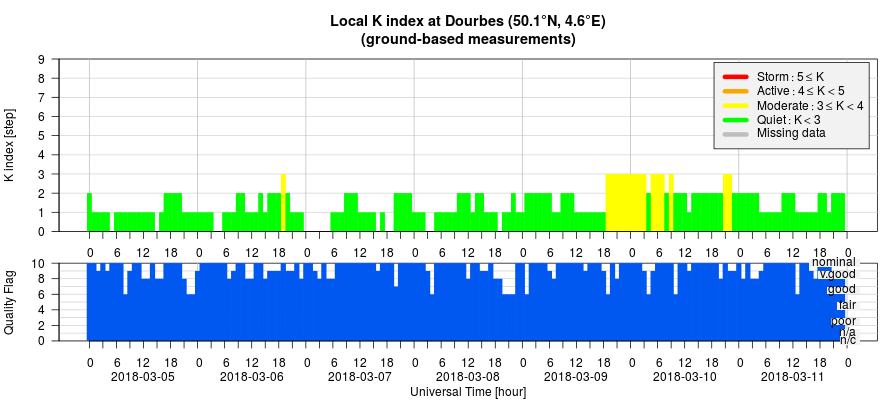
Geomagnetic Observations at Dourbes
Review of ionospheric activity (5 Mar 2018 - 11 Mar 2018)
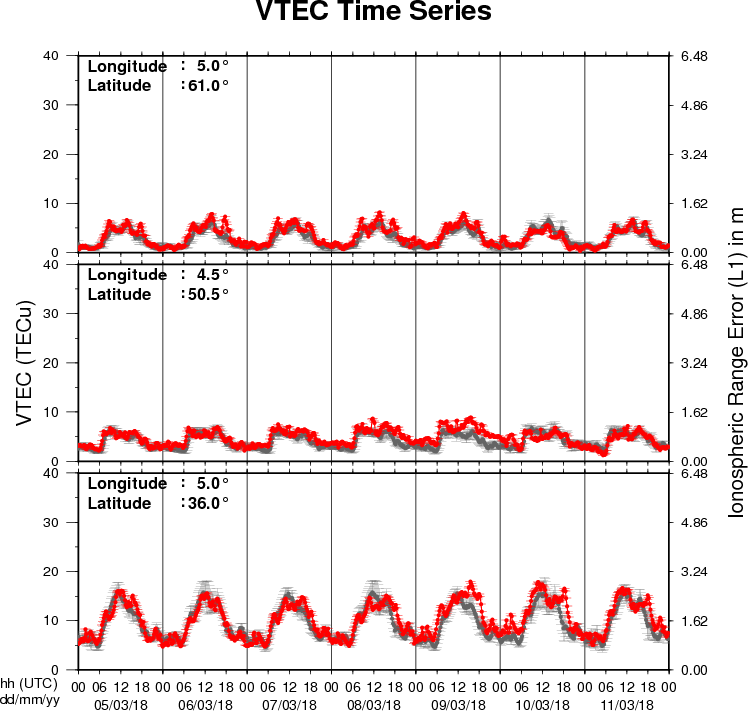
The figure shows the time evolution of the Vertical Total Electron Content (VTEC) (in red) during the last week at three locations:
a) in the northern part of Europe(N61°, 5°E)
b) above Brussels(N50.5°, 4.5°E)
c) in the southern part of Europe(N36°, 5°E)
This figure also shows (in grey) the normal ionospheric behaviour expected based on the median VTEC from the 15 previous days.
The VTEC is expressed in TECu (with TECu=10^16 electrons per square meter) and is directly related to the signal propagation delay due to the ionosphere (in figure: delay on GPS L1 frequency).
The Sun's radiation ionizes the Earth's upper atmosphere, the ionosphere, located from about 60km to 1000km above the Earth's surface.The ionization process in the ionosphere produces ions and free electrons. These electrons perturb the propagation of the GNSS (Global Navigation Satellite System) signals by inducing a so-called ionospheric delay.
See http://stce.be/newsletter/GNSS_final.pdf for some more explanations ; for detailed information, see http://gnss.be/ionosphere_tutorial.php