- Table of Content
- 1.The STCE in 20...
- 2.ESWW2018 sessi...
- 3.STCE at the mo...
- 4.Basic Solar Ph...
- 5.PROBA2 Observa...
- 6.Review of sola...
- 7.Geomagnetic Ob...
- 8.The SIDC Space...
- 9.The Internatio...
- 10.Review of iono...
2. ESWW2018 session titles
3. STCE at the movies
4. Basic Solar Physics seminars - Magnetohydrodynamics
5. PROBA2 Observations (12 Mar 2018 - 18 Mar 2018)
6. Review of solar and geomagnetic activity
7. Geomagnetic Observations at Dourbes
8. The SIDC Space Weather Briefing
9. The International Sunspot Number
10. Review of ionospheric activity (12 Mar 2018 - 18 Mar 2018)
The STCE in 2016
The STCE Annual Report 2016 is now available at http://www.stce.be/annualReport
It is a compilation of the activities done in 2016 within the frame of the Solar-Terrestrial Centre of Excellence (STCE). This report continues the style from the previous editions. Hence, as it is targeting a more general public, it presents only a selection of the 2016-activities in easy-to-digest summaries.
These bite-sized articles emphasize the intense collaboration between the institutes at the Space Pole, as well as with our external partners. One of the key events was certainly the celebration of the STCE's 10th anniversary, but the report features many other highlights such as the new expert service centre for space radiation, the Mercury transit on 9 May, the European Space Weather Week, the latest on solar radio astronomy, HELIOS, LIDAR, nowcasting local geomagnetic activity, EUREF GNSS Infrastructure, and much, MUCH more...
We wish you an enjoyable reading experience!
ESWW2018 session titles
Next week, April 1, session titles of the European Space Weather Week in November 2018 - http://www.stce.be/esww2018/ - will be published. From that moment you can submit abstracts to the sessions.
Brace yourself, it's almost submission time!

STCE at the movies
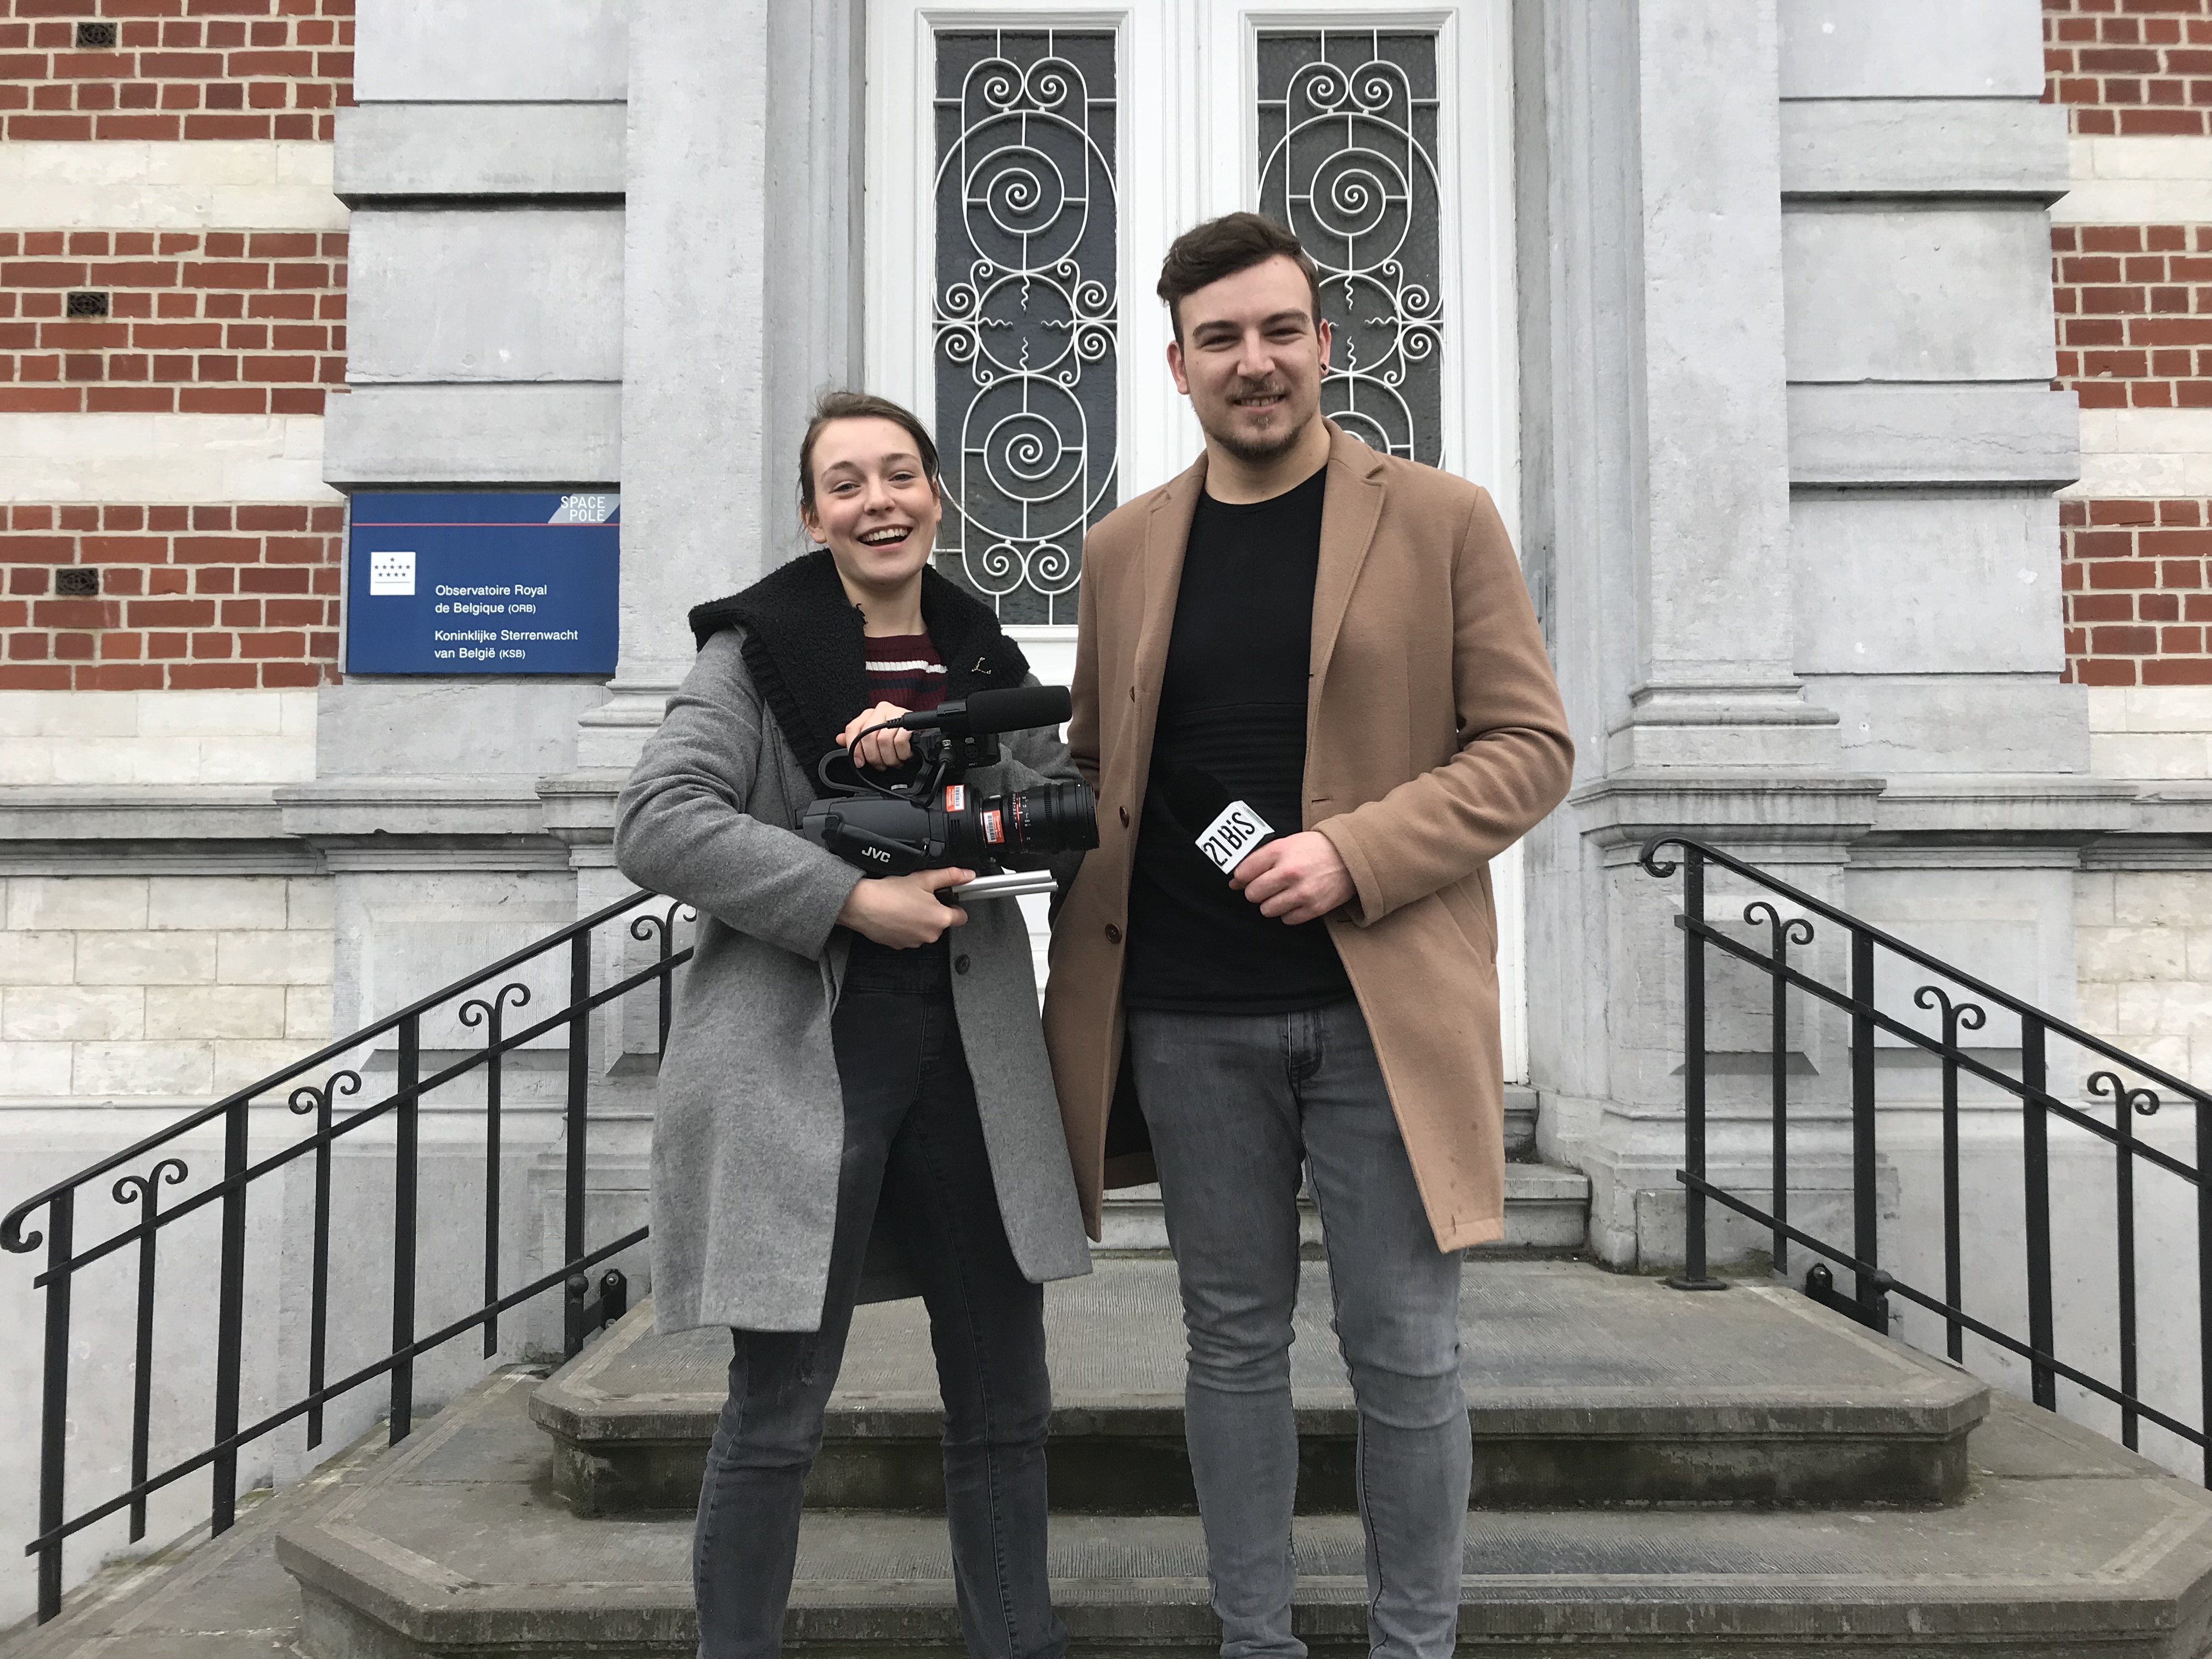
It was an interesting morning in the headquarters of the STCE.
Marie and Gio, 2 students from the school Thomas More, journalism in Mechelen, Belgium visited the beating heart of space weather services. They are making a documentary for their online mediaplatform 21bis (http://www.21bis.be ). While roaming through the corridors, Marie and Gio bumped into technicians, scientists, operators, software developers, ... talking with passion and enthusiasm about their job.
Curious about their footage.
Basic Solar Physics seminars - Magnetohydrodynamics
Hydrodynamics with a pinch of magnetism, or is it magnetism with a pinch of hydrodynamics?
Anyway, Dana Talpeanu has been cooking with magnetism, plasma, dynamics, mass, gasses following the recipe of magnetohydrodynamics.
The cookbook with video materiaal can be found here: https://events.oma.be/indico/event/43/
Enjoy your meal!
PROBA2 Observations (12 Mar 2018 - 18 Mar 2018)
Solar Activity
Solar flare activity was very low during the week.
In order to view the activity of this week in more detail, we suggest to go to the following website from which all the daily (normal and difference) movies can be accessed: http://proba2.oma.be/ssa
This page also lists the recorded flaring events.
A weekly overview movie can be found here (SWAP week 416).
http://proba2.oma.be/swap/data/mpg/movies/weekly_movies/weekly_movie_2018_03_12.mp4
Details about some of this week’s events, can be found further below.
If any of the linked movies are unavailable they can be found in the P2SC movie repository here
http://proba2.oma.be/swap/data/mpg/movies/
Monday Mar 12
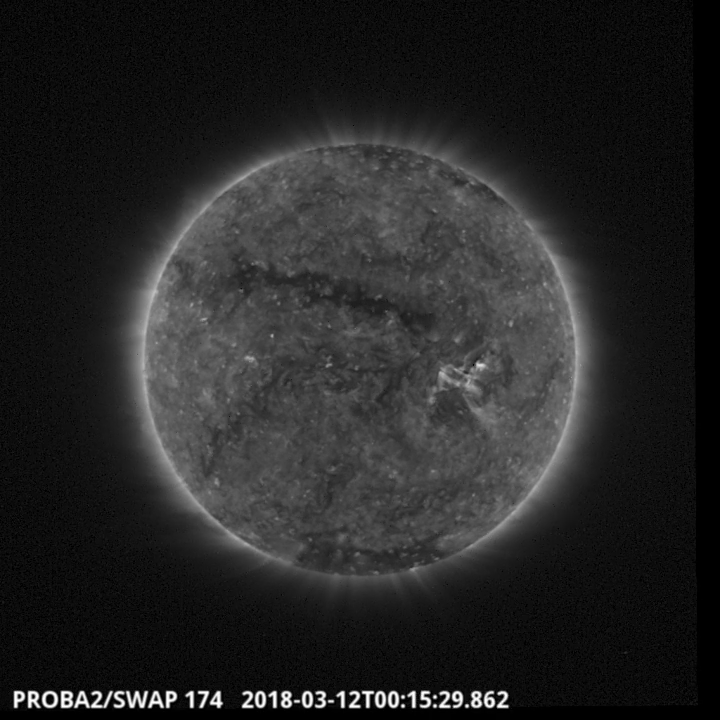
The image above shows an elongated coronal hole which transited the central meridian - SWAP image
Find a movie of the events here (SWAP movie)
http://proba2.oma.be/swap/data/mpg/movies/20180312_swap_movie.mp4
Review of solar and geomagnetic activity
SOLAR ACTIVITY
Solar activity was low. No significant flares have been recorded. Two small active regions (AR) were observed. NOAA 2701 was a small short-lived sunspot group near disk centre and visible for only a few hours on 15 March. NOAA 2702 was visible on 17 and 18 March.
The greater than 10MeV proton flux remained at background levels throughout the week.
There were no Earth-directed CMEs detected. A low latitude negative polarity coronal hole rotated from disk centre and through the western hemisphere.
GEOMAGNETIC ACTIVITY
Over the past week, the solar wind speed increased from around 300 to around 600 km/s due to the low latitude coronal hole. The total magnetic field strength fluctuated between 3 and 12 nT, peaking on 16 Mar 2018. The Bz component fluctuated between -10 and +10 nT.
Geomagnetic conditions were quiet on 12 and 13 March. As a result of the wind stream associated with the aforementioned coronal hole, active intervals (Kp = 4) were daily observed for the rest of the week, with moderate storming (Kp = 6) at the end of the period.
Geomagnetic Observations at Dourbes

The SIDC Space Weather Briefing
The Space Weather Briefing presented by the forecaster on duty from March 12 to March 18. It reflects in images and graphs what is written in the Solar and Geomagnetic Activity report.
Solar active region evolution movie, HMI magnetogram: http://www.stce.be/briefings/movie1_20180312_HMI_Mag-hq.mp4
Solar active region evolution movie, HMI continuum: http://www.stce.be/briefings/movie2_20180312_HMI_Int-hq.mp4
SOHO/LASCO movie: http://www.stce.be/briefings/movie3_20180317_c2_combo.mp4
the pdf version of the briefing: http://www.stce.be/briefings/SIDCbriefing-20180320.pdf
The International Sunspot Number
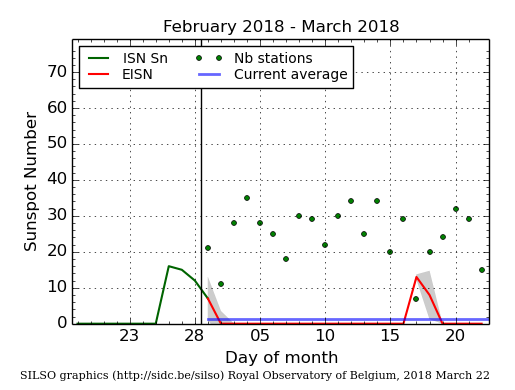
The daily Estimated International Sunspot Number (EISN, red curve with shaded error) derived by a simplified method from real-time data from the worldwide SILSO network. It extends the official Sunspot Number from the full processing of the preceding month (green line). The plot shows the last 30 days (about one solar rotation). The horizontal blue line shows the current monthly average, while the green dots give the number of stations included in the calculation of the EISN for each day.
Review of ionospheric activity (12 Mar 2018 - 18 Mar 2018)
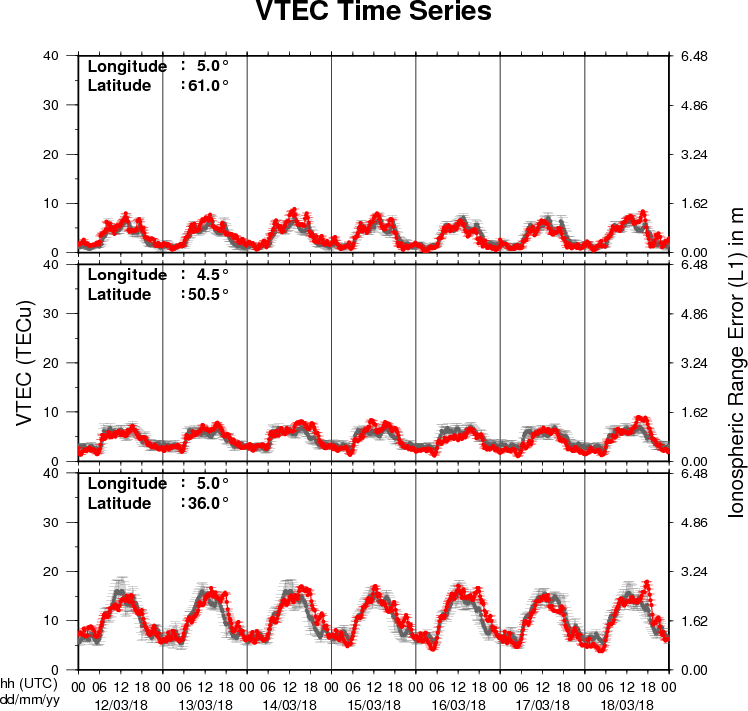
The figure shows the time evolution of the Vertical Total Electron Content (VTEC) (in red) during the last week at three locations:
a) in the northern part of Europe(N61°, 5°E)
b) above Brussels(N50.5°, 4.5°E)
c) in the southern part of Europe(N36°, 5°E)
This figure also shows (in grey) the normal ionospheric behaviour expected based on the median VTEC from the 15 previous days.
The VTEC is expressed in TECu (with TECu=10^16 electrons per square meter) and is directly related to the signal propagation delay due to the ionosphere (in figure: delay on GPS L1 frequency).
The Sun's radiation ionizes the Earth's upper atmosphere, the ionosphere, located from about 60km to 1000km above the Earth's surface.The ionization process in the ionosphere produces ions and free electrons. These electrons perturb the propagation of the GNSS (Global Navigation Satellite System) signals by inducing a so-called ionospheric delay.
See http://stce.be/newsletter/GNSS_final.pdf for some more explanations ; for detailed information, see http://gnss.be/ionosphere_tutorial.php