- Table of Content
- 1.What a differe...
- 2.ESWW2018 - sub...
- 3.Space Weather ...
- 4.Basic Solar Ph...
- 5.PROBA2 Observa...
- 6.Review of sola...
- 7.The SIDC space...
- 8.The Internatio...
- 9.Geomagnetic Ob...
- 10.Review of iono...
2. ESWW2018 - submission of abstracts to sessions
3. Space Weather Summer Camping
4. Basic Solar Physics seminars - Solar Irradiance
5. PROBA2 Observations (19 Mar 2018 - 25 Mar 2018)
6. Review of solar and geomagnetic activity
7. The SIDC space weather Briefing
8. The International Sunspot Number
9. Geomagnetic Observations at Dourbes (19 Mar 2018 - 25 Mar 2018)
10. Review of ionospheric activity (19 Mar 2018 - 25 Mar 2018)
What a difference 4 years make!
The low solar activity of the last few months does not only manifest itself in many spotless days and significantly reduced flaring activity, it is also noticeable in the number of observed coronal mass ejections (CMEs). A CME is an ejection of charged particles ("plasma") from or through the solar corona, often -but not always- as a result from eruptive processes on the Sun. If such particle clouds impact Earth, they can result in significant geomagnetic storms.
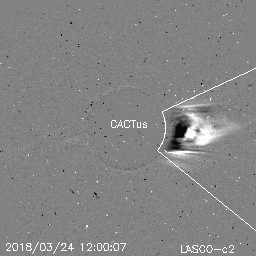
As we are heading for the next solar cycle minimum and solar activity continues to decrease, it comes as no surprise that we are observing only very few CMEs. This was also true for the month of March 2018, with just a handful of CMEs recorded by the coronagraphs from the SOHO spacecraft (https://sohowww.nascom.nasa.gov/ ). A coronagraph is an instrument that creates a permanent artificial solar eclipse such that the immediate surroundings of the Sun can be observed and any ejected plasma cloud (= CME) is detected.
Some of these disturbances are weak, so the very handy CACTus tool (http://www.sidc.oma.be/cactus/ ) was developed to help with the identification and typical characteristics of a CME, such as its plane-of-the-sky speed and width. CACTus is short for "Computer Aided CME Tracking", the "us" was conveniently added by a creative mind. Developed by the SIDC (Solar Influences Data analysis Center; http://www.sidc.be/ ) during the early years of the 21st century, the tool automatically detects CMEs in SOHO's coronagraphic imagery and quickly provides a list of the CMEs, much faster and more objectively than a human operator can.
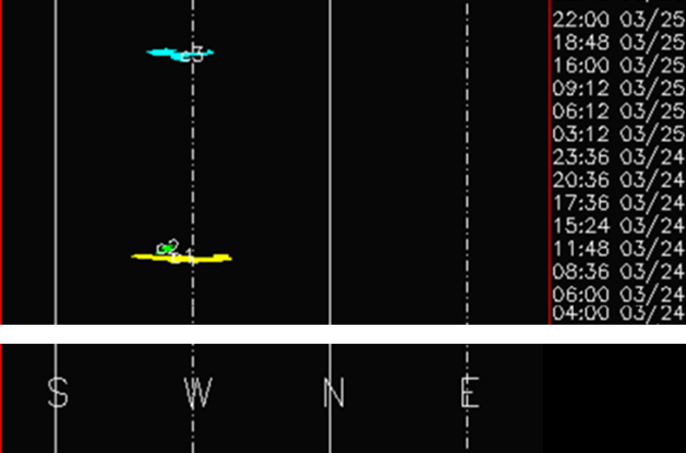
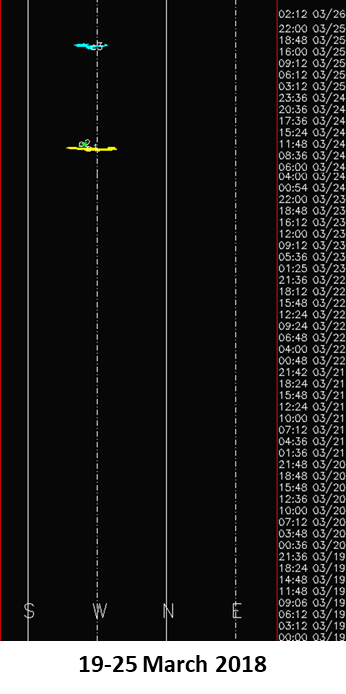
An example of the CACTus output showing CME activity for the entire week of 19 till 25 March 2018 can be found underneath, as well as a close-up for 24-25 March (above). Note time is running vertically (upward), and the horizontal axis gives the position/width in a counter-clockwise direction (south-west-north-east) along the solar limb. The CMEs are the coloured irregular lines ("wrinkles"), the colours being added to more easily distinguish the various CMEs. Only 2 (two) CMEs were detected over the entire week, both of them being small and ejected to the west and away from Earth. The 24 March CME is also shown in the imagery above.
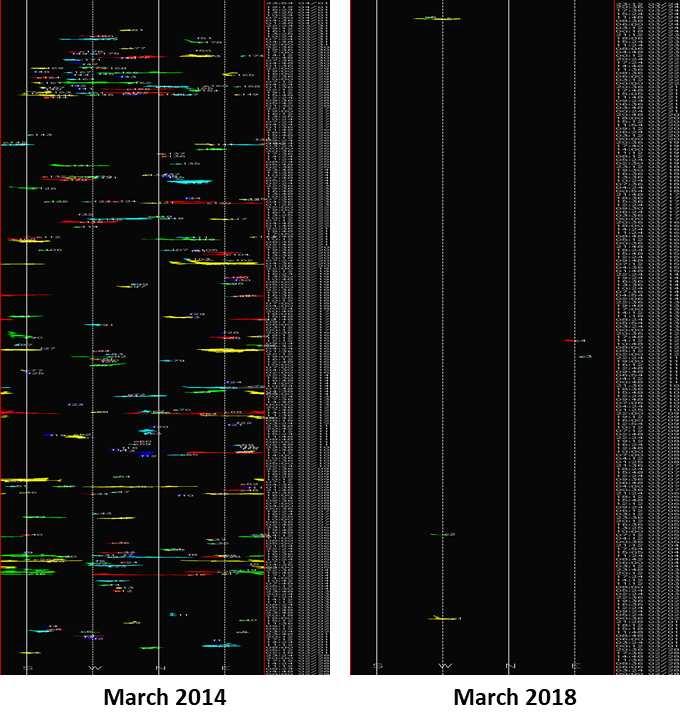
Two is obviously not an impressive number, and it's getting even worse when one looks at the entire month of March (graph underneath, right). So far, i.e. until 24 March, only a handful of CMEs have been detected! Going back just 4 years to March 2014, CACTus paints us an entirely different picture (graph underneath, left). Solar Cycle 24 (SC24) was near its maximum and so was solar activity. CMEs were abundant, with no less than 181 events reported! This means on the average about 6 CMEs *daily*, almost the number that has been observed over the entire month of March 2018! Needless to say, space weather forecasters had their hands full at that time determining whether or not these CMEs were going to impact Earth, and when and how intense the strike would be. Ah, those were the days!...
Further reading:
- Robbrecht, E. and Berghmans, D., Automated recognition of coronal mass ejections (CMEs) in near-real-time data, AandA 425, 1097-1106 (2004)
http://adsabs.harvard.edu/abs/2004A%26A...425.1097R
- More info on and results from CACTus are at http://www.sidc.oma.be/cactus/ , with the latest CME detections at http://www.sidc.oma.be/cactus/out/latestCMEs.html
- CACTus results for imagery from the STEREO coronagraphs can be found at https://secchi.nrl.navy.mil/cactus/
ESWW2018 - submission of abstracts to sessions

2nd announcement
*** Submission of abstracts to sessions ***
Dear ESWW enthusiast
The Easter Bunny dropped an exquisite list of ESWW2018 sessions! With a lot of help of the conveners and the PC.
The session conveners and the PC invite you to submit an abstract to a session: http://www.stce.be/esww2018/program/sessions.php
The deadline for submission is May 18.
Happy Easter and happy submission!
Mauro Messerotti and Petra Vanlommel, on behalf of the Programme Committee
P.S. The call for Topical Discussion Meetings and all the info about it will be send shortly. To stay in the theme: figs after Easter.
Space Weather Summer Camping
Did you know that Space Weather Camping exists?
The University of Alabama in Huntsville (UAH), the South African Space Agency (SANSA) and DLR Neustrelitz organise it. All have a strong arm in the development of rockets, missiles, and eventually manned space flight. An annual Joint Space Weather Summer Camp (JSWSC) was perfect to forge ties between them.
Over twenty students from Alabama, Germany, South Africa participate in a multiple week series of lectures, hands-on projects and experiments and excursions as they learn both the theoretical underpinnings and practical applications of Space Weather and solar and space physics.
The JSWSC consists of two consecutive sessions. This year, the first session will be held in Northern Germany: 01.07-30.07.2018.
A flyer (in English and German): http://www.dlr.de/dlr/Portaldata/1/Resources/documents/2018/Flyer_Summer_Camp_18_2018.01.25.pdf
During the second session the students visit Huntsville, Alabama.
Alex Kasten invites students in a German university or Germans studying abroad, to apply. Send your application to alexander.kasten@dlr.de:
* CV
* Your degrees and the latest transcript of records (if you don't have a Bachelor, your A-level)
* A letter of recommendation (a recommendation for the DLR_Summer_Camp)
* A statement of purpose (max. 500 words), answering following questions:
* What academic goals do you have for this program?
* Describe any extracurricular activities and/or achievements that are relevant for this program.
* What are your long-term goals (academically and professionally)? In which way could the summer camp help you to reach these goals?
Deadline is 30th of March - a very short notice.
If you are interested, be fast :-)
On behalf of Alex Kasten
Basic Solar Physics seminars - Solar Irradiance
On March 23, it was Marie Dominique to shed her light on the Sun as an emitter of photons revealing some mysteries on the solar spectrum, the sun as a heating device, as a variable light bulb and more.
Enlighten your knowledge: https://events.oma.be/indico/event/44/
PROBA2 Observations (19 Mar 2018 - 25 Mar 2018)
Solar Activity
Solar flare activity remained very low during the week.
In order to view the activity of this week in more detail, we suggest to go to the following website from which all the daily (normal and difference) movies can be accessed: http://proba2.oma.be/ssa
This page also lists the recorded flaring events.
A weekly overview movie can be found here (SWAP week 417): http://proba2.oma.be/swap/data/mpg/movies/weekly_movies/weekly_movie_2018_03_19.mp4
Details about some of this week's events, can be found further below.
If any of the linked movies are unavailable they can be found in the P2SC movie repository here: http://proba2.oma.be/swap/data/mpg/movies/
Friday Mar 23
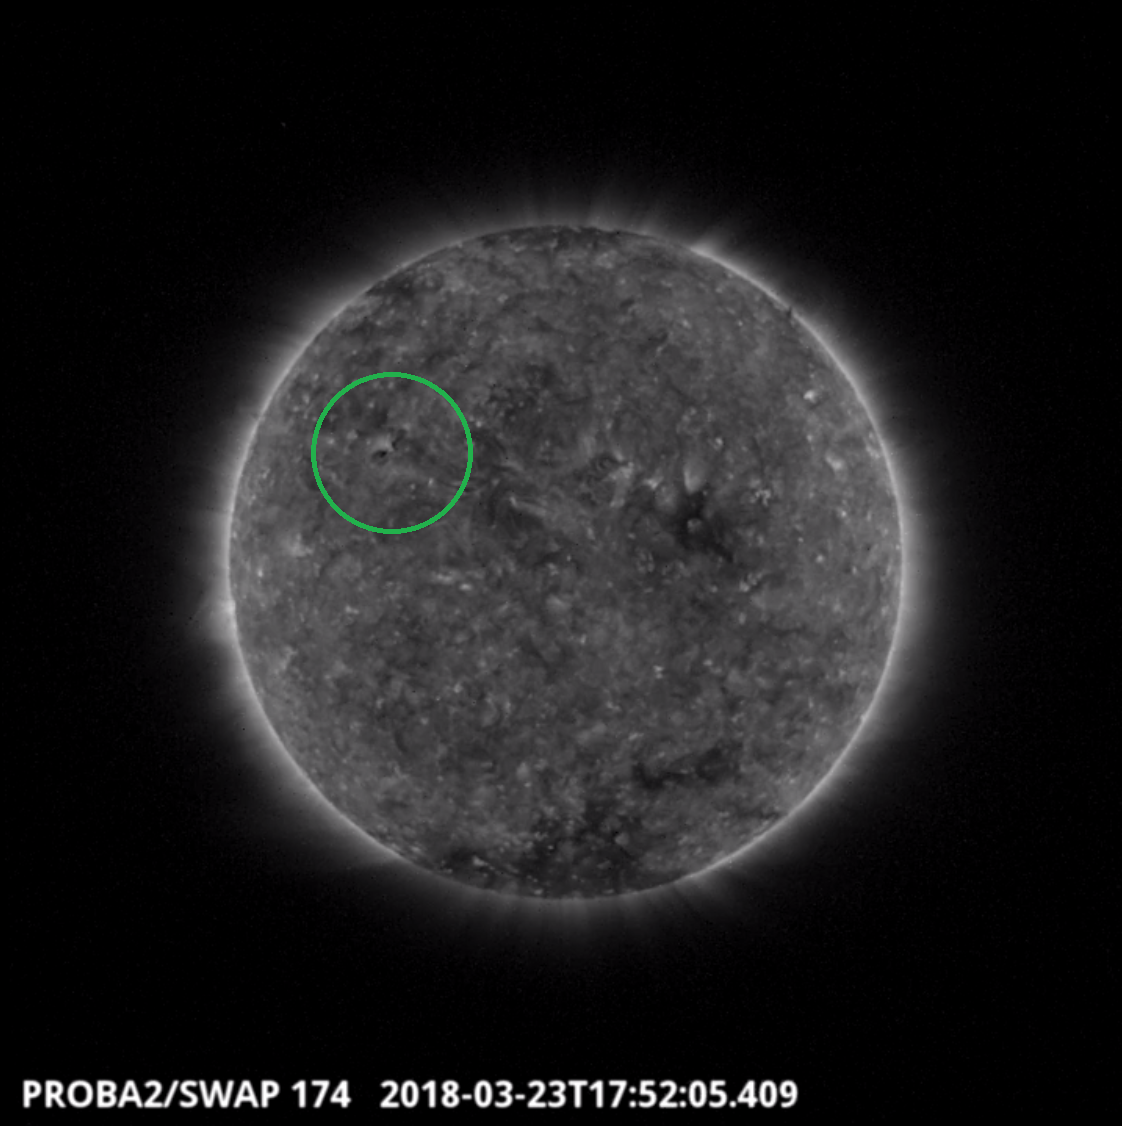
A small expanding dimming region was observed by SWAP in the north-east quadrant of the solar disk on 2018-Mar-23 at 17:52 UT.
Find a movie of the event here (SWAP movie): http://proba2.oma.be/swap/movies/20180323_swap_movie.mp4
Review of solar and geomagnetic activity
SOLAR ACTIVITY
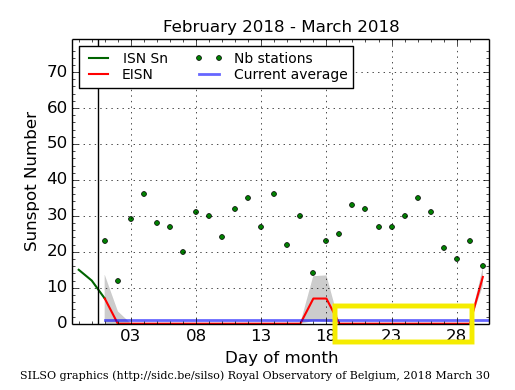
Solar activity was at very low levels. The solar disk was devoid of sunspots for the entire week. The Estimated International Sunspot Number was zero as can be seen in the graph below (yellow box):
No earth-directed coronal mass ejections (CMEs) were observed. The only two CMEs recorded by CACTus (resp. on 24 and 25 March) originated from the Sun's farside.
Some small and diffuse equatorial coronal holes (CH) were observed, as well as a weak leading and a better-defined trailing extension of the negative polarity southern polar CH.
The greater than 10 MeV proton flux was at nominal levels.
GEOMAGNETIC ACTIVITY
Except for 21 and most of 22 March when solar wind was at nominal levels, the earth environment was under the influence of CH solar wind streams. On 19 March, the solar wind speed was near 610 km/s. The solar wind was associated with a negative polarity equatorial CH wind stream. Late on 22 March, the wind stream of the extensions of the negative polarity southern polar CH arrived. Solar wind speed gradually increased from about 320 km/s to 500 km/s early on 24 and early on 25 March. By the end of the period, the solar wind speed was again increasing to values above 500 km/s. Bz was mostly oscillating between -6 and +6 nT, with some stronger excursions between -9 and +8 nT late on 22 March. The interplanetary magnetic field was mostly directed towards the Sun.
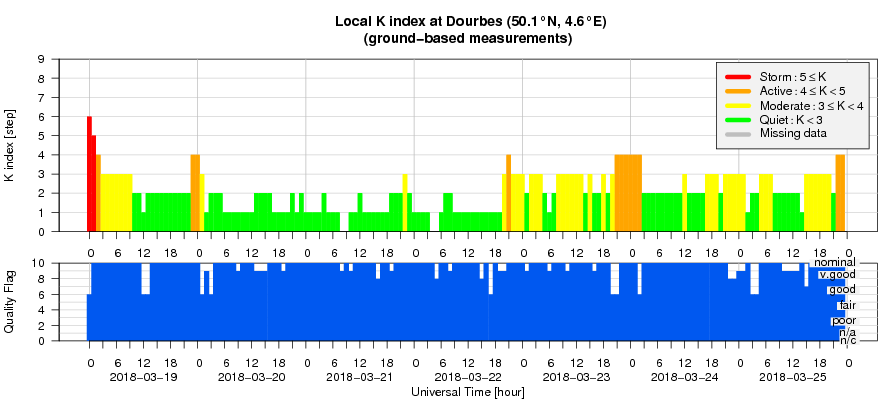
Except for a minor storming interval at the very beginning of the period, mostly quiet to unsettled geomagnetic conditions were observed throughout the week, with active episodes recorded by Dourbes and in the Kp index on 19, 22 (Dourbes only), 23, 24 (Kp only) and 25 March.
The SIDC space weather Briefing
The Space Weather Briefing presented by the forecaster on duty from 19 to 25 March. It reflects in images and graphs what is written in the Solar and Geomagnetic Activity report.
24 March CME movie: http://www.stce.be/briefings/3_CME_24Mar.mp4
View on the coronal holes movie: http://www.stce.be/briefings/4_20180325074619_512_aia_0193.mp4
The pdf version of the briefing: http://www.stce.be/briefings/SIDCbriefing-20180326.pdf
The International Sunspot Number
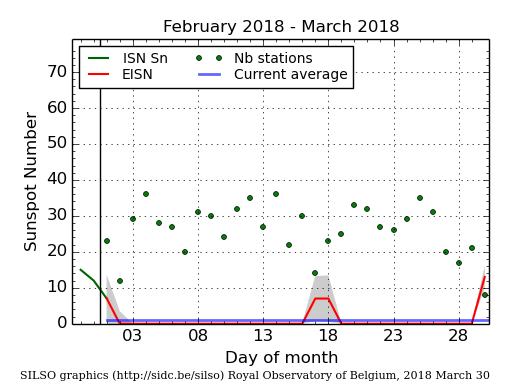
The daily Estimated International Sunspot Number (EISN, red curve with shaded error) derived by a simplified method from real-time data from the worldwide SILSO network. It extends the official Sunspot Number from the full processing of the preceding month (green line). The plot shows the last 30 days (about one solar rotation). The horizontal blue line shows the current monthly average, while the green dots give the number of stations included in the calculation of the EISN for each day.
Geomagnetic Observations at Dourbes (19 Mar 2018 - 25 Mar 2018)
Review of ionospheric activity (19 Mar 2018 - 25 Mar 2018)
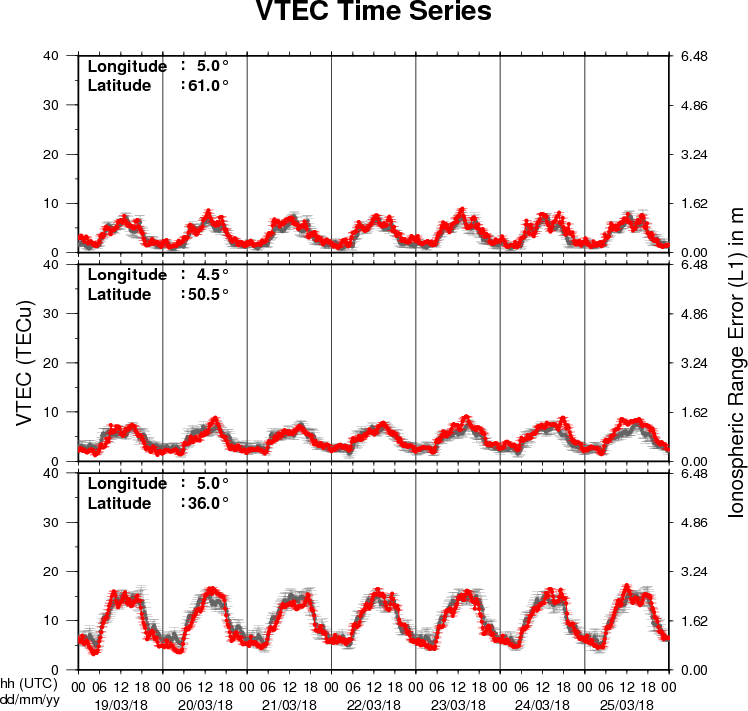
The figure shows the time evolution of the Vertical Total Electron Content (VTEC) (in red) during the last week at three locations:
a) in the northern part of Europe(N61°, 5°E)
b) above Brussels(N50.5°, 4.5°E)
c) in the southern part of Europe(N36°, 5°E)
This figure also shows (in grey) the normal ionospheric behaviour expected based on the median VTEC from the 15 previous days.
The VTEC is expressed in TECu (with TECu=10^16 electrons per square meter) and is directly related to the signal propagation delay due to the ionosphere (in figure: delay on GPS L1 frequency).
The Sun's radiation ionizes the Earth's upper atmosphere, the ionosphere, located from about 60km to 1000km above the Earth's surface.The ionization process in the ionosphere produces ions and free electrons. These electrons perturb the propagation of the GNSS (Global Navigation Satellite System) signals by inducing a so-called ionospheric delay.
See http://stce.be/newsletter/GNSS_final.pdf for some more explanations ; for detailed information, see http://gnss.be/ionosphere_tutorial.php