- Table of Content
- 1.JSWSC Topical ...
- 2.your input for...
- 3.A stealthy son...
- 4.PROBA2 Observa...
- 5.Review of sola...
- 6.The Internatio...
- 7.Review of geom...
- 8.Geomagnetic Ob...
- 9.SIDC space wea...
- 10.Review of iono...
2. your input for ESWW2018
3. A stealthy song
4. PROBA2 Observations (16 Apr 2018 - 22 Apr 2018)
5. Review of solar activity
6. The International Sunspot Number
7. Review of geomagnetic activity
8. Geomagnetic Observations at Dourbes (16 Apr 2018 - 22 Apr 2018)
9. SIDC space weather briefing
10. Review of ionospheric activity (16 Apr 2018 - 22 Apr 2018)
JSWSC Topical Issues
The graveyard of past deadlines has just received two new members.
The Journal of Space Weather and Space Climate (JSWSC) has currently two open topical issues.
The due date for the submissions for the topical issue "System Science: Application to Space Weather Analysis, Modelling, and Forecasting“ has been extended to 15 June 2018.
The due date for the submissions for the topical issue "Planetary Space Weather“ has been extended to 15 July 2018.
More info and details on these topical issues are at the JSWSC webpage at https://www.swsc-journal.org/news , and a summary is at the STCE webpage at http://www.stce.be/news/412/welcome.html
your input for ESWW2018

If you want to share your work with others, don't forget to submit an abstract: http://www.stce.be/esww15/program/sessions.php
If you want to have an open discussion on a space weather topic of your interest, don't forget to submit a Topical Discussion Meeting: http://www.stce.be/esww15/tdm.php
A stealthy song
A song with no name because it's superstealthy - written at a very successful ISSI meeting
in Swiss by two ISSIsters, Erika Palmerio and Stephanie Yardley. The melody of the song is from the Beatles, Yesterday.

Stealthy
Oh this CME is so stealthy
I’m not the forecaster that I used to be
‘Cause now I believe in stealth CMEs
Flux rope
I’ve been trying to find it but nope
So many blobs in my imagery
Oh this is just a stealth CME
*bridge*
I’ve been searching for arcades
and EIT waves
dimmings and filaments don’t work
for stealth CMEs
Suddenly
I decided to make an ISSI team
12 people and 2 young ladies
Because I am @halocme
*bridge*
But now we’ve been at work so long
for one whole week
and still we can’t figure out
these stealth CMEs
Geoeffectivity
it is something that you can’t predict
even worse with true stealth CMEs
according to Andrei’s categories
Check also: https://www.youtube.com/watch?v=9MEEzyxJ_cw
PROBA2 Observations (16 Apr 2018 - 22 Apr 2018)
Solar Activity
Solar flare activity was very low during the week.
In order to view the activity of this week in more detail, we suggest to go to the following website from which all the daily (normal and difference) movies can be accessed: http://proba2.oma.be/ssa
This page also lists the recorded flaring events.
A weekly overview movie can be found here (SWAP week 421).
http://proba2.oma.be/swap/data/mpg/movies/weekly_movies/weekly_movie_2018_04_16.mp4
Details about some of this week’s events, can be found further below.
If any of the linked movies are unavailable they can be found in the P2SC movie repository here
http://proba2.oma.be/swap/data/mpg/movies/
Friday Apr 20
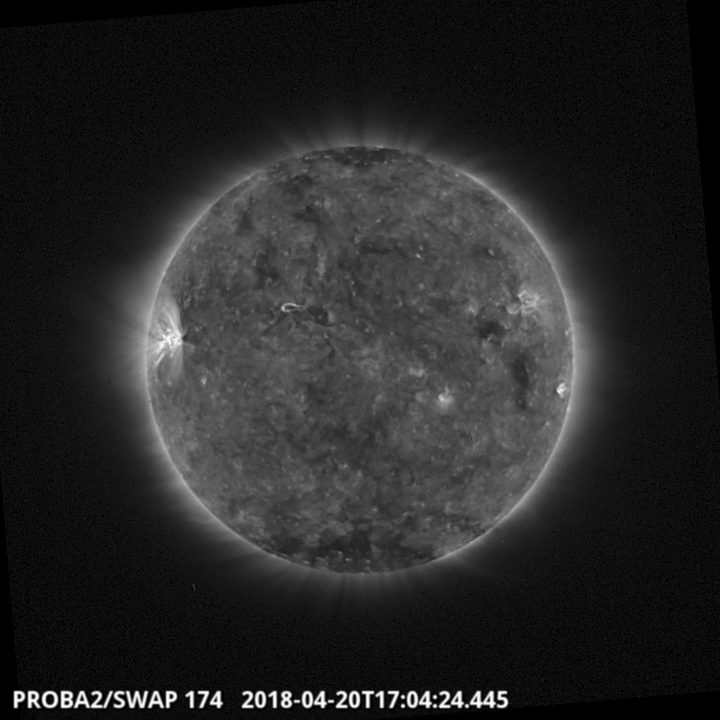
The largest flare of the week was a B5.3 associated with NOAA AR 2706. The flare is visible in the North-East part of the solar disk in the SWAP image above at 17:04 UT. The AR produced several B-class flares throughout the whole week. Find a movie of the event here(SWAP movie)
http://proba2.oma.be/swap/data/mpg/movies/20180420_swap_movie.mp4
Review of solar activity
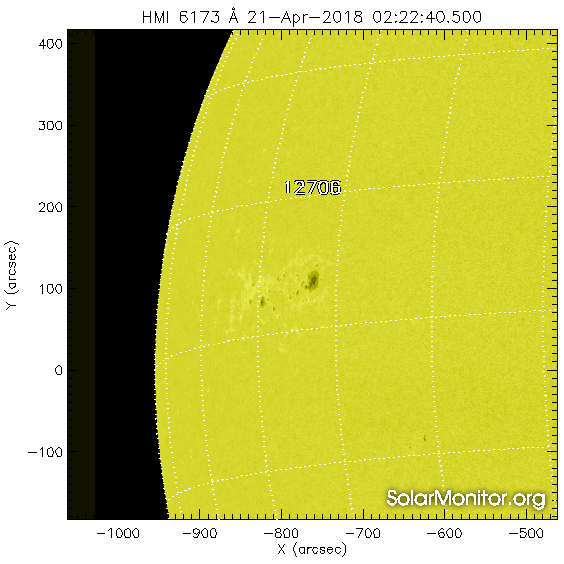
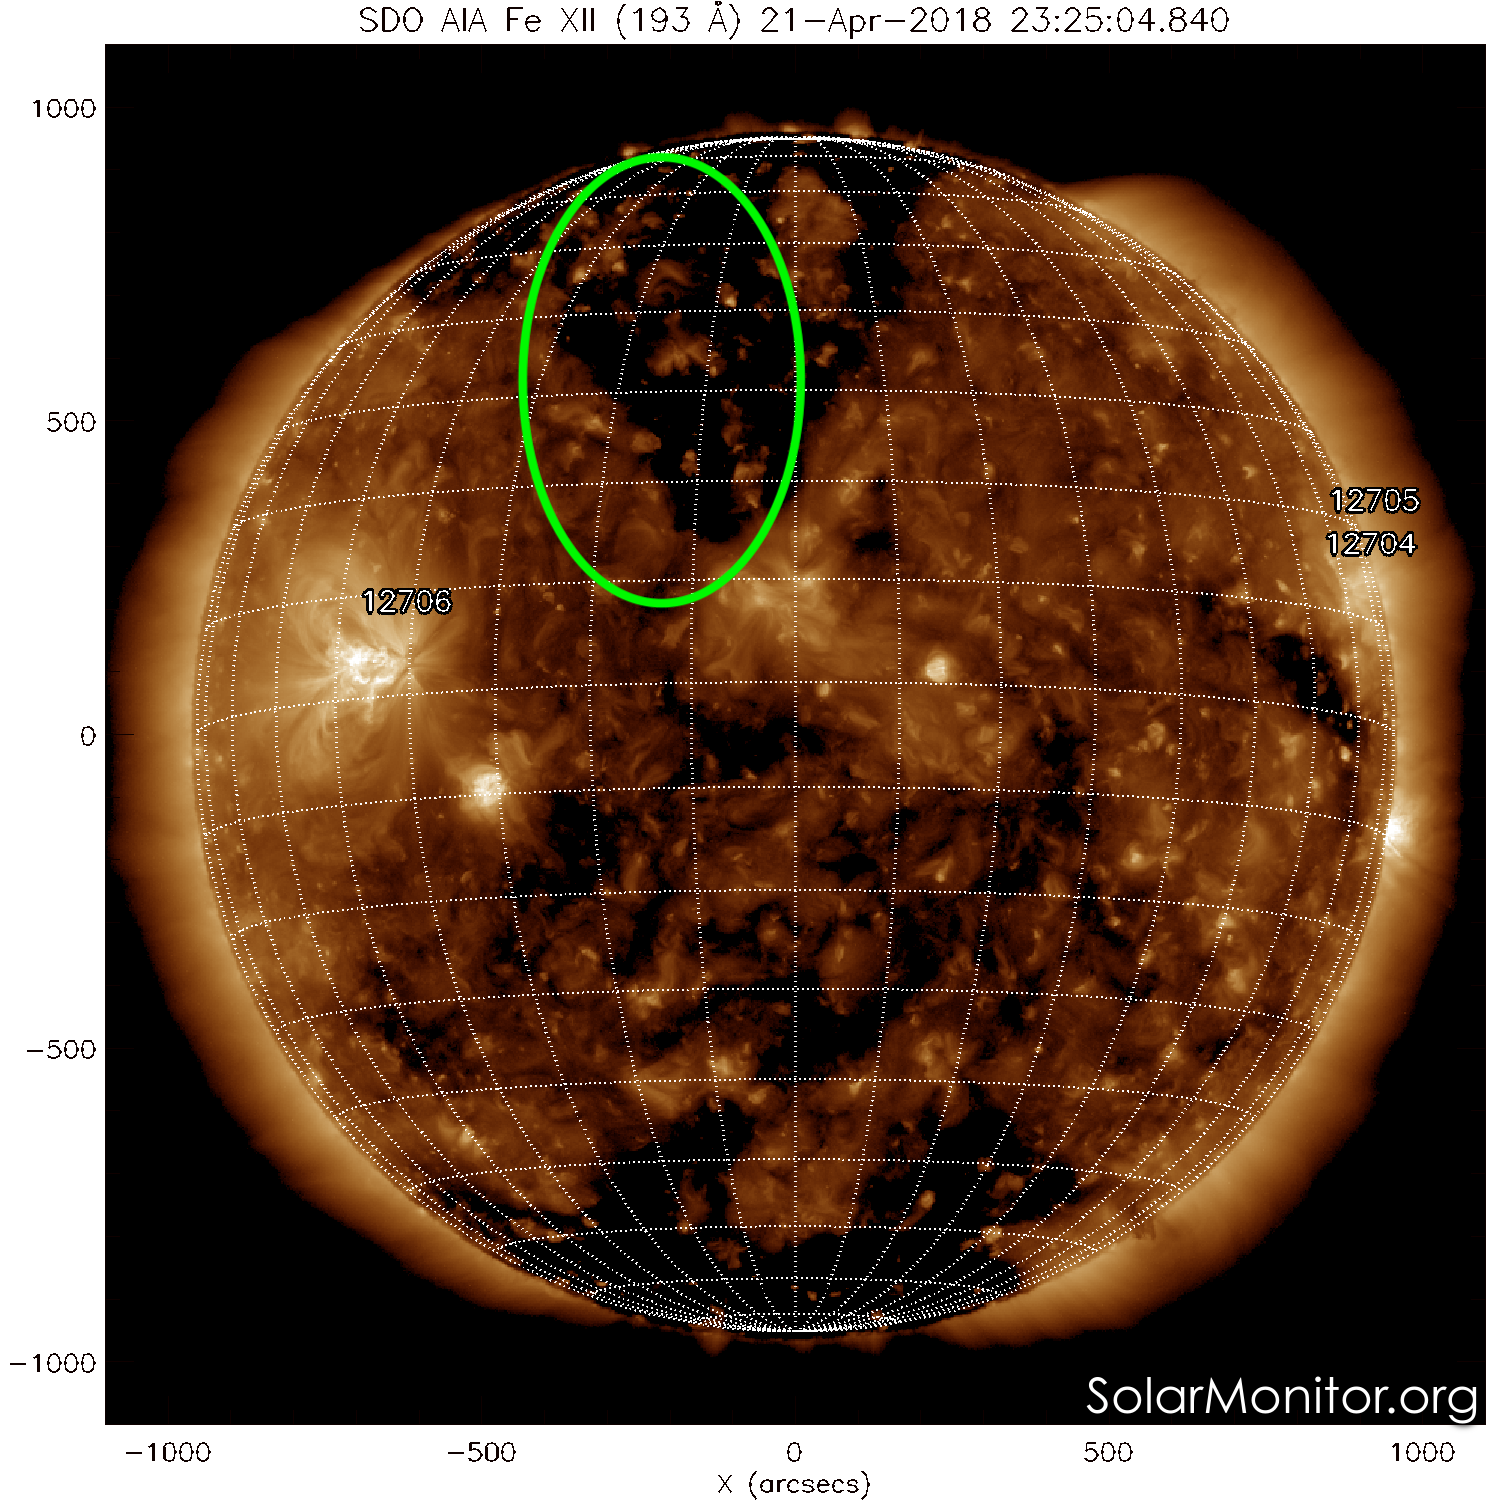
Solar flaring activity was very low with no C-class flares and 12 B-class flares. All reported flares originated from the Catania sunspot group 78 (NOAA AR 2706) which rotated on the visible side of the Sun on April 19.
There was no wide or Earth-directed CMEs observed and the solar protons remained at the background level during the whole week.
The equatorial coronal hole with the large extension in the southern solar hemisphere reached the central meridian at the end of the previous week, April 15.
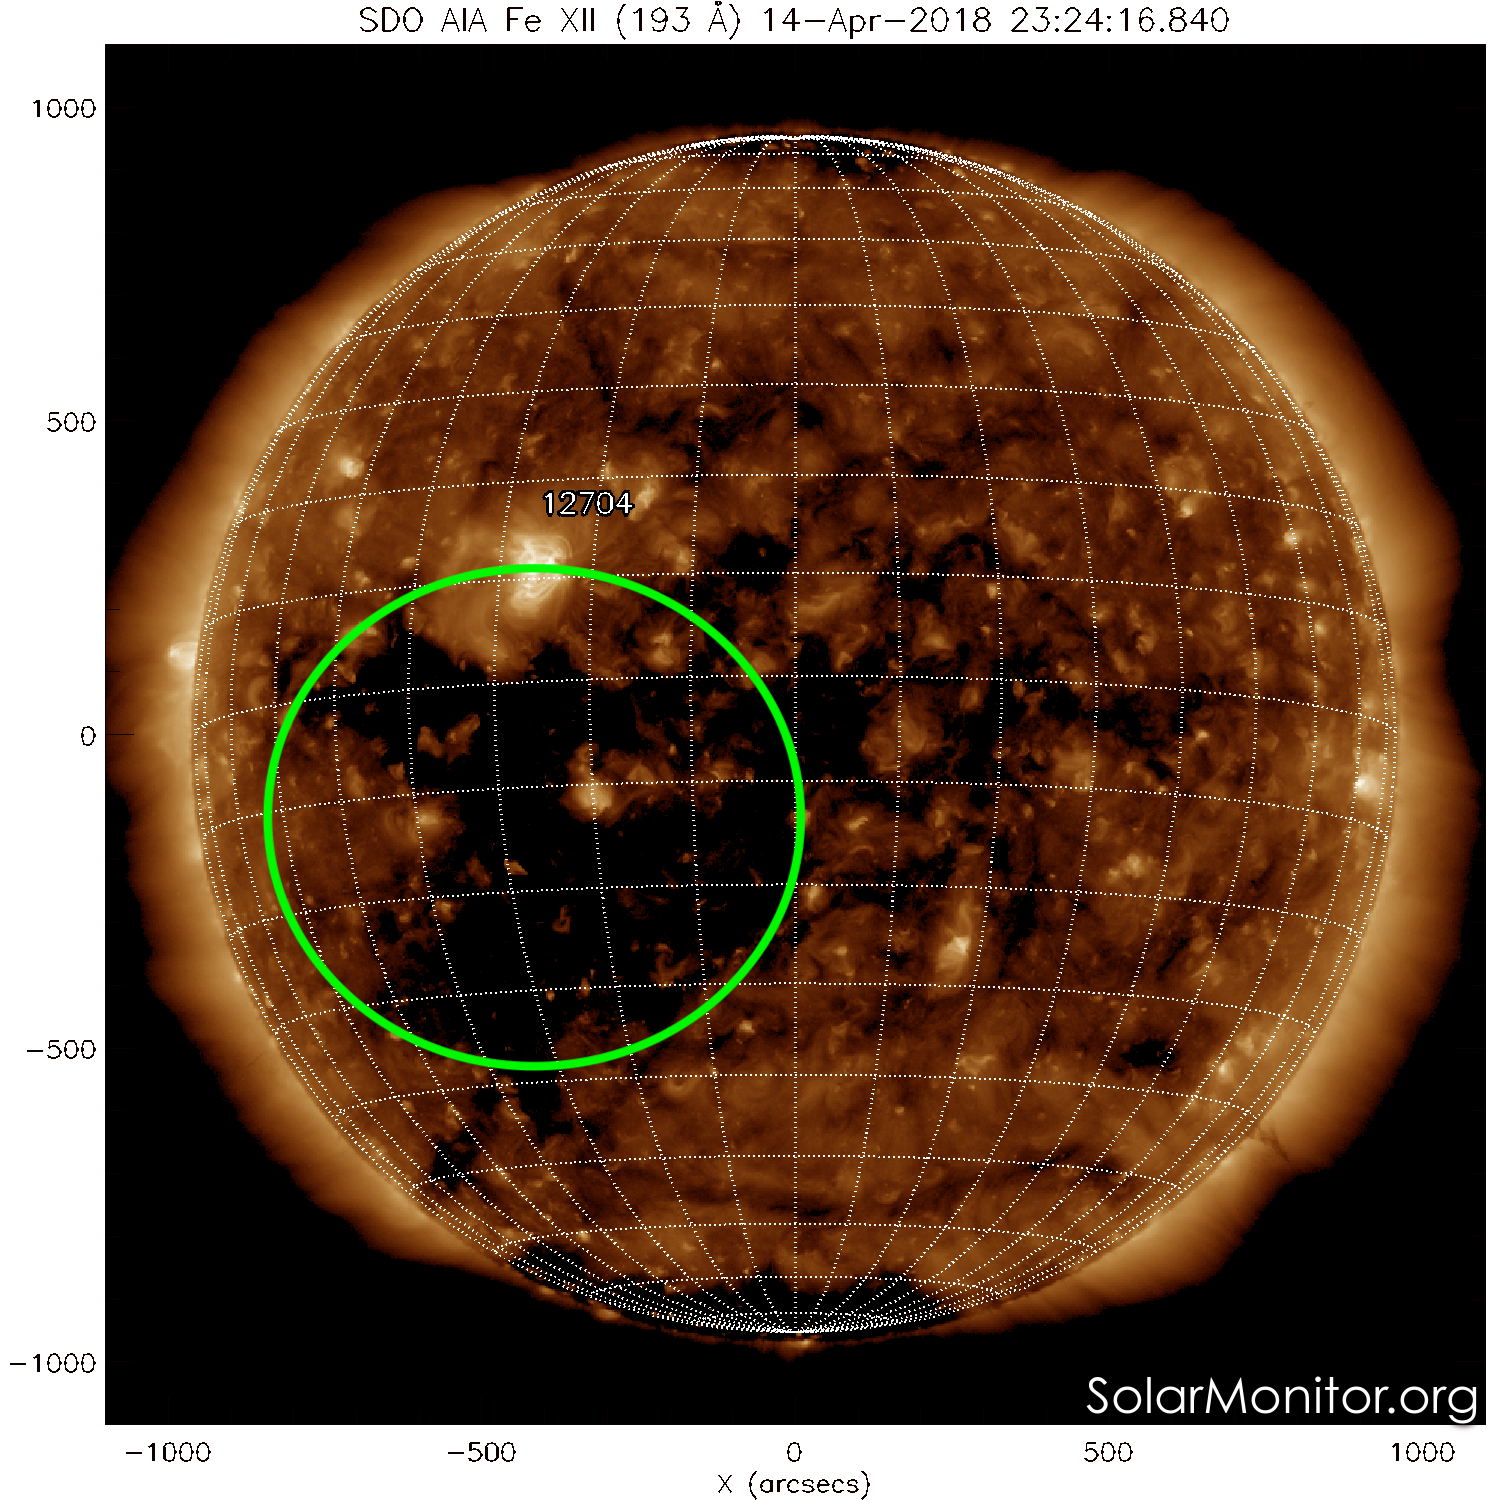
On April 21, patchy low latitude extensions of the northern polar coronal hole reached the central meridian.
The International Sunspot Number
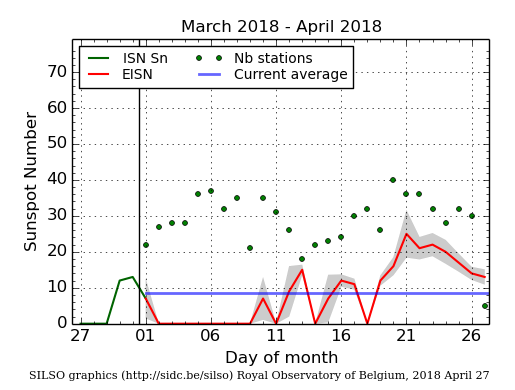
The daily Estimated International Sunspot Number (EISN, red curve with shaded error) derived by a simplified method from real-time data from the worldwide SILSO network. It extends the official Sunspot Number from the full processing of the preceding month (green line). The plot shows the last 30 days (about one solar rotation). The horizontal blue line shows the current monthly average, while the green dots give the number of stations included in the calculation of the EISN for each day.
Review of geomagnetic activity
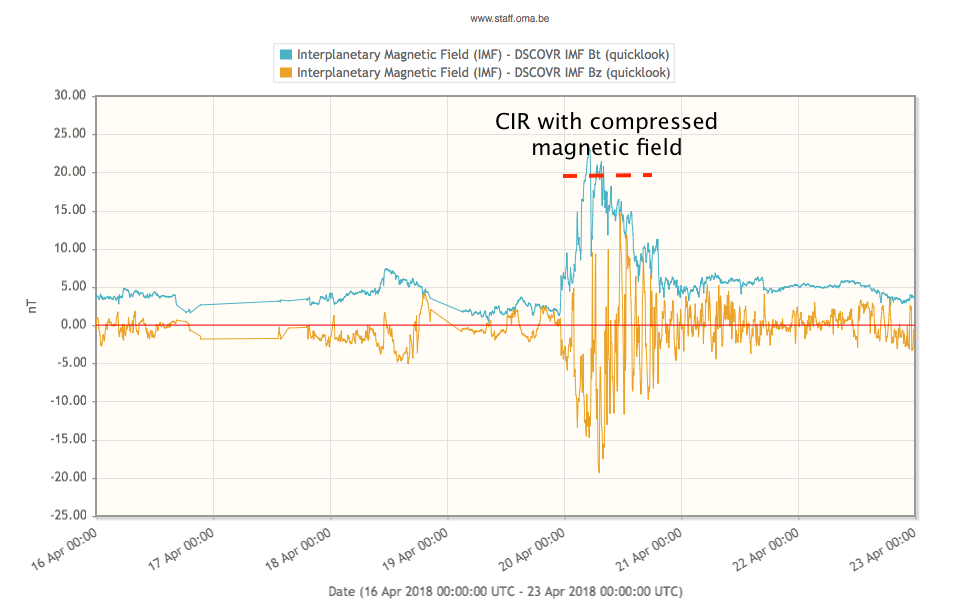
During first half of the week the Earth was inside of the slow solar wind (about 300 km/s), and the interplanetary magnetic field magnitude (IMF) was about 5 nT.
In the evening of April 19, a shock followed by a co-rotating interaction region (CIR) passed the L1 point. DSCVR measured a sudden increase of the IMF, solar wind speed, density and temperature. The CIR was followed by a fast solar wind with a maximum of 620 km/s, in the early morning of April 21.
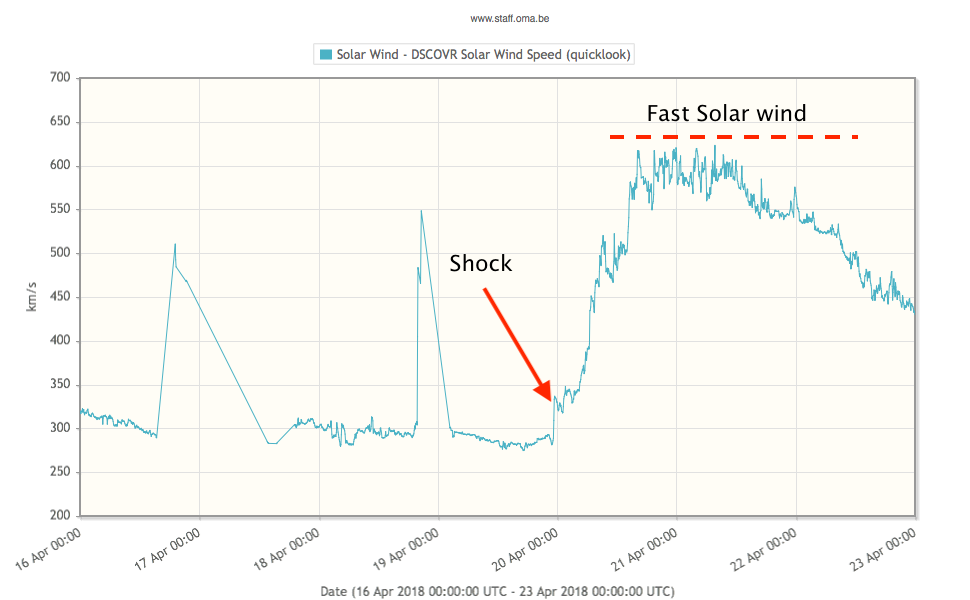
By April 22, the solar wind had already decreased to about 430 km/s.
Geomagnetic conditions were quiet to unsettled. However, intervals with negative z-component of the interplanetary magnetic field, Bz, and the fast solar wind induced disturbed geomagnetic conditions on April 20 (NOAA reported Kp=6 and local station at Dourbes reported K=5).
Geomagnetic Observations at Dourbes (16 Apr 2018 - 22 Apr 2018)

SIDC space weather briefing
The Space Weather Briefing presented by the forecaster on duty from April 16 to 22. It reflects in images and graphs what is written in the Solar and Geomagnetic Activity report.
pdf of the briefing: http://www.stce.be/briefings/SIDCbriefing_20180423.pdf
Review of ionospheric activity (16 Apr 2018 - 22 Apr 2018)

The figure shows the time evolution of the Vertical Total Electron Content (VTEC) (in red) during the last week at three locations:
a) in the northern part of Europe(N61°, 5°E)
b) above Brussels(N50.5°, 4.5°E)
c) in the southern part of Europe(N36°, 5°E)
This figure also shows (in grey) the normal ionospheric behaviour expected based on the median VTEC from the 15 previous days.
The VTEC is expressed in TECu (with TECu=10^16 electrons per square meter) and is directly related to the signal propagation delay due to the ionosphere (in figure: delay on GPS L1 frequency).
The Sun's radiation ionizes the Earth's upper atmosphere, the ionosphere, located from about 60km to 1000km above the Earth's surface.The ionization process in the ionosphere produces ions and free electrons. These electrons perturb the propagation of the GNSS (Global Navigation Satellite System) signals by inducing a so-called ionospheric delay.
See http://stce.be/newsletter/GNSS_final.pdf for some more explanations ; for detailed information, see http://gnss.be/ionosphere_tutorial.php