- Table of Content
- 1.ROB has a fiel...
- 2.ESWW2018 - las...
- 3.PROBA2 Observa...
- 4.SIDC solar phy...
- 5.Review of sola...
- 6.The SIDC space...
- 7.The Internatio...
- 8.Geomagnetic Ob...
- 9.Review of iono...
2. ESWW2018 - last call
3. PROBA2 Observations (7 May 2018 - 13 May 2018)
4. SIDC solar physics seminars
5. Review of solar and geomagnetic activity
6. The SIDC space weather Briefing
7. The International Sunspot Number
8. Geomagnetic Observations at Dourbes (7 May 2018 - 13 May 2018)
9. Review of ionospheric activity (7 May 2018 - 13 May 2018)
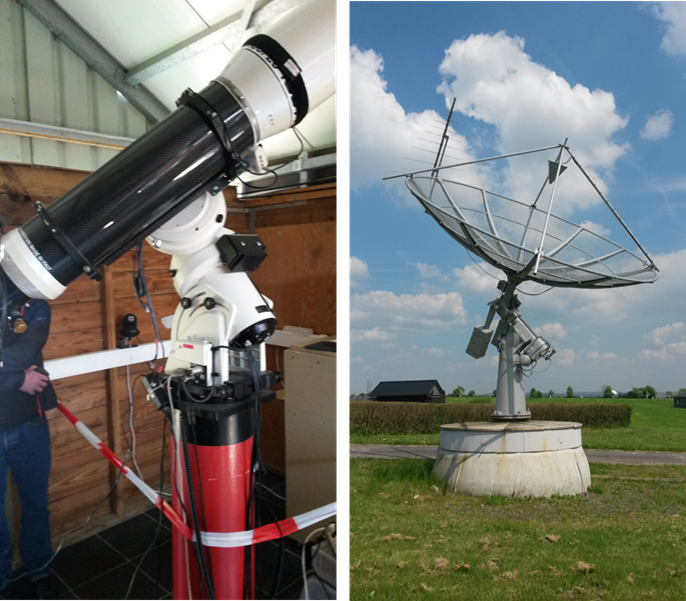
ROB has a field trip!
On 15 and 17 May, the personnel of the Royal Observatory got the opportunity to visit the ROB's research facilities in the caves of Rochefort-Lorette and at the observatory of Humain. People arrived by bus, car, or a combo train/bike. In Rochefort, they first got a brief description of the cave network. Then, the gravimeters were shown, after which the group descended 250+ stairs to enter into the cave. Here, the main fault was shown, as well as some of the instruments that are being used to measure its movement. After having climbed the 250+ stairs back into the open air, the offered lunch and drinks were highly appreciated.
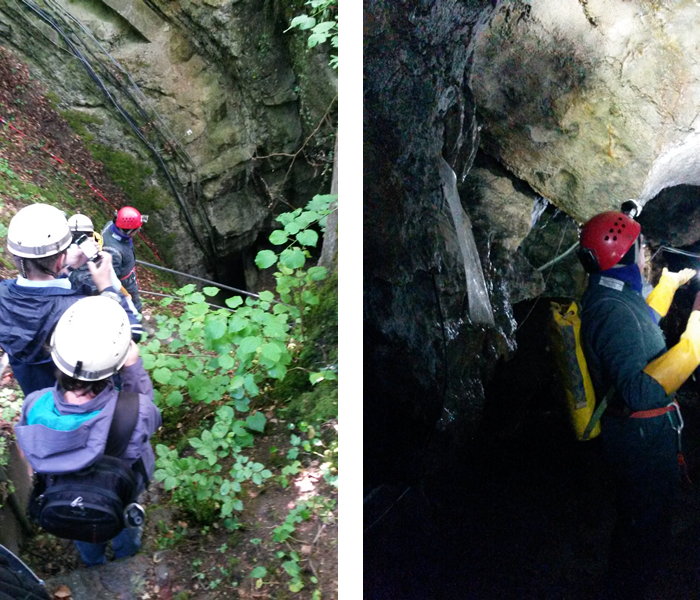
The visit to Humain consisted of two parts. First was a brief presentation on the research on variable starts that is being done there, followed by a visit of the main telescopes. The second part consisted of a visit of the radio-telescopes and an explanation on the solar observations that are being done with these instruments. There was of course some time for the history of the site and to enjoy the landscape, before the participants headed back to the Space Pole plateau in Uccle.
A very big thank you to Michel, Yves, Patricia, Paul, Antonio, Christophe, and everybody else who made this a very enjoyable day!
A gif animation with some additional images can be found at the STCE website (http://www.stce.be/news/425/welcome.html ).
Sergei Shestov made a very nice collage of his 15 May pictures which is available at https://photos.app.goo.gl/aKibAPIRJ84OMeJg1
ESWW2018 - last call
The time is running, tic tac.

abstract for a ESWW2018 session: http://www.stce.be/esww15/program/sessions.php
Or ask for a ESWW2018 topical discussion meeting: http://www.stce.be/esww15/tdm.php
The session conveners and the Programme Committee will do the rest.
PROBA2 Observations (7 May 2018 - 13 May 2018)
Solar Activity
Solar flare activity remained very low during the week.
In order to view the activity of this week in more detail, we suggest to go to the following website from which all the daily (normal and difference) movies can be accessed: http://proba2.oma.be/ssa
This page also lists the recorded flaring events.
A weekly overview movie can be found here (SWAP week 424): http://proba2.oma.be/swap/data/mpg/movies/weekly_movies/weekly_movie_2018_05_07.mp4
Details about some of this week's events, can be found further below.
If any of the linked movies are unavailable they can be found in the P2SC movie repository here: http://proba2.oma.be/swap/data/mpg/movies/
Wednesday May 09
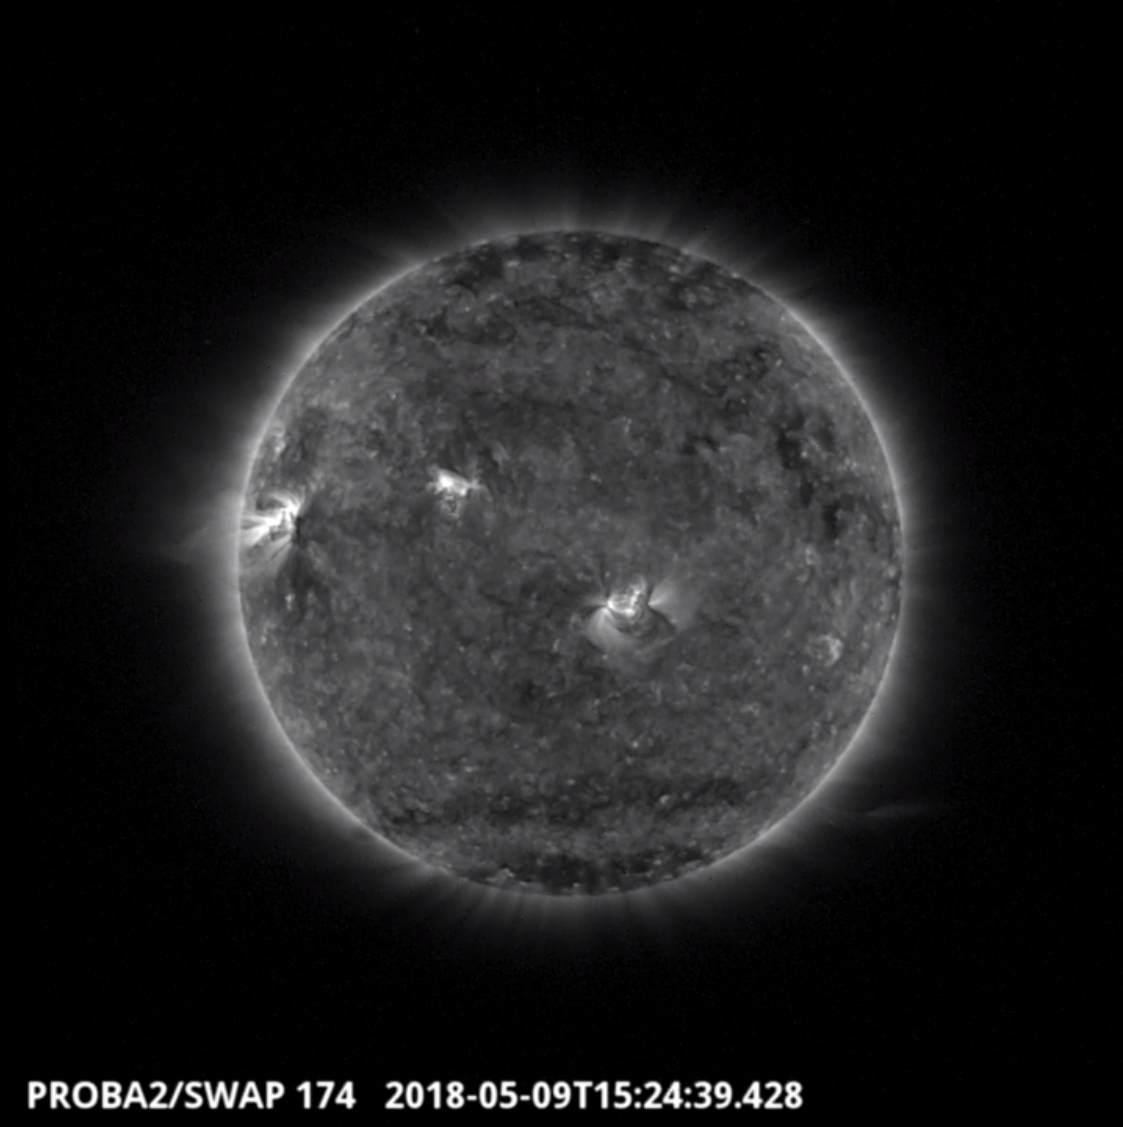
An eruption was observed by SWAP on 2018-May-09. This is visible on south west limb in the SWAP image above at 15:24 UT.
Find a movie of the event here (SWAP movie): http://proba2.oma.be/swap/movies/20180509_swap_movie.mp4
SIDC solar physics seminars

The Sun is a stove. You would expect that the 'air' becomes cooler when you go further away from the stove. Well, in the coronal space it isn't.
Matt West about the coronal heating problem: https://events.oma.be/indico/event/45/
And what about wind in space? Is it always windy in space? What sort of air is blowing out there?
Luciano Rodriguez tells us about it: https://events.oma.be/indico/event/46/
Review of solar and geomagnetic activity
Solar activity
Solar activity was at very low levels. Two small sunspot regions, NOAA 2708 and NOAA 2709, were visible on the solar disk, but gradually decayed.
No earth-directed coronal mass ejections (CMEs) were observed. CACTus detected two narrow CMEs from the southwest limb on 9 and 11 May.
An elongated equatorial negative polarity coronal (CH) hole had rotated over the west limb by 11 May, while a small and somewhat diffuse equatorial CH reached the Central Meridian by the end of the period.
The greater than 10 MeV proton flux was at nominal levels.
Geomagnetic activity
Earth was under the influence of the high speed stream (HSS) from an elongated negative polarity equatorial coronal hole (CH). Solar wind speed showed a generally declining trend from 710 to 420 km/s, ending the period with values near 450 km/s. Bz was mostly oscillating between -8 and +7 nT, the amplitude of the oscillations becoming smaller from 11 May onwards (between mostly -6 and +4 nT). The interplanetary magnetic field was mostly directed towards the Sun.
Quiet to active geomagnetic conditions were observed until early 12 May, when geomagnetic activity started varying in a quiet to unsettled band.
The SIDC space weather Briefing
The Space Weather Briefing presented by the forecaster on duty from May 7 to 13. It reflects in images and graphs what is written in the Solar and Geomagnetic Activity report.
Movie 'Solar active region evolution': http://www.stce.be/briefings/1_20180514_WL_Magn.mp4
Movie of the prominence eruption on May 9 2018: http://www.stce.be/briefings/2_20180514_CME_09May_SDO%20P2%20SOHO.mp4
Movie of the CME with CACTus difference images: http://www.stce.be/briefings/3_20180514_CME.mp4
Coronal hole movie: http://www.stce.be/briefings/4_20180514_13174101_512_aia_0193.mp4
The briefing in pdf-format: http://www.stce.be/briefings/SIDCbriefing-20180514.pdf
The International Sunspot Number
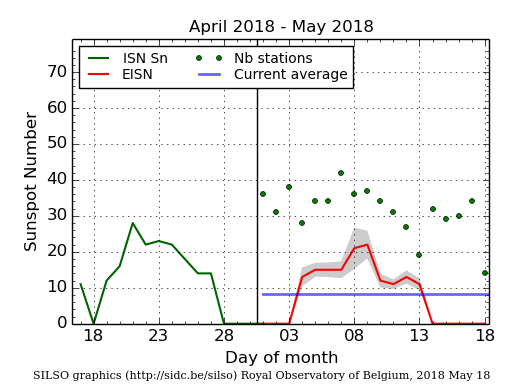
The daily Estimated International Sunspot Number (EISN, red curve with shaded error) derived by a simplified method from real-time data from the worldwide SILSO network. It extends the official Sunspot Number from the full processing of the preceding month (green line). The plot shows the last 30 days (about one solar rotation). The horizontal blue line shows the current monthly average, while the green dots give the number of stations included in the calculation of the EISN for each day.
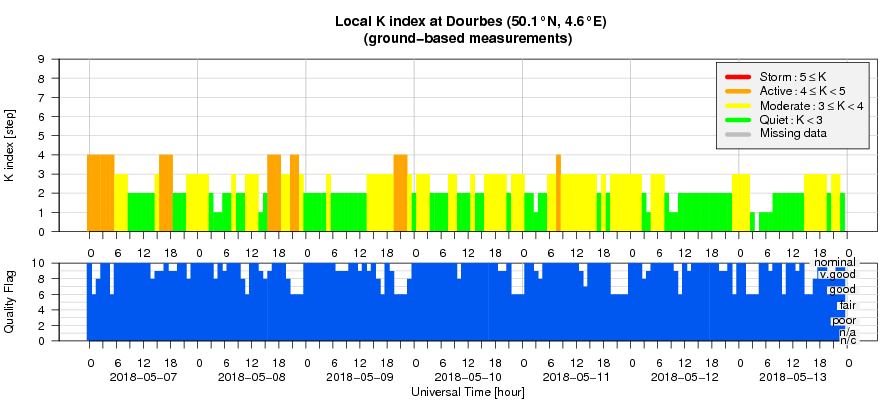
Geomagnetic Observations at Dourbes (7 May 2018 - 13 May 2018)
Review of ionospheric activity (7 May 2018 - 13 May 2018)
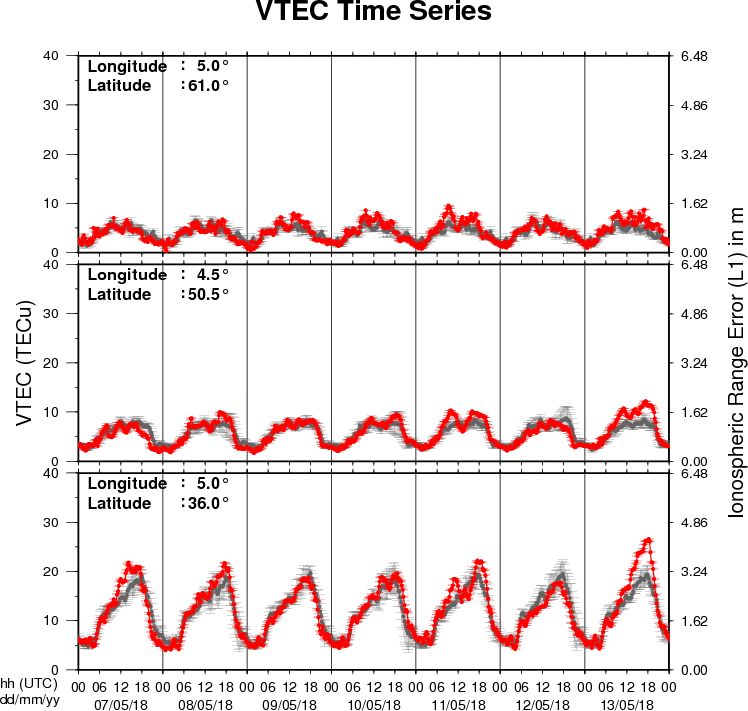
The figure shows the time evolution of the Vertical Total Electron Content (VTEC) (in red) during the last week at three locations:
a) in the northern part of Europe(N61°, 5°E)
b) above Brussels(N50.5°, 4.5°E)
c) in the southern part of Europe(N36°, 5°E)
This figure also shows (in grey) the normal ionospheric behaviour expected based on the median VTEC from the 15 previous days.
The VTEC is expressed in TECu (with TECu=10^16 electrons per square meter) and is directly related to the signal propagation delay due to the ionosphere (in figure: delay on GPS L1 frequency).
The Sun's radiation ionizes the Earth's upper atmosphere, the ionosphere, located from about 60km to 1000km above the Earth's surface.The ionization process in the ionosphere produces ions and free electrons. These electrons perturb the propagation of the GNSS (Global Navigation Satellite System) signals by inducing a so-called ionospheric delay.
See http://stce.be/newsletter/GNSS_final.pdf for some more explanations ; for detailed information, see http://gnss.be/ionosphere_tutorial.php