- Table of Content
- 1.The STCE annua...
- 2.Basic Solar Ph...
- 3.Mysterious los...
- 4.Space radiatio...
- 5.PROBA2 Observa...
- 6.Review of sola...
- 7.The Internatio...
- 8.Geomagnetic Ob...
- 9.Review of iono...
2. Basic Solar Physics seminars - Solar Irradiance and upper planetary atmospheres
3. Mysterious loss and increase in GPS signal
4. Space radiation effects workshop - June 1
5. PROBA2 Observations (14 May 2018 - 20 May 2018)
6. Review of solar and geomagnetic activity
7. The International Sunspot Number
8. Geomagnetic Observations at Dourbes (14 May 2018 - 20 May 2018)
9. Review of ionospheric activity (14 May 2018 - 20 May 2018)
The STCE annual meeting
Another year has passed. Time for the STCE annual meeting.

For the 2018 edition, we want to check which assets and expertise we can bring together. It can create an added value and serve our colleagues and other groups at the plateau.
PECASUS, the UV-group and Cosmic Rays research group are collaborations that exceed the boundaries of one institute. These 3 collaborative projects will present their successes and the problems they came across.
With these examples in mind, we will try to figure out how we can work more closely together with the 3 institutes within the frame of the STCE. We try to answer two question:
1 - How can the expertise of my group serve other colleagues and groups at the plateau or the STCE?
2 - And reversed, what can the STCE do to serve my colleagues and me?
Registration is easy, free of charge and includes a lunch: https://events.oma.be/indico/event/55/
Basic Solar Physics seminars - Solar Irradiance and upper planetary atmospheres
We've put the lecture by Gael Cessateur on Solar Irradiance and upper planetary atmosphere on video. You don't have read anymore, only click: https://events.oma.be/indico/event/47/

Mysterious loss and increase in GPS signal
The GNSS people at the STCE are involved in a European network that monitors satellite signals. GNSS receivers all over Europe collect signals send by satellites. The ratio of the satellite signal and the noise says something about the quality of the signal. This quantity is calculated in 2 wavebands, L1 and L2.
On April 13 2018, around noon, the GPS signal dropped in the L1 band and increased in the L2 band. So, the GPS navigation capabilities were suddenly much better in the L2 band. On April 17, around 15:30 UTC, the GPS satellites were again broadcasting with a 'normal' signal strength in the L2 band.
Might there be a connection with things that happened in the world? Up to you to check.
More on http://gnss.be/Atmospheric_Maps/signal_event.php?date=2018-04-13
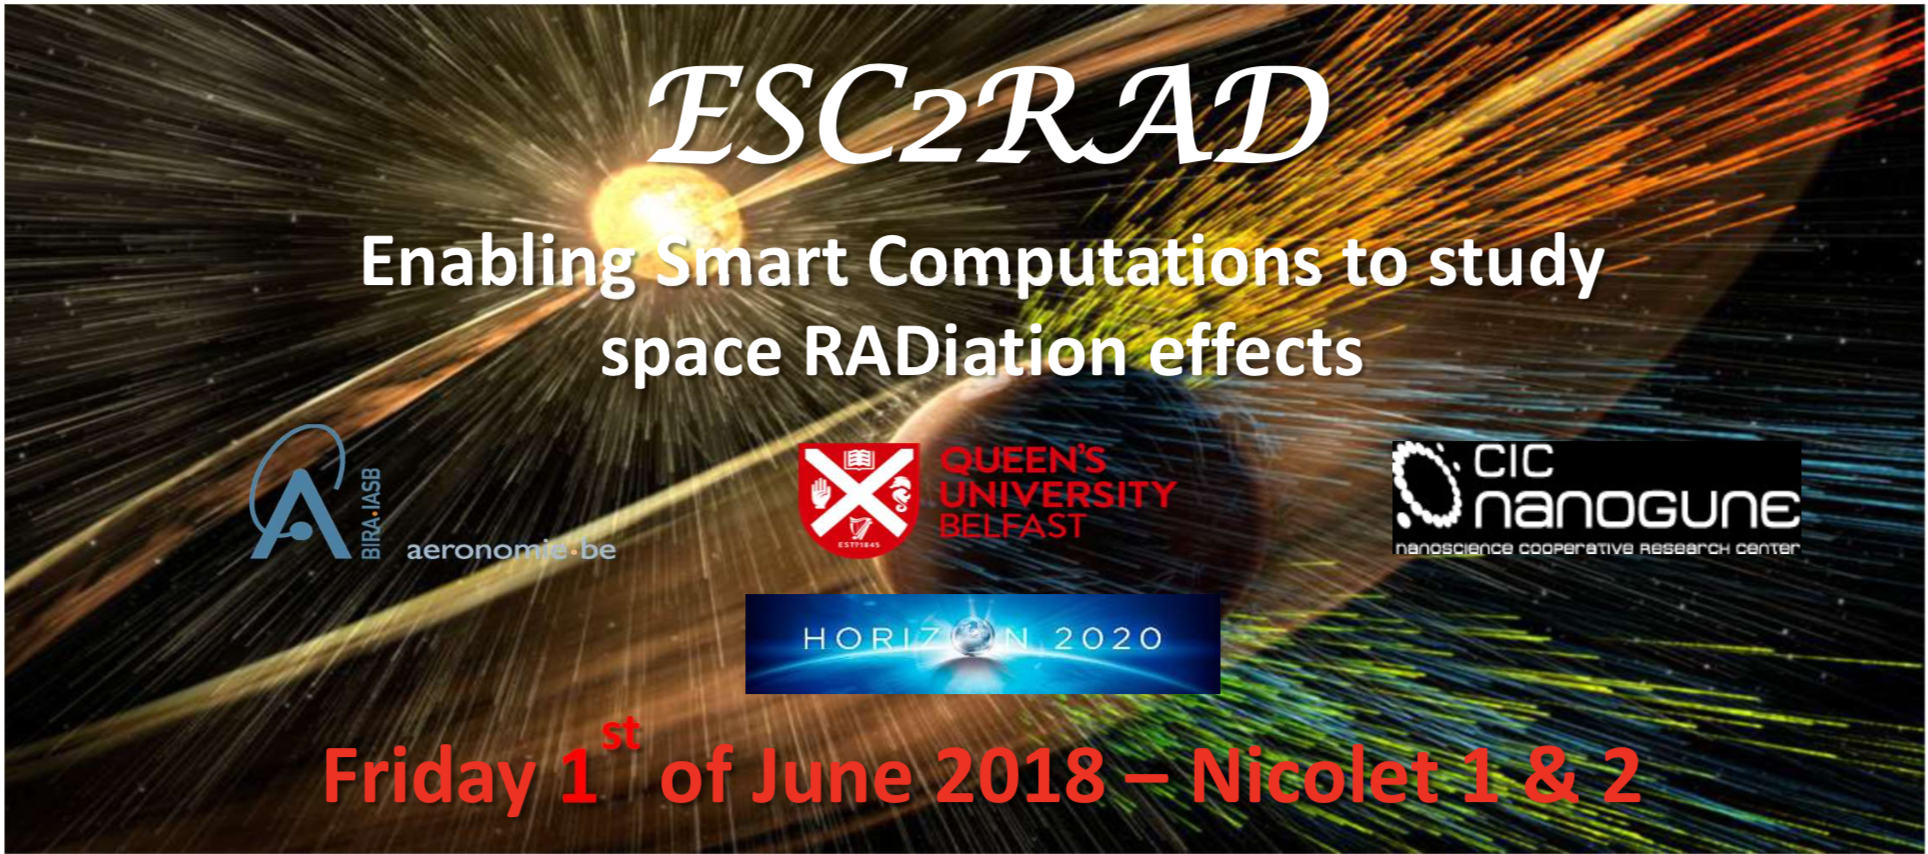
Space radiation effects workshop - June 1
Dear colleagues,
A one-day workshop on Space radiation effects in biological matter (DNA) and functional materials on spacecrafts (solar cells, dosimeters), will take place on Friday 1st of June at BIRA-IASB. The workshop is organized within the context of the H2020 ESC2RAD project (Enabling Smart Computations to study space RADiation effects).
The agenda is in attachment. Seminars will be given on space missions, space radiation effects, quantum chemistry and Monte Carlo modeling of the induced effects in biological matter and materials.
The mini-workshop is open to everybody and is meant to get in touch with the people in Belgium who work in the field of radiation effects and top-leader experts in Europe.
The program in pdf-format: http://www.stce.be/images/Meeting_ESC2RAD_Agenda.pdf
Welcome !
Fabiana Dapieve
PROBA2 Observations (14 May 2018 - 20 May 2018)
Solar Activity
Solar flare activity fluctuated was very low during the week.
In order to view the activity of this week in more detail, we suggest to go to the following website from which all the daily (normal and difference) movies can be accessed: http://proba2.oma.be/ssa
This page also lists the recorded flaring events.
A weekly overview movie can be found here (SWAP week 425).
http://proba2.oma.be/swap/data/mpg/movies/weekly_movies/weekly_movie_2018_05_14.mp4
Details about some of this week’s events, can be found further below.
If any of the linked movies are unavailable they can be found in the P2SC movie repository here
http://proba2.oma.be/swap/data/mpg/movies/
Monday May 14
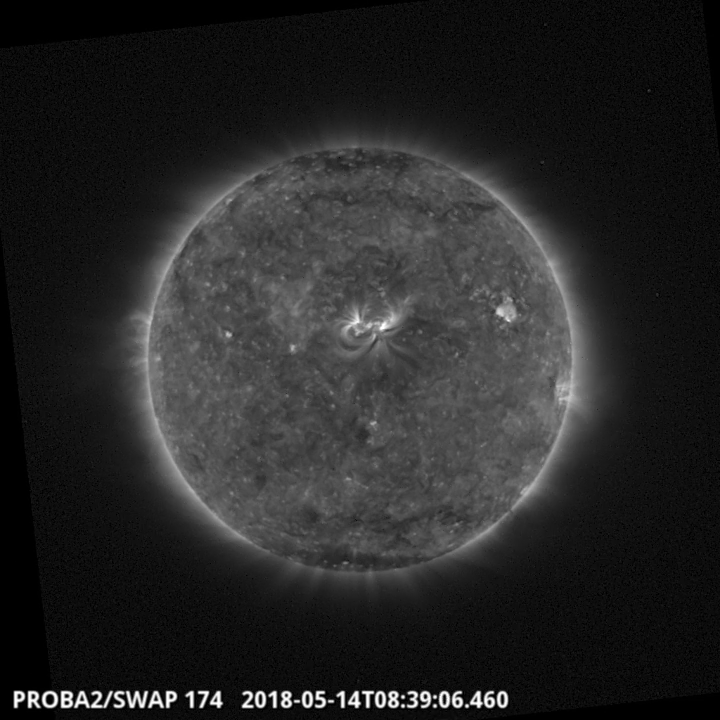
The Sun has been quiet in the past week, with one significant active region on the solar disk (NOAA AR 2709). The region can be seen in the SWAP image above (North-Central part of the Sun), this region didn’t flare during the week.
Find a movie of the events here (SWAP movie)
http://proba2.oma.be/swap/data/mpg/movies/20180514_swap_movie.mp4
Review of solar and geomagnetic activity
SOLAR ACTIVITY
Solar activity was quiet throughout the week, no C-class flares were recorded.
One active region was present at the beginning of the week (NOAA AR 2709, only on 14 May).
A coronal hole in the southern hemisphere (negative polarity) crossed the central meridian on 13 May.
GEOMAGNETIC ACTIVITY
The high speed stream from the above mentioned coronal hole was very weak with speeds no greater than 450 km/s.
Geomagnetic conditions were quiet to unsettled during the week.
The International Sunspot Number
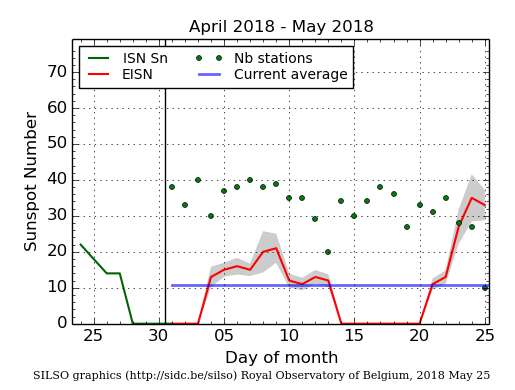
The daily Estimated International Sunspot Number (EISN, red curve with shaded error) derived by a simplified method from real-time data from the worldwide SILSO network. It extends the official Sunspot Number from the full processing of the preceding month (green line). The plot shows the last 30 days (about one solar rotation). The horizontal blue line shows the current monthly average, while the green dots give the number of stations included in the calculation of the EISN for each day.
To put this graph into perspective, we included a graph with different flavours of the International Sunspot Number. The graph runs over the last 13 years. The last Monthly ISN is the blue point for April 2018. The above EISN graph follows the yellow curve.
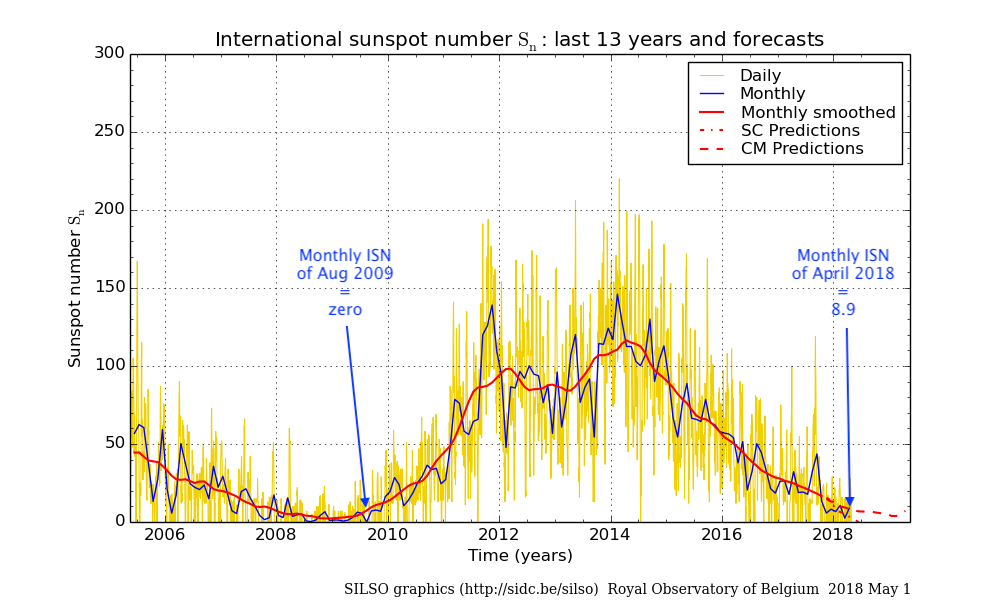
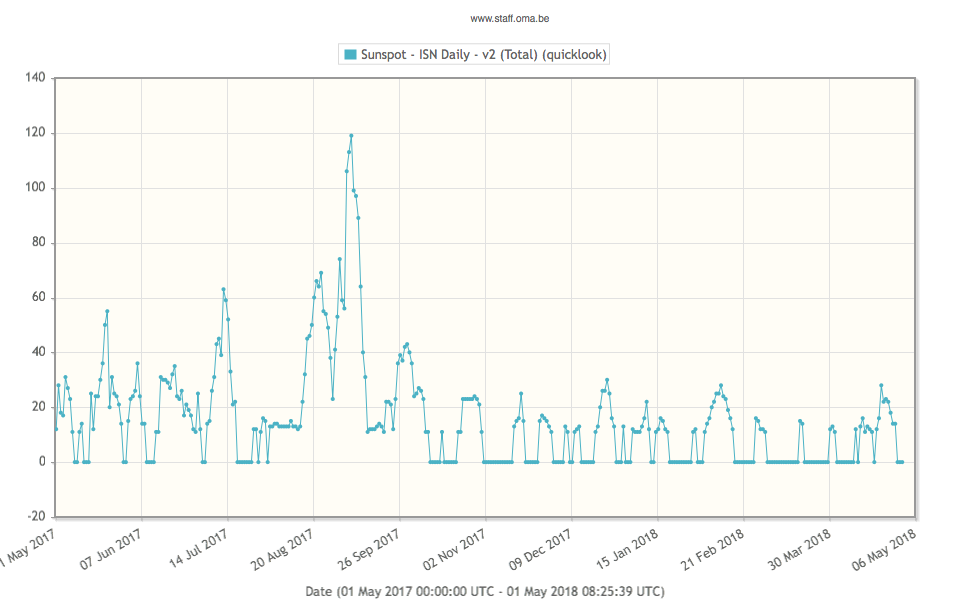
To graph below gives an idea of the daily ISN starting on May 1 2017 and ending on April 30 2018.
Geomagnetic Observations at Dourbes (14 May 2018 - 20 May 2018)

Review of ionospheric activity (14 May 2018 - 20 May 2018)

The figure shows the time evolution of the Vertical Total Electron Content (VTEC) (in red) during the last week at three locations:
a) in the northern part of Europe(N61°, 5°E)
b) above Brussels(N50.5°, 4.5°E)
c) in the southern part of Europe(N36°, 5°E)
This figure also shows (in grey) the normal ionospheric behaviour expected based on the median VTEC from the 15 previous days.
The VTEC is expressed in TECu (with TECu=10^16 electrons per square meter) and is directly related to the signal propagation delay due to the ionosphere (in figure: delay on GPS L1 frequency).
The Sun's radiation ionizes the Earth's upper atmosphere, the ionosphere, located from about 60km to 1000km above the Earth's surface.The ionization process in the ionosphere produces ions and free electrons. These electrons perturb the propagation of the GNSS (Global Navigation Satellite System) signals by inducing a so-called ionospheric delay.
See http://stce.be/newsletter/GNSS_final.pdf for some more explanations ; for detailed information, see http://gnss.be/ionosphere_tutorial.php