- Table of Content
- 1.A sunspot regi...
- 2.Predicting the...
- 3.CESRA 2018 Sum...
- 4.PROBA2 Observa...
- 5.Review of sola...
- 6.The SIDC space...
- 7.The Internatio...
- 8.Geomagnetic Ob...
- 9.Review of iono...
2. Predicting the geomagnetic response with a chain
3. CESRA 2018 Summer School
4. PROBA2 Observations (21 May 2018 - 27 May 2018)
5. Review of solar and geomagnetic activity
6. The SIDC space weather Briefing
7. The International Sunspot Number
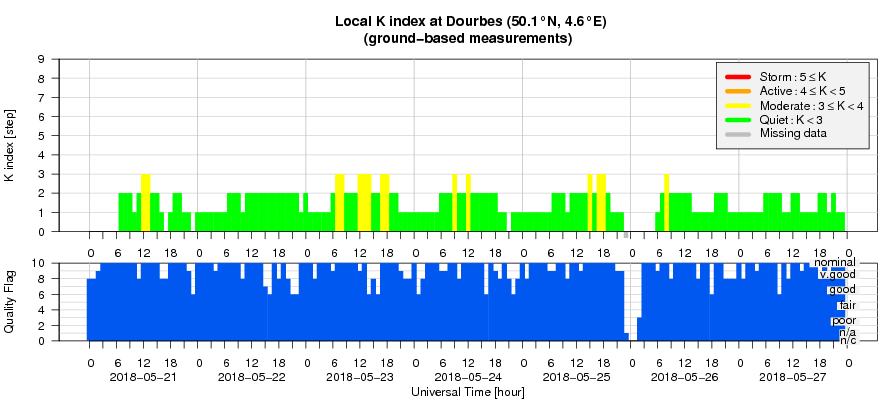
8. Geomagnetic Observations at Dourbes (21 May 2018 - 27 May 2018)
9. Review of ionospheric activity (21 May 2018 - 27 May 2018)
A sunspot region with ambition
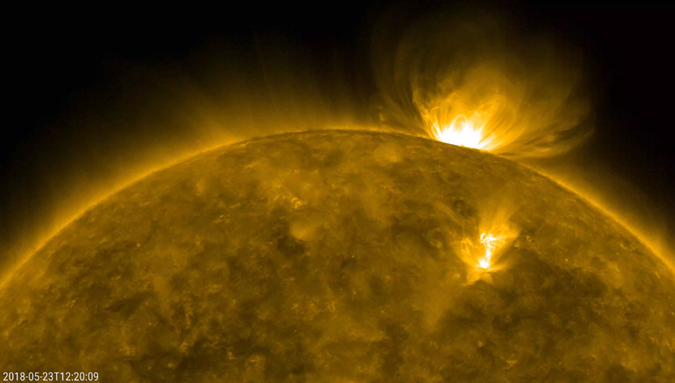
Last week, active region NOAA 2712 rounded the east limb. It announced its presence well in advance, as dynamic coronal loops were towering above the east limb more than 2 days before the sunspot group actually became visible. The extreme ultraviolet (EUV) image from SDO/AIA underneath shows the coronal structures above NOAA 2172 on 23 May at 12:20UT. The image has been rotated over 90 degrees, with east on top. A movie covering the period from 21-25 May can be found at http://www.stce.be/news/426/welcome.html
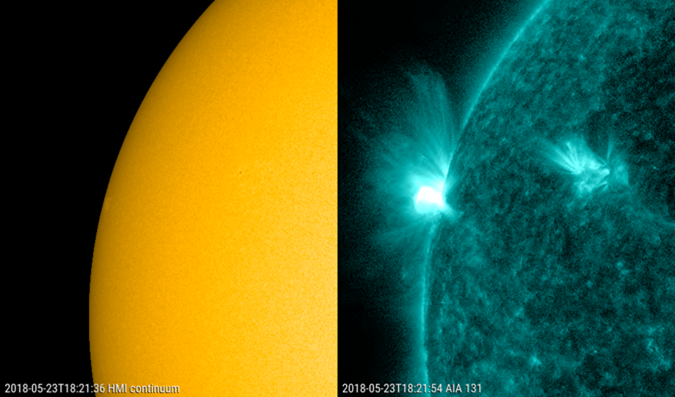
The region produced several B-class flares, as well as one C2 flare, which peaked on 23 May at 18:21UT. The SDO white light image underneath shows the region at that moment, with only the bright facula field from its leading portion visible. On the right is the SDO/AIA 131 image in EUV showing the flare in progress at the same time. A movie covering the timeframe 17:30-18:30UT can be found at http://www.stce.be/news/426/welcome.html
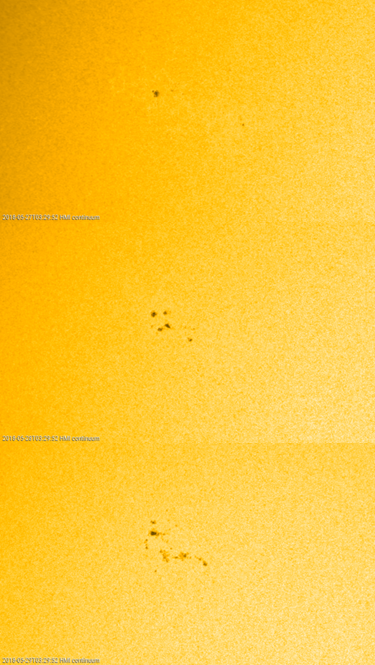
As the region had rotated over the east limb, it became clear that this was all in all a simple and decaying sunspot group. However, the region did not want to end its career so soon, and it renewed the magnetic flux emergence during the afternoon of 27 May, resulting in an increase of the number of sunspots. As there was also some mixed polarity involved in its trailing portion, NOAA 2172 produced even a C2.7 flare on 28 May at 17:10UT. The evolution of the sunspot group in white light from 27 till 29 May can be seen in the SDO/HMI images underneath (movie clip at http://www.stce.be/news/426/welcome.html ). It is followed by a zoomed out animation, showing that the region was still not very big in size.
Predicting the geomagnetic response with a chain
The Sun, it is a busy star. It expels at all times magnetised and electrically charged mass which we describe as the solar wind. It happens, often during some years, less often during other years, that a solar cloud is thrown out on top of the solar wind, like a tsunami hurling over the see. These are called coronal mass ejections or CME. A CME leaves the Sun, passes through space and might bump on Earth. CME’s are the most violent solar storms. Of course, we are interested in how the Earth environment responds on a crashing CME, geomagnetically speaking.

The picture above was stolen from https://blogs.helsinki.fi/spacephysics/msc-thesis-topics/
Camilla Scolini has an idea how to do this and it should be better compared to the existing methods. She presented them at the Triennial Earth-Sun Summit meeting this month in Virginia (https://agu.confex.com/agu/2018tess/meetingapp.cgi/Home/0).
First she looks at the Sun at the time of the eruption and derives the kinematic and magnetic characters of the erupting plasma. These observational parameters are put into a computer model with the well-sounding name EUHFORIA. EUHFORIA takes the plasma cloud on a virtual flight on the solar wind through the heliosphere and delivers it near the Earth’s magnetic shield. Camilla takes the cloud after its trip through space and brings it to the next part of the chain. She 'smashes' it, again so to speak, on the magnetosphere - simulated with the OpenGGCM model - and sees how it responds to it by calculating a few geomagnetic activity indices (Dat, AE, magnetospheric compression).
The more scientific oriented people among us, can have look at these pictures:
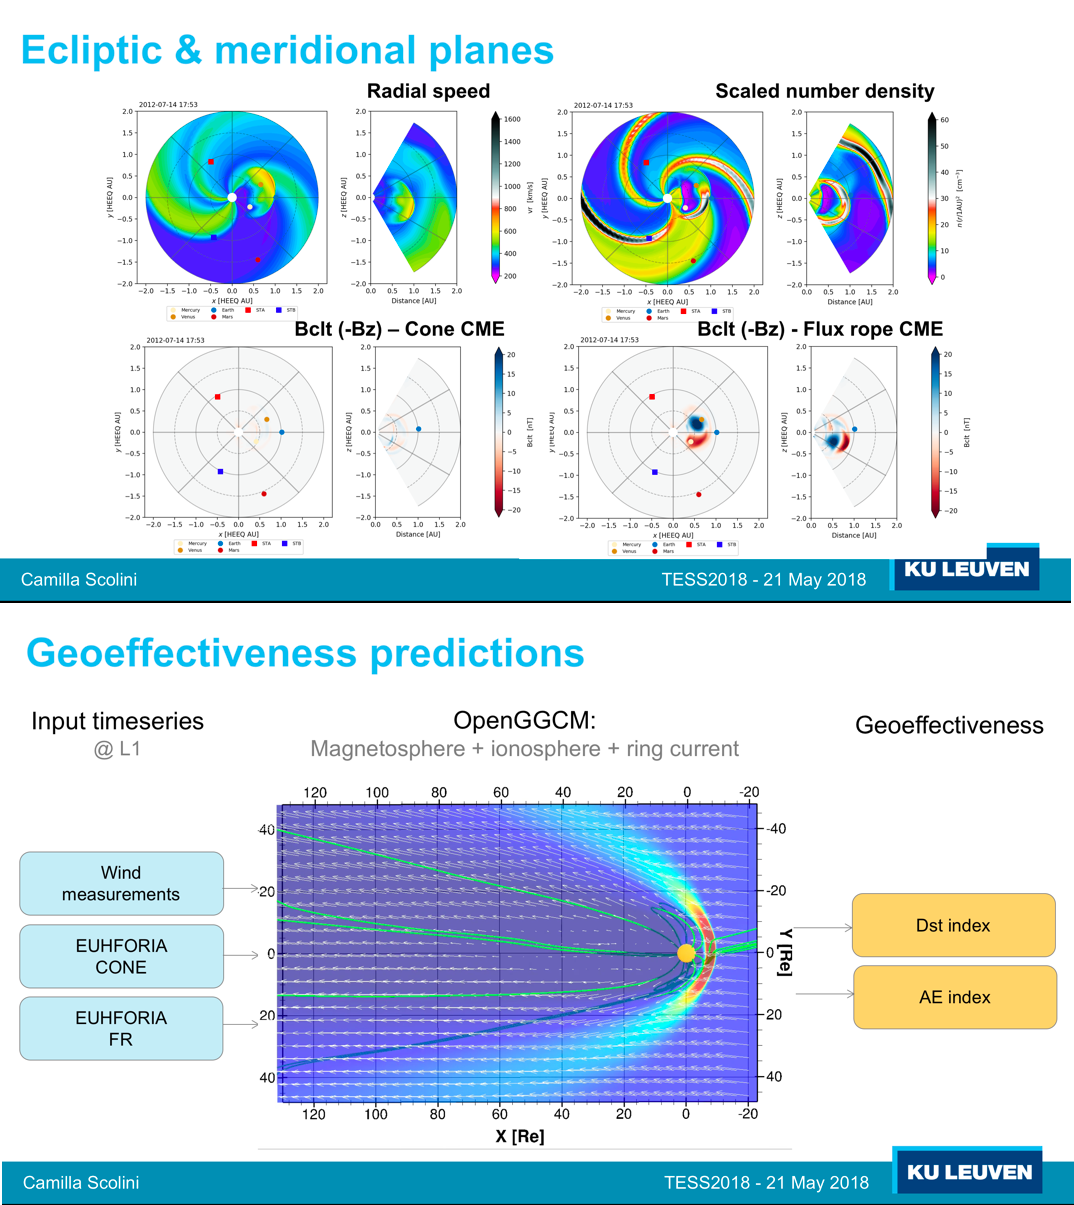
Where lies the novelty: Camilla uses observations to determine the CME internal magnetic field at the beginning of the chain , while others just throw some magnetic parameters of the solar eruption of which they think they are OK.
Her way or working allows for improved predictions.
Camilla is a PhD student at the KU Leuven and spends a lot of her time with us, the STCE.
CESRA 2018 Summer School
CESRA is organising a summer school for students with a master degree in physics or engineering who wish to get introduced to the science and technics of solar radio physics.

Check it at https://events.oma.be/indico/event/53/
PROBA2 Observations (21 May 2018 - 27 May 2018)
Solar Activity
Solar flare activity fluctuated between very low and low during the week.
In order to view the activity of this week in more detail, we suggest to go to the following website from which all the daily (normal and difference) movies can be accessed: http://proba2.oma.be/ssa
This page also lists the recorded flaring events.
A weekly overview movie can be found here (SWAP week 426).
http://proba2.oma.be/swap/data/mpg/movies/weekly_movies/weekly_movie_2018_05_21.mp4
Details about some of this week’s events, can be found further below.
If any of the linked movies are unavailable they can be found in the P2SC movie repository here
http://proba2.oma.be/swap/data/mpg/movies/
Wednesday May 23
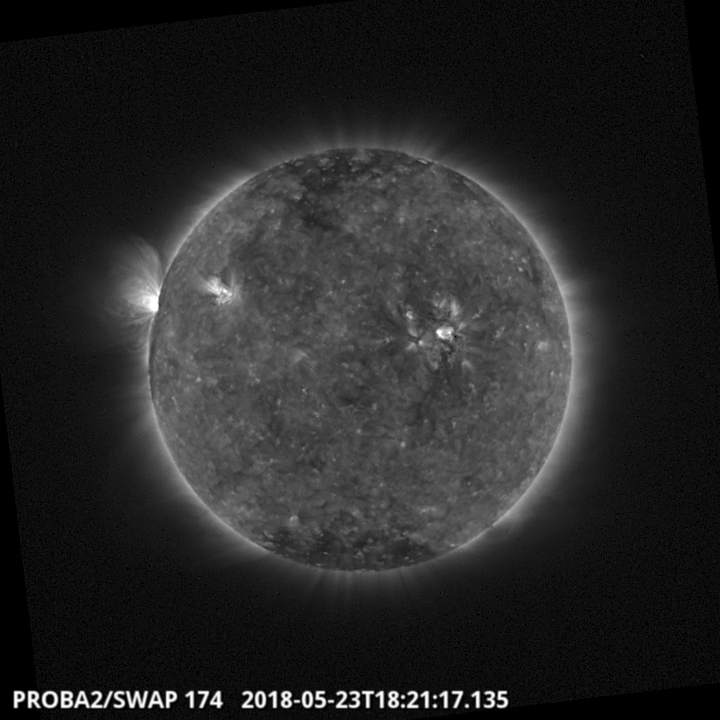
The largest flare of the week was a C2.0, the flare is visible on the East limb in the SWAP image above at 18:21 UT.
Find a movie of the event here (SWAP movie)
http://proba2.oma.be/swap/data/mpg/movies/20180523_swap_movie.mp4
Review of solar and geomagnetic activity
SOLAR ACTIVITY
Solar activity was quiet throughout the week, only one C-class flare was recorded on May 23 (C2.0 flare peaking at 18:21 UT). Three active regions were present on the solar disk: NOAA AR 2712 that produced multiple B-class flares and two decaying regions NOAA AR 2710 and 2711. A positive polar coronal hole was in geoeffective location the first half of the week.
GEOMAGNETIC ACTIVITY
The solar wind emanating from the above mentioned coronal hole was rather slow with speeds no greater than 520 km/s.
Geomagnetic conditions were quiet to unsettled during the week.
The SIDC space weather Briefing
The Space Weather Briefing presented by the forecaster on duty from May 21 to 27. It reflects in images and graphs what is written in the Solar and Geomagnetic Activity report.
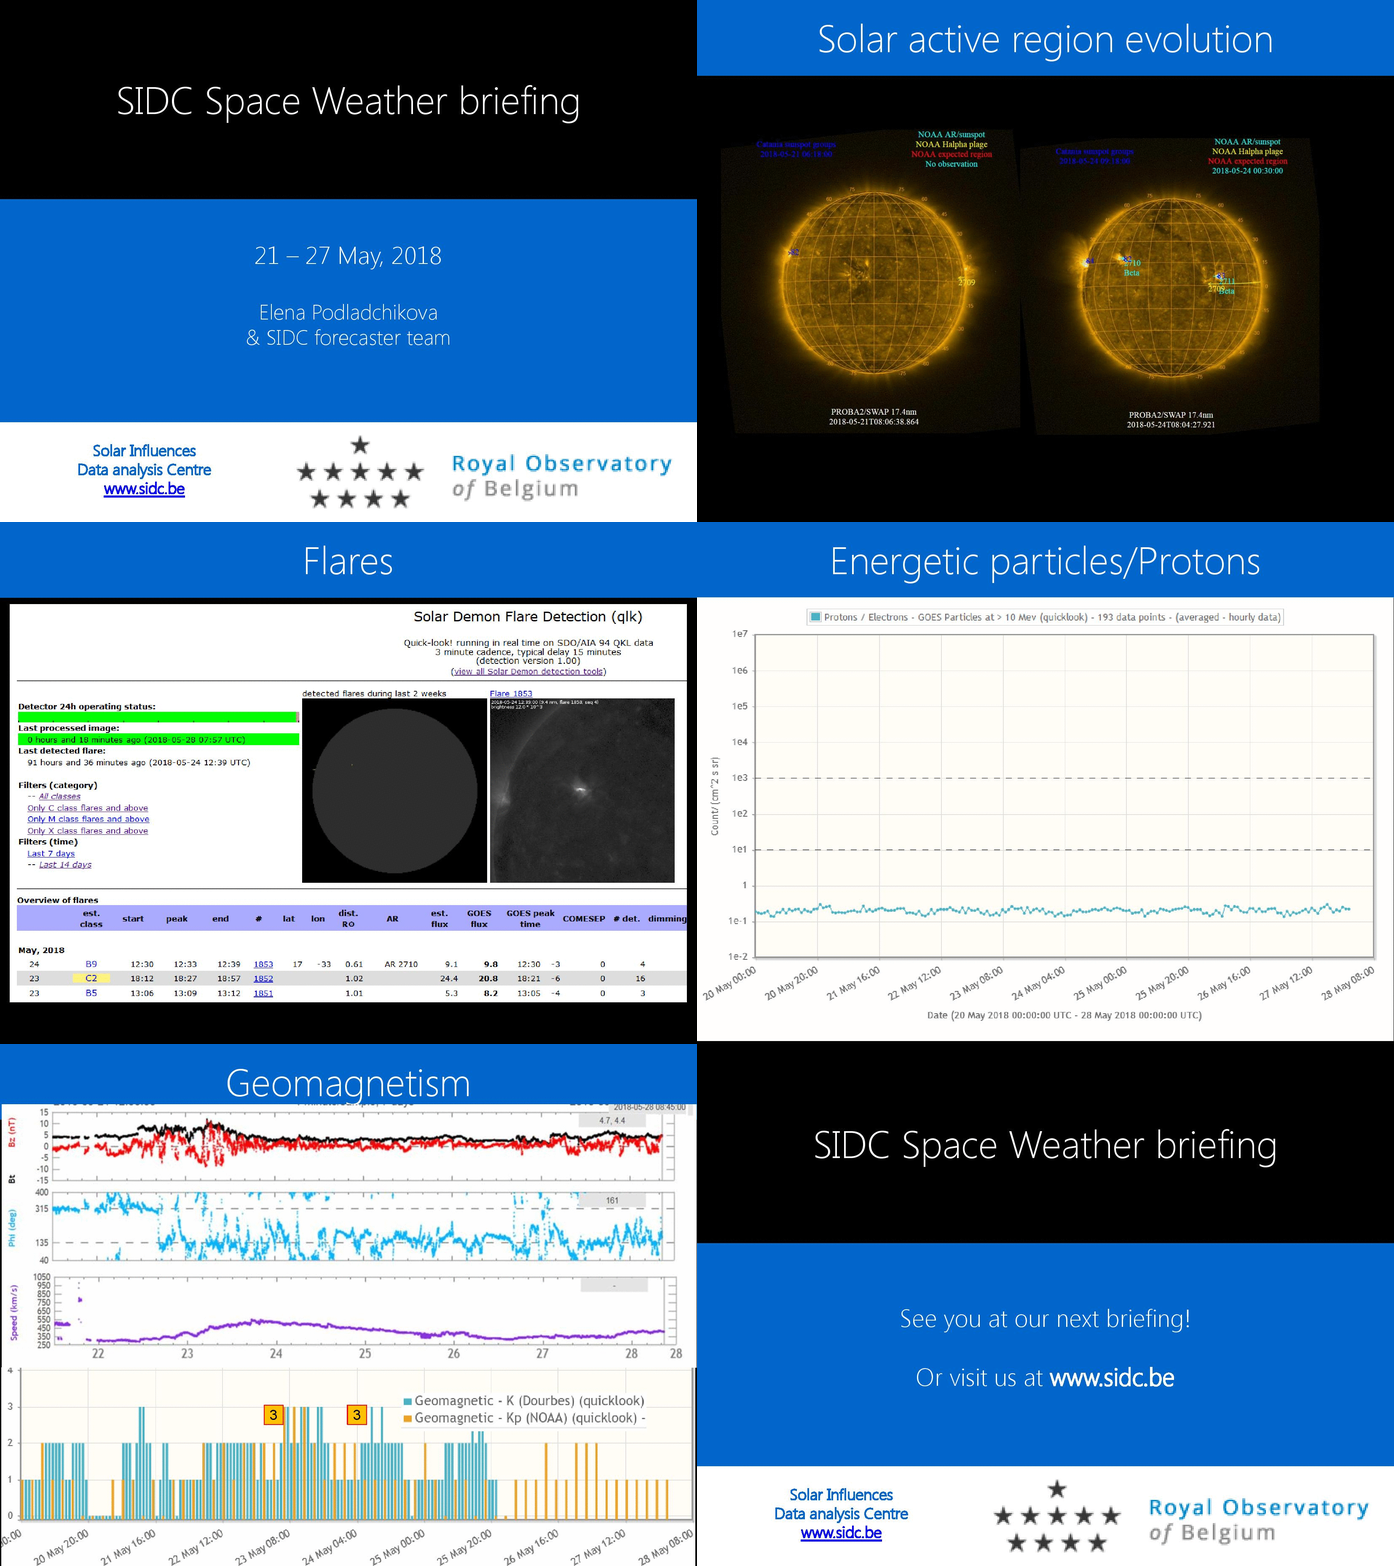
The briefing in pdf format: http://www.stce.be/briefings/SIDCbriefing_21_27May_finalfinal.pdf
The International Sunspot Number
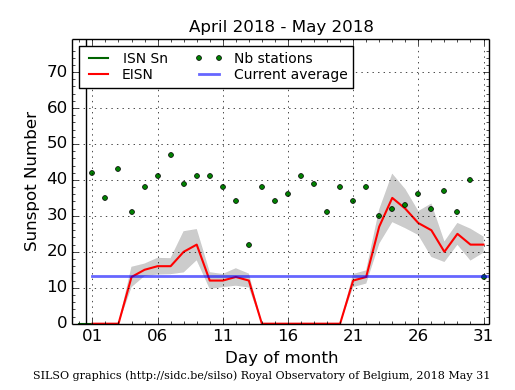
The daily Estimated International Sunspot Number (EISN, red curve with shaded error) derived by a simplified method from real-time data from the worldwide SILSO network. It extends the official Sunspot Number from the full processing of the preceding month (green line). The plot shows the last 30 days (about one solar rotation). The horizontal blue line shows the current monthly average, while the green dots give the number of stations included in the calculation of the EISN for each day.
Review of ionospheric activity (21 May 2018 - 27 May 2018)
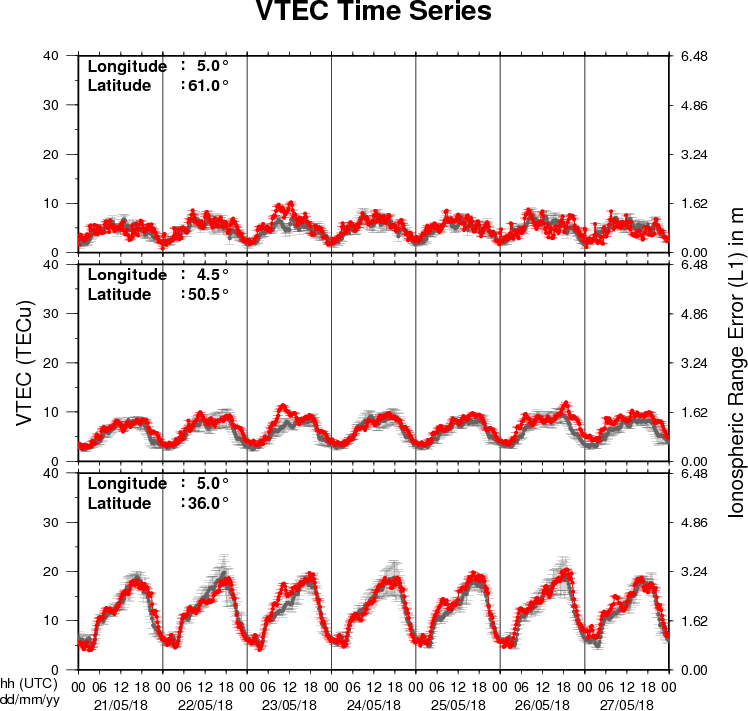
The figure shows the time evolution of the Vertical Total Electron Content (VTEC) (in red) during the last week at three locations:
a) in the northern part of Europe(N61°, 5°E)
b) above Brussels(N50.5°, 4.5°E)
c) in the southern part of Europe(N36°, 5°E)
This figure also shows (in grey) the normal ionospheric behaviour expected based on the median VTEC from the 15 previous days.
The VTEC is expressed in TECu (with TECu=10^16 electrons per square meter) and is directly related to the signal propagation delay due to the ionosphere (in figure: delay on GPS L1 frequency).
The Sun's radiation ionizes the Earth's upper atmosphere, the ionosphere, located from about 60km to 1000km above the Earth's surface.The ionization process in the ionosphere produces ions and free electrons. These electrons perturb the propagation of the GNSS (Global Navigation Satellite System) signals by inducing a so-called ionospheric delay.
See http://stce.be/newsletter/GNSS_final.pdf for some more explanations ; for detailed information, see http://gnss.be/ionosphere_tutorial.php
