- Table of Content
- 1.Fun in space
- 2.Einstein knew ...
- 3.PROBA2 Observa...
- 4.Review of sola...
- 5.The SIDC space...
- 6.The Internatio...
- 7.Geomagnetic Ob...
- 8.Review of iono...
2. Einstein knew it
3. PROBA2 Observations (4 Jun 2018 - 10 Jun 2018)
4. Review of solar and geomagnetic activity
5. The SIDC space weather Briefing
6. The International Sunspot Number
7. Geomagnetic Observations at Dourbes (4 Jun 2018 - 10 Jun 2018)
8. Review of ionospheric activity (4 Jun 2018 - 10 Jun 2018)
Fun in space
SWIC 2018 - The Space Weather Introductory Course for meteo-operators from the Netherlands was a success. After 3 days of intense courses, our pupils became skilled space weather bulletins and ursi interpreters. The course went even further than only absorbing academic knowledge. Space weather drama and art was also explored.
All 4 went home with a certificate, congratulations!
SWIC 018: https://events.oma.be/indico/event/54/
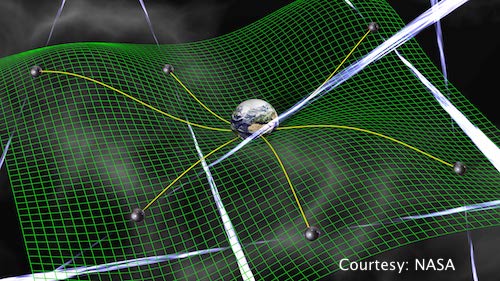
Einstein knew it
Einstein predicted gravitational waves. He was right. We can detect them, but they are extremely hard to catch them. Come and listen about the challenges of detection: https://events.oma.be/indico/event/52/ (subscription is for free and includes cake)
PROBA2 Observations (4 Jun 2018 - 10 Jun 2018)
Solar Activity
Solar flare activity fluctuated between very low and low during the week.
In order to view the activity of this week in more detail, we suggest to go to the following website from which all the daily (normal and difference) movies can be accessed: http://proba2.oma.be/ssa
This page also lists the recorded flaring events.
A weekly overview movie can be found here (SWAP week 428).
http://proba2.oma.be/swap/data/mpg/movies/weekly_movies/weekly_movie_2018_06_04.mp4
Details about some of this week’s events, can be found further below.
If any of the linked movies are unavailable they can be found in the P2SC movie repository here
http://proba2.oma.be/swap/data/mpg/movies/
Wednesday Jun 06
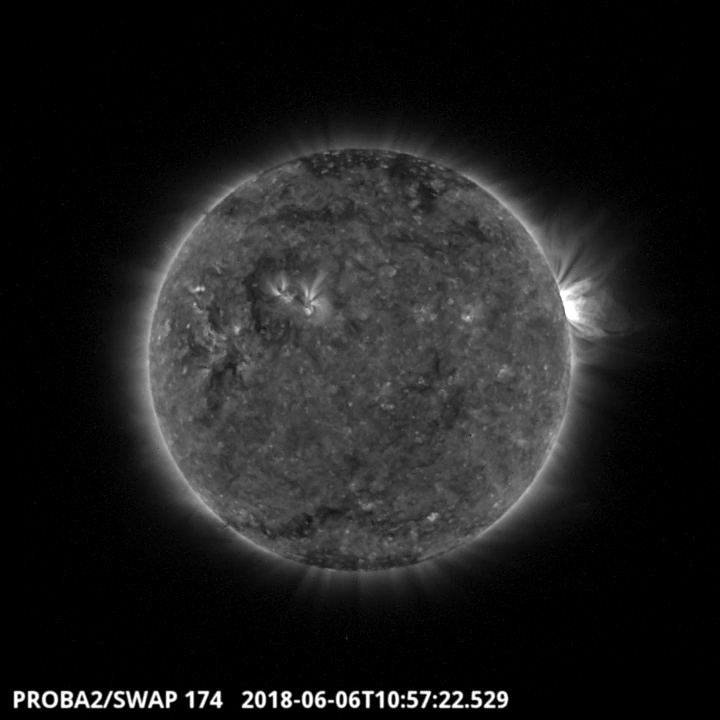
The largest flare of the week was a C1.0 class flare, the flare is visible on the West limb in the SWAP image above at 10:57 UT on 2018-Jun-06.
Find a movie of the event here (SWAP movie)
http://proba2.oma.be/swap/data/mpg/movies/20180606_swap_movie.mp4
Review of solar and geomagnetic activity
SOLAR ACTIVITY
Solar activity has been quiet. No significant flares have been recorded. Active Region (AR) 2712 was most active, producing the largest flare of the week, a C1.0 flare peaking at 11:00 UT on 06-Jun-2018. The region passed over the West limb on 07-Jun-2018. No Earth directed Coronal Mass Ejections (CMEs) have been detected. There were no significant coronal holes or filaments.
GEOMAGNETIC ACTIVITY
The solar wind speed began the week decreasing from around 800 km/s due to the passing of a High Speed Stream (HSS), by 07-Jun-2018 it reached background levels of around 370 km/s. The total magnetic field strength has fluctuated around 5 nT most of the week, and the Bz component fluctuated around 0, between -5 and +5 nT. However, there was a small enhancement in the Magnetic field strength (-9/+9 nT) on 06/07-Jun-2018, which appeared to have the characteristics of the passing of a small magnetic cloud. The source is not clear, but is possibly from AR 2712 at 09:16UT on 03-Jun-2018, where evidence of post eruption loops are seen and are consistent with the projected eruption time.
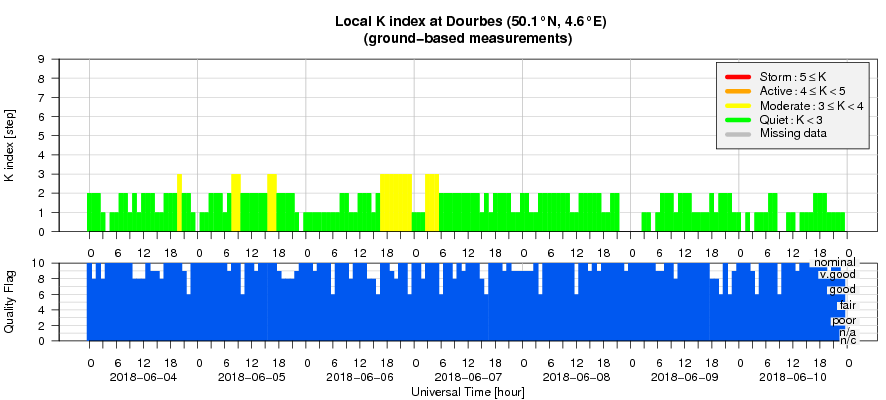
Geomagnetic conditions ranged between Kp index 0-3 (NOAA) and local K index 0-3 (Dourbes) over the past week.
The SIDC space weather Briefing
The Space Weather Briefing presented by the forecaster on duty from June 4 to 10. It reflects in images and graphs what is written in the Solar and Geomagnetic Activity report.
The pdf-version: http://www.stce.be/briefings/SIDCbriefing-20180611.pdf
The International Sunspot Number
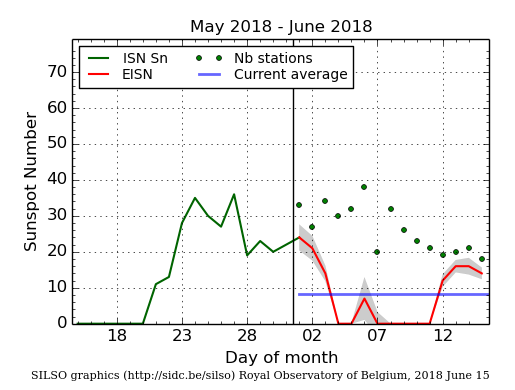
The daily Estimated International Sunspot Number (EISN, red curve with shaded error) derived by a simplified method from real-time data from the worldwide SILSO network. It extends the official Sunspot Number from the full processing of the preceding month (green line). The plot shows the last 30 days (about one solar rotation). The horizontal blue line shows the current monthly average, while the green dots give the number of stations included in the calculation of the EISN for each day.
Geomagnetic Observations at Dourbes (4 Jun 2018 - 10 Jun 2018)
Review of ionospheric activity (4 Jun 2018 - 10 Jun 2018)
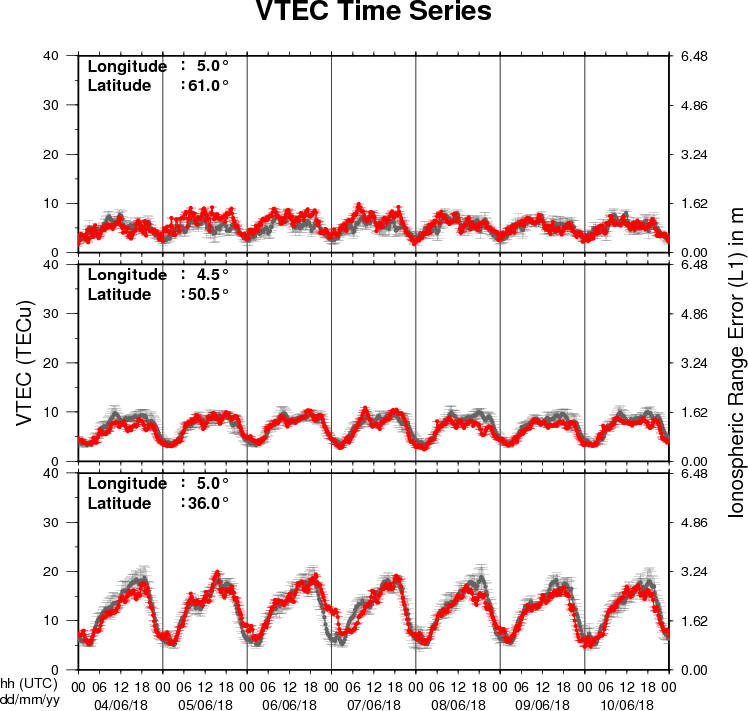
The figure shows the time evolution of the Vertical Total Electron Content (VTEC) (in red) during the last week at three locations:
a) in the northern part of Europe(N61°, 5°E)
b) above Brussels(N50.5°, 4.5°E)
c) in the southern part of Europe(N36°, 5°E)
This figure also shows (in grey) the normal ionospheric behaviour expected based on the median VTEC from the 15 previous days.
The VTEC is expressed in TECu (with TECu=10^16 electrons per square meter) and is directly related to the signal propagation delay due to the ionosphere (in figure: delay on GPS L1 frequency).
The Sun's radiation ionizes the Earth's upper atmosphere, the ionosphere, located from about 60km to 1000km above the Earth's surface.The ionization process in the ionosphere produces ions and free electrons. These electrons perturb the propagation of the GNSS (Global Navigation Satellite System) signals by inducing a so-called ionospheric delay.
See http://stce.be/newsletter/GNSS_final.pdf for some more explanations ; for detailed information, see http://gnss.be/ionosphere_tutorial.php