- Table of Content
- 1.The best of......
- 2.In the picture
- 3.PROBA2 Observa...
- 4.Review of sola...
- 5.The SIDC space...
- 6.The Internatio...
- 7.Geomagnetic Ob...
- 8.Review of iono...
2. In the picture
3. PROBA2 Observations (11 Jun 2018 - 17 Jun 2018)
4. Review of solar and geomagnetic activity
5. The SIDC space weather Briefing
6. The International Sunspot Number
7. Geomagnetic Observations at Dourbes (11 Jun 2018 - 17 Jun 2018)
8. Review of ionospheric activity (11 Jun 2018 - 17 Jun 2018)
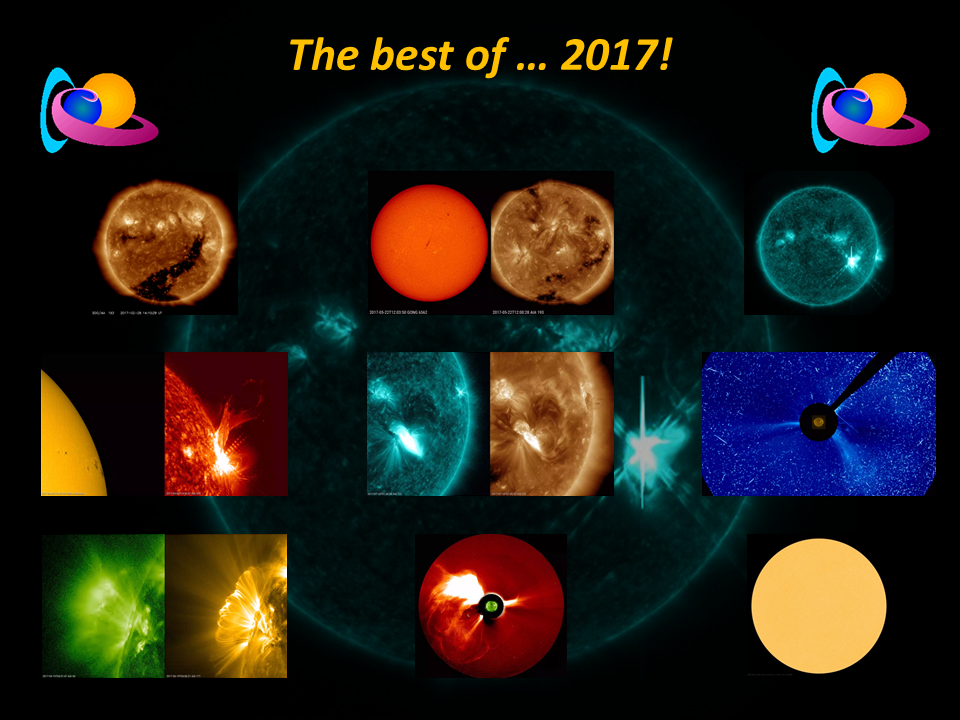
The best of... 2017!
A compilation of the most memorable space weather moments of 2017 can be found at the STCE's dedicated Solar Cycle 24 page: http://www.stce.be/highlights
Using the versatile (J)Helioviewer software (http://www.jhelioviewer.org/ ), a ***MOVIE*** was created containing one or more clips of each event. Mostly SDO-images were used, occasionally supplemented with imagery from PROBA2, SOHO and STEREO.
The movie can be found at https://youtu.be/0ncMUJL1GH8 , whereas the page with the accompanying information is at http://www.stce.be/news/428/welcome.html
We wish you a happy viewing!
In the picture
Nicolas, Viviane and Toby went to the 2nd URSI Atlantic Radio Science Meeting (http://www.atrasc.com/homepage.php) in Gran Canaria and presented their research on
the ionosphere above Antarctica: http://www.atrasc.com/content/stick/papers/AbstractAntion.pdf
a comparison of the ionosphere and plasmasphere between the two hemispheres: http://www.atrasc.com/content/stick/papers/AbstractBEZACOM.pdf
disturbances in the ionosphere during the 017 solar eclipse: http://www.atrasc.com/content/stick/papers/PID5180181.pdf
Signal-to-Noise ratio from ionosonde soundings: http://www.atrasc.com/content/stick/papers/PID5203719.pdf
It seemed to be ¡Qué guay!
.jpg)
Where are Nicolas, Viviane and Toby?

Ay Caramba!
PROBA2 Observations (11 Jun 2018 - 17 Jun 2018)
Solar Activity
Solar flare activity remained very low during the week.
In order to view the activity of this week in more detail, we suggest to go to the following website from which all the daily (normal and difference) movies can be accessed: http://proba2.oma.be/ssa
This page also lists the recorded flaring events.
A weekly overview movie can be found here (SWAP week 429): http://proba2.oma.be/swap/data/mpg/movies/weekly_movies/weekly_movie_2018_06_11.mp4
Details about some of this week's events, can be found further below.
If any of the linked movies are unavailable they can be found in the P2SC movie repository here: http://proba2.oma.be/swap/data/mpg/movies/
Thursday Jun 14
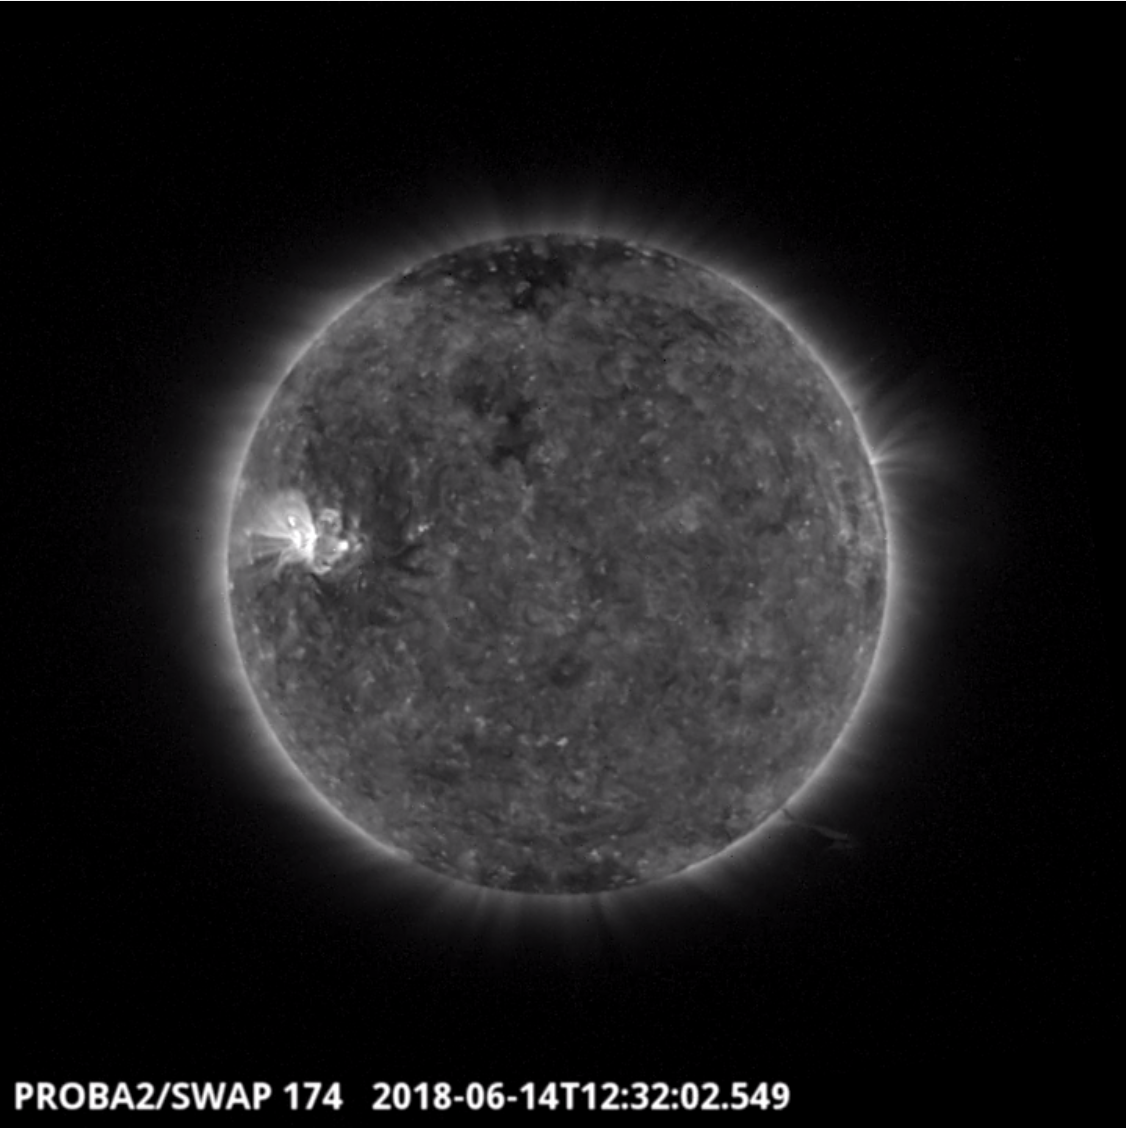
An eruption was observed by SWAP on the south-west limb of the Sun. This is visible in the SWAP image above at 12:32 UT on 2018-Jun-14.
Find a movie of the event here (SWAP movie): http://proba2.oma.be/swap/movies/20180614_swap_movie.mp4
Review of solar and geomagnetic activity
SOLAR ACTIVITY
Solar activity was very low throughout the week with only a couple of isolated minor B flares from Catania group 86, (NOAA region 2713). That region rotated on disk at the start of the period and was mostly stable and later in decay.
No Earth directed CMEs were observed in coronagraph data throughout the week.
Solar proton flux levels remained at background values.
GEOMAGNETIC ACTIVITY
Solar wind conditions were nominal with solar wind speed around 300 km/s and total magnetic field mostly between 2-6 nT, with a variable Bz component of the magnetic field. The magnetic field phi angle indicated a negative sector connection during most of the period. Around noon June 17, a sector change to positive orientation was seen, followed by an increase in magnetic field to 15nT and also solar wind speed starting an increase to just over 400 km/s by midnight June 17-18. This marked the first onset of the expected influence from the high speed stream by the positive polarity coronal hole in the northern hemisphere that had passed the central meridian June 14-15.
Geomagnetic conditions were quiet to unsettled (local K Dourbes 0-3 andNOAA Kp 0-2).
The SIDC space weather Briefing
The Space Weather Briefing presented by the forecaster on duty from June 11 to 17. It reflects in images and graphs what is written in the Solar and Geomagnetic Activity report.
Solar active region evolution movie: http://www.stce.be/briefings/JHV_2018-06-18_07.03.30.mp4
LASCO movie: http://www.stce.be/briefings/20180617_c2_combo.mp4
pdf version: http://www.stce.be/briefings/SIDCbriefing_20180618.pdf
The International Sunspot Number
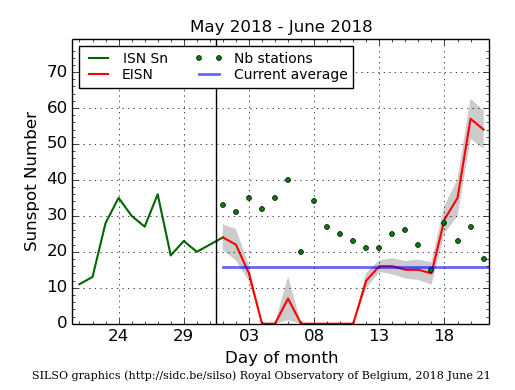
The daily Estimated International Sunspot Number (EISN, red curve with shaded error) derived by a simplified method from real-time data from the worldwide SILSO network. It extends the official Sunspot Number from the full processing of the preceding month (green line). The plot shows the last 30 days (about one solar rotation). The horizontal blue line shows the current monthly average, while the green dots give the number of stations included in the calculation of the EISN for each day.
The animated gif below is a series of USET (http://sidc.oma.be/uset/) sunspot drawings. USET is one of the stations in the earth based sunspot observing network sending their data to the World Data Center. You can see indeed that from May 18 onwards, the Sun becomes more spotted. Each sunspot group is denoted by a letter, i.e. Zurich Sunspot Classification (part of McIntosh) and a number, i.e. the number of sunspots in that group.
Geomagnetic Observations at Dourbes (11 Jun 2018 - 17 Jun 2018)

Review of ionospheric activity (11 Jun 2018 - 17 Jun 2018)
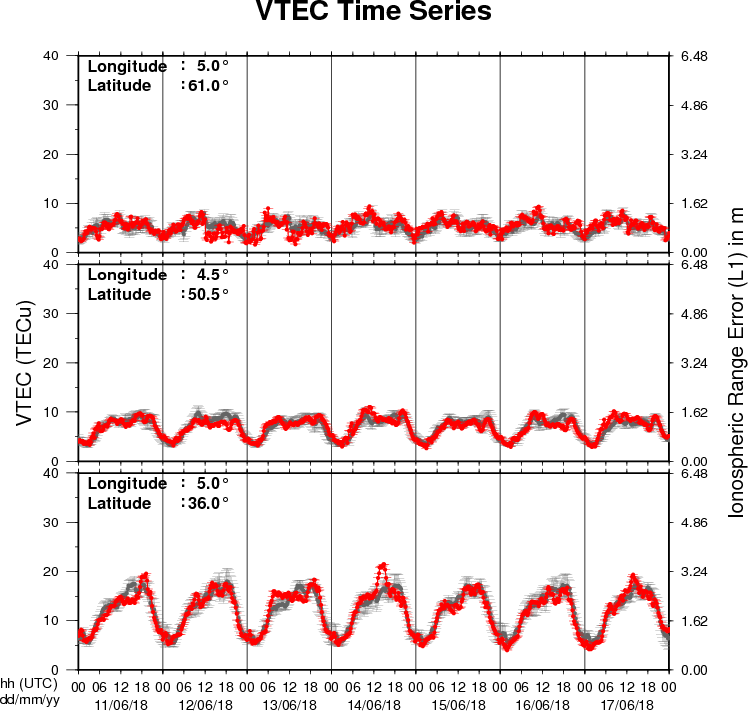
The figure shows the time evolution of the Vertical Total Electron Content (VTEC) (in red) during the last week at three locations:
a) in the northern part of Europe(N61°, 5°E)
b) above Brussels(N50.5°, 4.5°E)
c) in the southern part of Europe(N36°, 5°E)
This figure also shows (in grey) the normal ionospheric behaviour expected based on the median VTEC from the 15 previous days.
The VTEC is expressed in TECu (with TECu=10^16 electrons per square meter) and is directly related to the signal propagation delay due to the ionosphere (in figure: delay on GPS L1 frequency).
The Sun's radiation ionizes the Earth's upper atmosphere, the ionosphere, located from about 60km to 1000km above the Earth's surface.The ionization process in the ionosphere produces ions and free electrons. These electrons perturb the propagation of the GNSS (Global Navigation Satellite System) signals by inducing a so-called ionospheric delay.
See http://stce.be/newsletter/GNSS_final.pdf for some more explanations ; for detailed information, see http://gnss.be/ionosphere_tutorial.php