- Table of Content
- 1.ESWW15 news - ...
- 2.ESWW15 - Desig...
- 3.PROBA2 Observa...
- 4.Review of sola...
- 5.A week in the ...
- 6.Geomagnetic Ob...
- 7.The Internatio...
- 8.Review of iono...
- 9.Enjoy the holi...
2. ESWW15 - Design 4 a Ticket
3. PROBA2 Observations (18 Jun 2018 - 24 Jun 2018)
4. Review of solar and geomagnetic activity
5. A week in the life of the Sun
6. Geomagnetic Observations at Dourbes (18 Jun 2018 - 24 Jun 2018)
7. The International Sunspot Number
8. Review of ionospheric activity (18 Jun 2018 - 24 Jun 2018)
9. Enjoy the holidays!
ESWW15 news - The list of Topical Discussion Meetings is published
Dear ESWW enthousiast
A fast and short note to tell you that the schedule of the Topical Discussion Meetings is online: http://www.stce.be/esww15/program/tdms.php
ESWW15 promises to be a lively meeting, thanks to all the input we got from the TDM conveners.
Have nice holidays!
Mauro and Petra, on behalf of the PC

ESWW15 - Design 4 a Ticket
Dear ESWW15 creatives
Since 2006, each European Space Weather Week had a theme picture. For ESWW15, you again have the opportunity to design it.
We introduced this idea last year for ESWW14 and it was a great success, so we look forward to seeing your great ideas again this year.
Its worth the effort: the winning design is used for the website banner, the esww15 poster, presentations,... and wins a full week
esww15 ticket and a esww certificate!
Find out about a Design 4 a Ticket (D4T): http://www.stce.be/esww15/postercontest.php
Good Luck!
Mario, Gemma, Alexi, Pepa and Joelke, the 5 member D4T jury
PROBA2 Observations (18 Jun 2018 - 24 Jun 2018)
Solar Activity
Solar flare activity fluctuated between very low and low during the week.
In order to view the activity of this week in more detail, we suggest to go to the following website from which all the daily (normal and difference) movies can be accessed: http://proba2.oma.be/ssa
This page also lists the recorded flaring events.
A weekly overview movie can be found here (SWAP week 430).
http://proba2.oma.be/swap/data/mpg/movies/weekly_movies/weekly_movie_2018_06_18.mp4
Details about some of this week’s events, can be found further below.
If any of the linked movies are unavailable they can be found in the P2SC movie repository here
http://proba2.oma.be/swap/data/mpg/movies/
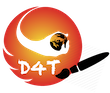
Wednesday Jun 20
The SWAP image above shows an elongated north coronal hole which transited the central meridian on 2018-Jun-20. Find a movie of the event here (SWAP movie)
http://proba2.oma.be/swap/data/mpg/movies/20180620_swap_movie.mp4
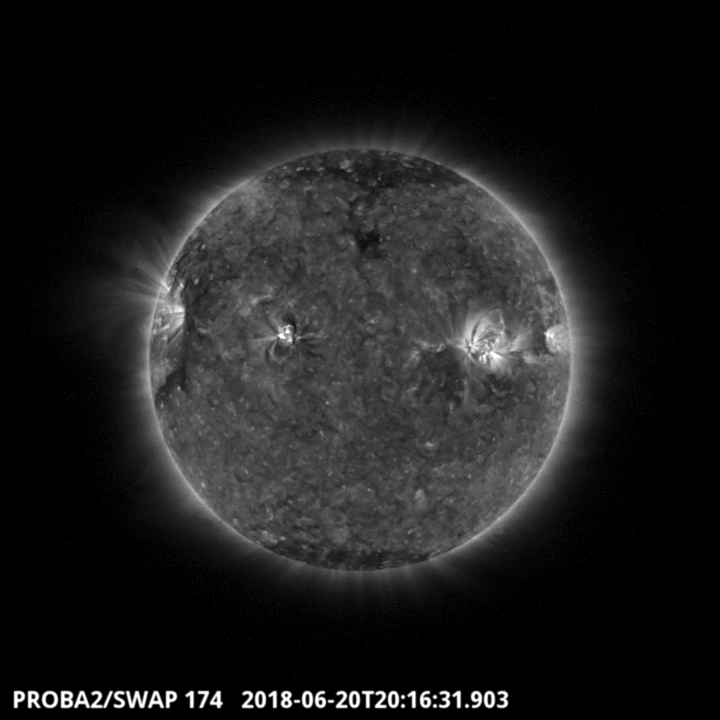
Thursday Jun 21
The largest flare of the week was a C2.1 class flare associated with the NOAA region 2715. The flare is visible on the North-East part of the SWAP image above at 01:17 UT on 2018-Jun-21.
Find a movie of the event here (SWAP movie)
http://proba2.oma.be/swap/data/mpg/movies/20180621_swap_movie.mp4
Review of solar and geomagnetic activity
SOLAR ACTIVITY
The sun was mostly quiet. Three sunspots were monitored: Catania sunspot group 86, 87 and 88 (NOAA active region 2713, 2714 and 2715). Catania sunspot group 88 (NOAA active region 2715) produced the bigger flare (C2.1-class flare on Jun 21), the other sunspots did not produce any flare above B-class.
No Earth directed Coronal Mass Ejection has been observed during the week and the greater than 10 MeV solar protons flux remained at nominal levels.
GEOMAGNETIC ACTIVITY
The fast solar wind associated with coronal holes marked this week geomagnetic activity.
On June 18, the solar wind speed reached 600 km/s, while the total magnetic field peaked at 20 nT, and the southward component of the interplanetary field reached -15 nT. This was due to the impact of a positive coronal hole in the northern hemisphere that passed the central meridian on Jun 15.
The solar wind speed decayed slowly to reach a minimum around 315 km/s on Jun 23 early in the day. On the same day, the solar wind was again enhanced due to the arrival of the solar wind coming from another positive polarity coronal hole in the northern hemisphere that was observed on the central meridian on Jun 20. The solar wind speed reached 510 km/s, the total magnetic field 15 nT, and the southward component -15 nT.
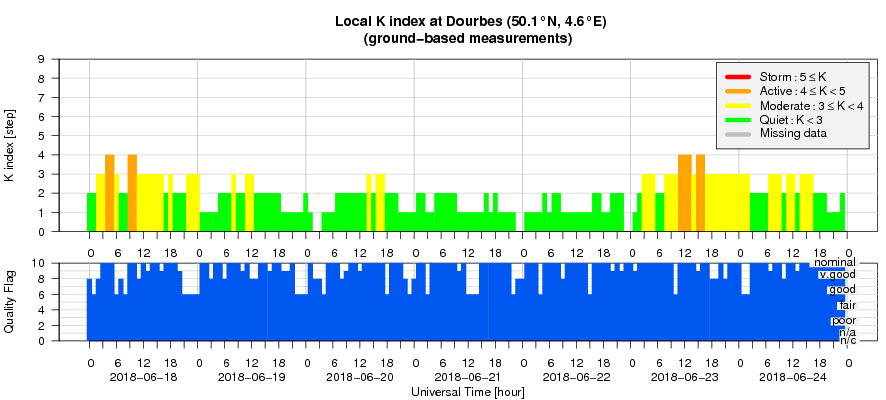
The geomagnetic conditions have been mostly unsettled to active due to the impact of the coronal holes mentioned above. The K-index (Dourbes) and Kp-index (NOAA) were ranging between 2 and 4 during the two episodes of solar wind enhancement (Jun 18-19 and Jun 23-24), and a minor storm was recorded (Kp-index = 5) at 03:00 UT on Jun 18.
A week in the life of the Sun
Check out what the Sun did this week:
or scroll through the pdf: http://www.stce.be/briefings/20180625_SWbriefing.pdf
Geomagnetic Observations at Dourbes (18 Jun 2018 - 24 Jun 2018)
The International Sunspot Number
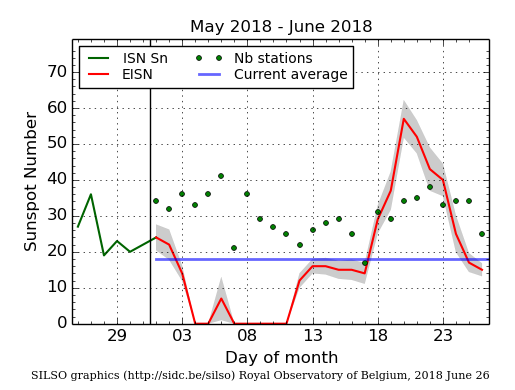
The daily Estimated International Sunspot Number (EISN, red curve with shaded error) derived by a simplified method from real-time data from the worldwide SILSO network. It extends the official Sunspot Number from the full processing of the preceding month (green line). The plot shows the last 30 days (about one solar rotation). The horizontal blue line shows the current monthly average, while the green dots give the number of stations included in the calculation of the EISN for each day.
Review of ionospheric activity (18 Jun 2018 - 24 Jun 2018)
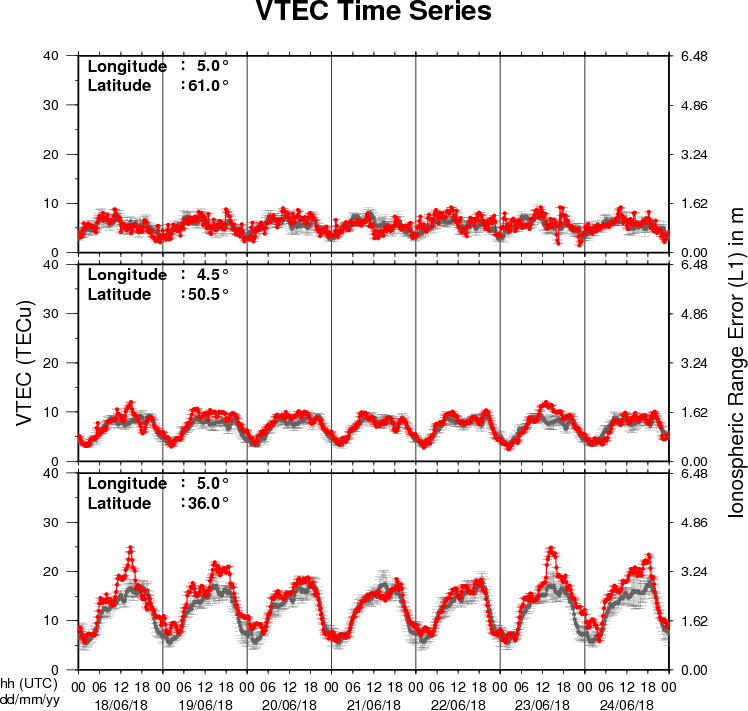
The figure shows the time evolution of the Vertical Total Electron Content (VTEC) (in red) during the last week at three locations:
a) in the northern part of Europe(N61°, 5°E)
b) above Brussels(N50.5°, 4.5°E)
c) in the southern part of Europe(N36°, 5°E)
This figure also shows (in grey) the normal ionospheric behaviour expected based on the median VTEC from the 15 previous days.
The VTEC is expressed in TECu (with TECu=10^16 electrons per square meter) and is directly related to the signal propagation delay due to the ionosphere (in figure: delay on GPS L1 frequency).
The Sun's radiation ionizes the Earth's upper atmosphere, the ionosphere, located from about 60km to 1000km above the Earth's surface.The ionization process in the ionosphere produces ions and free electrons. These electrons perturb the propagation of the GNSS (Global Navigation Satellite System) signals by inducing a so-called ionospheric delay.
See http://stce.be/newsletter/GNSS_final.pdf for some more explanations ; for detailed information, see http://gnss.be/ionosphere_tutorial.php
Enjoy the holidays!
Time to forget which day it is.