- Table of Content
- 1.Pores or sunsp...
- 2.Review of sola...
- 3.PROBA2 Observa...
- 4.The Internatio...
- 5.Review of geom...
- 6.Geomagnetic Ob...
- 7.The SIDC space...
- 8.Review of iono...
2. Review of solar activity
3. PROBA2 Observations (9 Jul 2018 - 15 Jul 2018)
4. The International Sunspot Number - it's oh so quiet
5. Review of geomagnetic activity
6. Geomagnetic Observations at Dourbes (9 Jul 2018 - 15 Jul 2018)
7. The SIDC space weather Briefing
8. Review of ionospheric activity (9 Jul 2018 - 15 Jul 2018)
Pores or sunspots?
A relatively large faculae field rotated over the Sun's east limb on 8 and 9 July. Faculae are local concentrations of magnetic field on the solar surface, but they are not strong enough to form sunspots. As such, they appear as brighter areas on the solar surface, in particular near the solar limb. In this case the faculae field near the east limb was the remnant of sunspot group NOAA 2713, which had decayed during its farside transit. No surprise then that the faculae field initially appeared spotless. The figure underneath shows the bright spotless faculae field on 10 July (left) and the same field on 14 July when it was near disk centre.
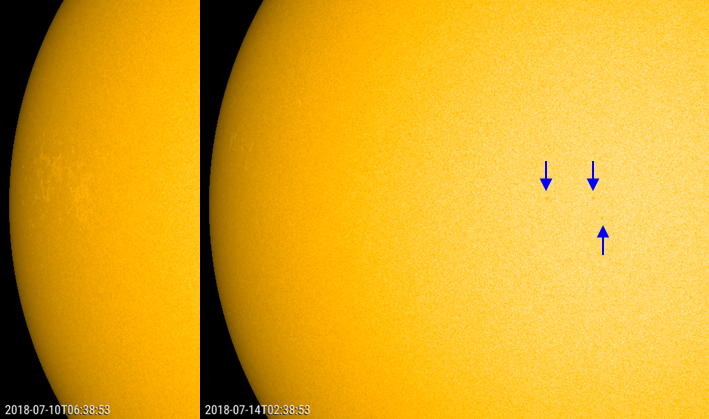
On 12 July, SDO/HMI (https://sdo.gsfc.nasa.gov/data/aiahmi/ ) imagery showed the development of some greyish features in both the leading and trailing portion of the faculae field. These are called pores, with some of them indicated by blue arrows in the image above (right). Solar pores are small premature sunspots, representing intermediate sizes (about 1000 km) between small-scale magnetic elements and mature sunspots. Unlike a normal sunspot with distinct fine structures in both the penumbra and the umbra, a pore has a simple magnetic field configuration with a strong vertical magnetic field and no penumbral structure. Pores are usually identified by their low continuum intensity, about 20%-80% of the surrounding photosphere intensity (sunspots are even darker, about 10%). A pore usually decomposes into individual magnetic elements within a few hours and in some cases grows by the accumulation of the surrounding magnetic elements.
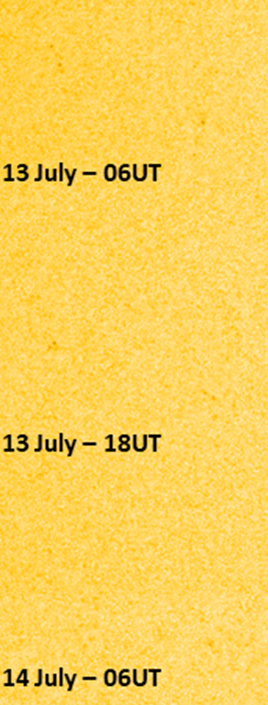
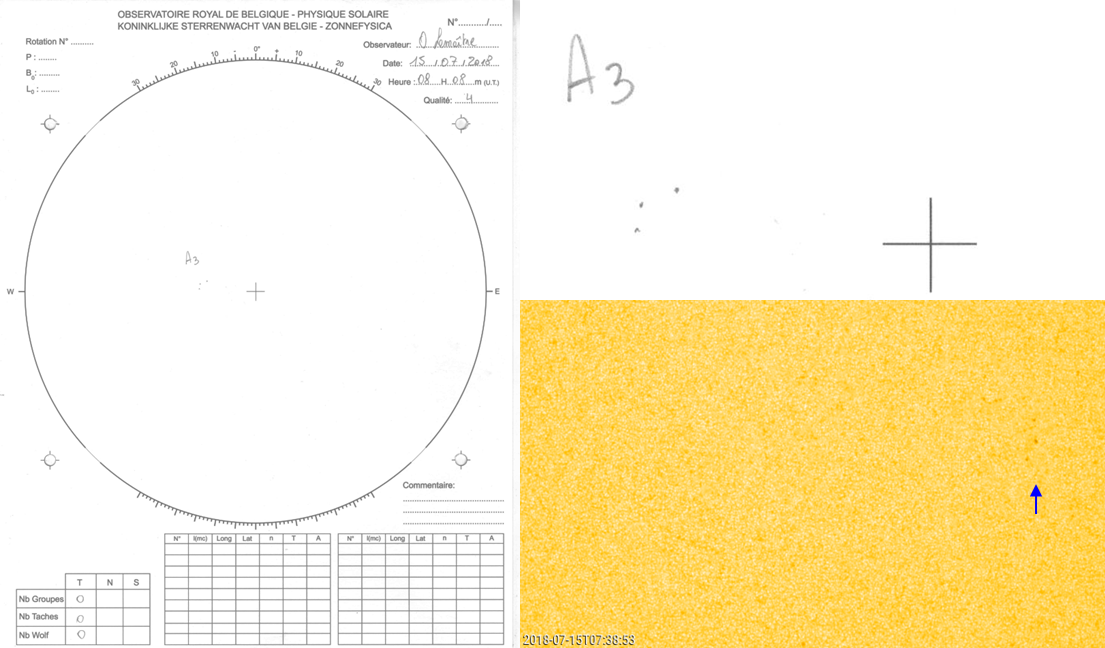
In this case, there seems to have been a continued emergence and decaying of pores in the leading and trailing portions of the faculae field, without actually evolving into a mature spot. In the imagery above (SDO/HMI 4K images, i.e. highest resolution!), one can see these pores evolving, but even the darkest ones do not last for more than about a day, and most pores are gone after only a few hours. The pores were not visible in small telescopes, but solar observers using somewhat larger aperture telescopes (12-15 cm openings and higher), were able to see them. As pores were visible for several days in the same areas of the faculae field, some observers such as at USET (http://www.sidc.be/uset/ ) justifiably reported a small sunspot group from 13 till 15 July. See compilation underneath - note the USET drawings (and zoom) are mirror-reversed.
Further reading - The descriptive definition of the pores was taken from Cho et al. (2010): Tiny pores observed by HINODE/Solar Optical Telescope (http://adsabs.harvard.edu/abs/2010ApJ...723..440C ).
Animations of the pores' evolution can be found at http://www.stce.be/news/431/welcome.html They were created with JHelioviewer (http://www.jhelioviewer.org/ ).
Review of solar activity
Solar activity was very very low.
No significant flares have been recorded. A B1.5 and B1.3 flare were recorded on 15-Jul-2018.
EISN is zero but there are flares?
Flares are typically linked with sunspots. But how can you reconcile this with the EISN (see tab 'The International Sunspot Number') which was zero on that day? First, some observer might classify a grey/black structure on the Sun as a sunspot, others might classify it as a pore, others might even not see it! Check 'Pores or Sunspots?' in this newsletter. The program that calculates the EISN throws out outliers in a statistically correct manner. So, it is possible that a station observes a sunspot, but that the EISN is zero.
The other parameters
The greater than 10 MeV proton flux remained at background levels throughout the week.
No Earth directed CMEs were detected.
There were no significant coronal holes on the solar disk, except one small region of negative polarity coronal hole which crossed central meridian on 13-July-2018.
PROBA2 Observations (9 Jul 2018 - 15 Jul 2018)
Solar Activity
Solar flare activity fluctuated was very low during the week.
In order to view the activity of this week in more detail, we suggest to go to the following website from which all the daily (normal and difference) movies can be accessed: http://proba2.oma.be/ssa
This page also lists the recorded flaring events.
A weekly overview movie can be found here (SWAP week 433).
http://proba2.oma.be/swap/data/mpg/movies/weekly_movies/weekly_movie_2018_07_09.mp4
Details about some of this week’s events, can be found further below.
If any of the linked movies are unavailable they can be found in the P2SC movie repository here.
http://proba2.oma.be/swap/data/mpg/movies/
Sunday Jul 15
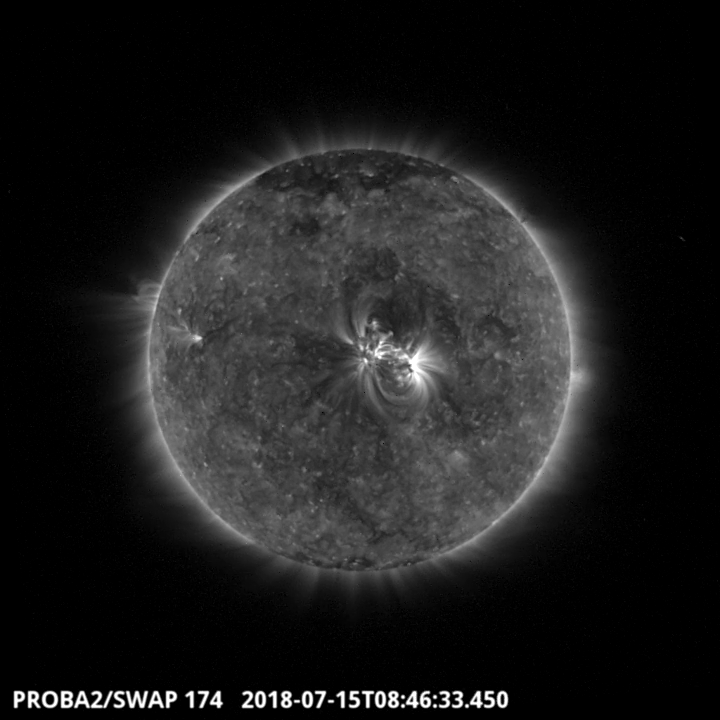
The largest flare of the week was a B1.5 class flare. The flare is visible on the central part of the SWAP image above at 08:46 UT on 2018-Jul-15. Find a movie of the events here(SWAP movie)
http://proba2.oma.be/swap/data/mpg/movies/20180715_swap_movie.mp4
The International Sunspot Number - it's oh so quiet
From June 28, the green and red curve in the graph below seems to vanish. This is not because there are no data, but because the data points equal zero, already for more than 20 days.
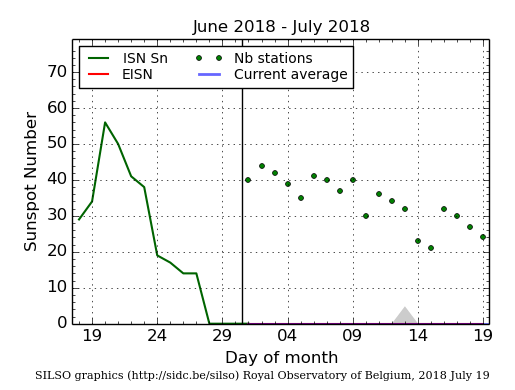
The daily Estimated International Sunspot Number (EISN, red curve with shaded error) derived by a simplified method from real-time data from the worldwide SILSO network. It extends the official Sunspot Number from the full processing of the preceding month (green line). The plot shows the last 30 days (about one solar rotation). The horizontal blue line shows the current monthly average, while the green dots give the number of stations included in the calculation of the EISN for each day.
Review of geomagnetic activity
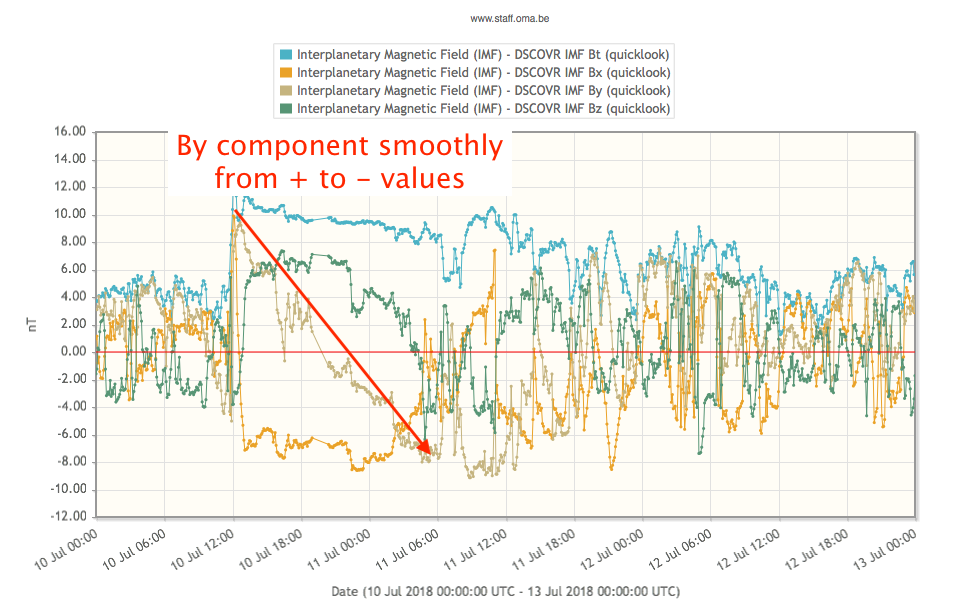
On July 10, a slow but dense magnetic structure passed the spacecraft DSCOVR at the L1 point. The total magnetic field (Bt) jumped to +13 nT, the Bz component jumped to +7 nT. The Phi-angle changed in a smooth way from around 130 degrees to around 315 degrees. This shows that the magnetic field in the ecliptic plane smoothly rotated from an outward to an inward orientation. This is also reflected by the By component that changes smoothly from positive to negative values. Check the DSCOVR graphs:
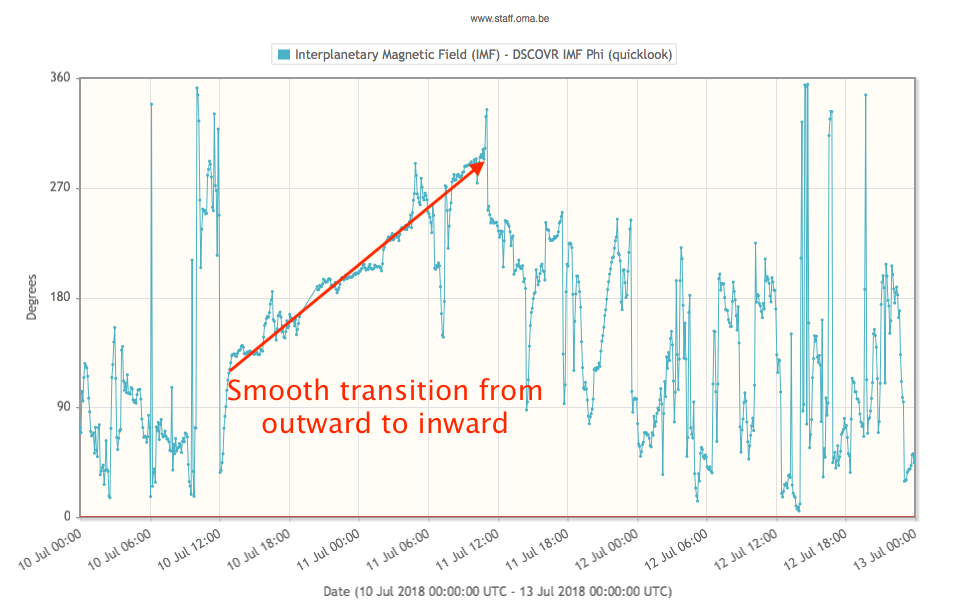
This structure is probably linked to the filament that erupted late on July 4. The associated small earth-directed coronal mass ejection (CME) was seen in STEREO COR-A (not in LASCO) at that time and was expected to pass the L1 point on July 10, as it did.
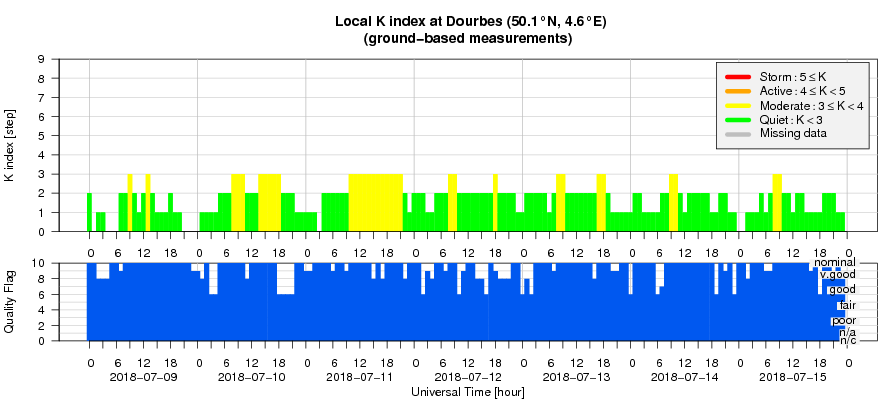
The geomagnetic conditions were quiet with the Kp and the local K_Dourbes index between 0 and 3.
Geomagnetic Observations at Dourbes (9 Jul 2018 - 15 Jul 2018)
The SIDC space weather Briefing
The Space Weather Briefing presented by the forecaster on duty from July 9 to 15. It reflects in images and graphs what is written in the Solar and Geomagnetic Activity report.
A selfrunning ppsm version is available here: http://www.stce.be/briefings/SIDCbriefing-20180716.ppsm
A pdf version here: http://www.stce.be/briefings/SIDCbriefing-20180716.pdf

Review of ionospheric activity (9 Jul 2018 - 15 Jul 2018)
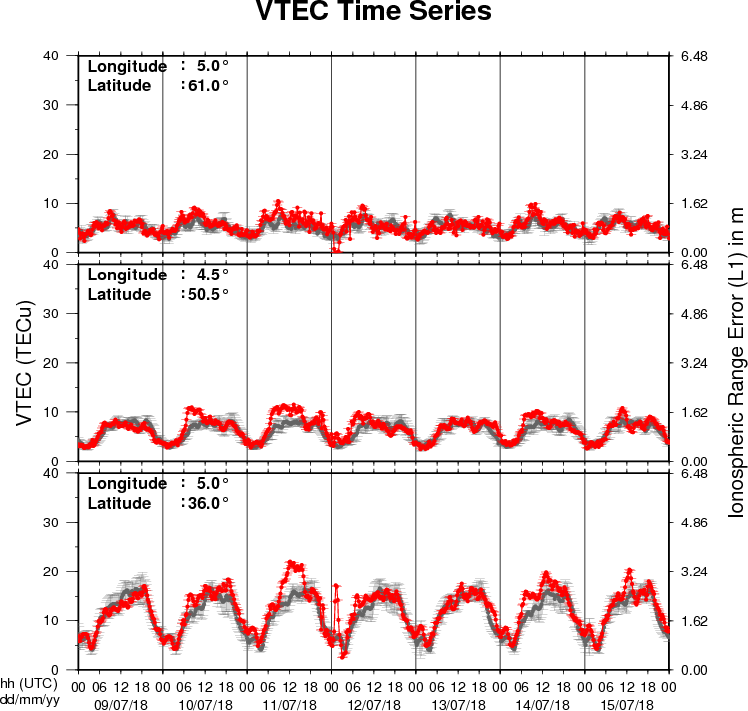
The figure shows the time evolution of the Vertical Total Electron Content (VTEC) (in red) during the last week at three locations:
a) in the northern part of Europe(N61°, 5°E)
b) above Brussels(N50.5°, 4.5°E)
c) in the southern part of Europe(N36°, 5°E)
This figure also shows (in grey) the normal ionospheric behaviour expected based on the median VTEC from the 15 previous days.
The VTEC is expressed in TECu (with TECu=10^16 electrons per square meter) and is directly related to the signal propagation delay due to the ionosphere (in figure: delay on GPS L1 frequency).
The Sun's radiation ionizes the Earth's upper atmosphere, the ionosphere, located from about 60km to 1000km above the Earth's surface.The ionization process in the ionosphere produces ions and free electrons. These electrons perturb the propagation of the GNSS (Global Navigation Satellite System) signals by inducing a so-called ionospheric delay.
See http://stce.be/newsletter/GNSS_final.pdf for some more explanations ; for detailed information, see http://gnss.be/ionosphere_tutorial.php