- Table of Content
- 1.Cosmic rays
- 2.Review of sola...
- 3.PROBA2 Observa...
- 4.The Internatio...
- 5.Review of geom...
- 6.Geomagnetic Ob...
- 7.The SIDC Space...
- 8.Review of iono...
2. Review of solar activity
3. PROBA2 Observations (23 Jul 2018 - 29 Jul 2018)
4. The International Sunspot Number
5. Review of geomagnetic activity
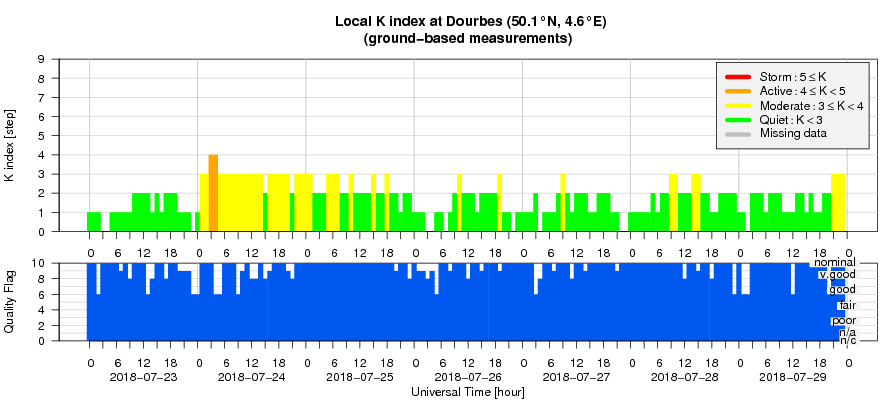
6. Geomagnetic Observations at Dourbes (23 Jul 2018 - 29 Jul 2018)
7. The SIDC Space Weather Briefing
8. Review of ionospheric activity (23 Jul 2018 - 29 Jul 2018)
Cosmic rays
Solar minimum is approaching and the solar activity has been very low for many months now. As a result, we are exposed again to more high-energetic particles coming from outside our solar system, the so-called cosmic rays. Note that the term "ray" is somewhat misleading, dating from the times when cosmic rays were thought to be some kind of electromagnetic radiation. When researchers talk about cosmic rays, they usually mean those particles coming from every direction outside our solar system. Those coming from our own galaxy or from other galaxies are also called galactic cosmic rays (GCR), to distinguish them from solar cosmic rays (SCR; occasionally produced during strong solar flares) and anomalous cosmic rays (ACR; produced near the solar wind termination shock within our heliosphere). See NASA's Cosmicopia (https://helios.gsfc.nasa.gov/cosmic.html ) for more details on the different types of cosmic rays.
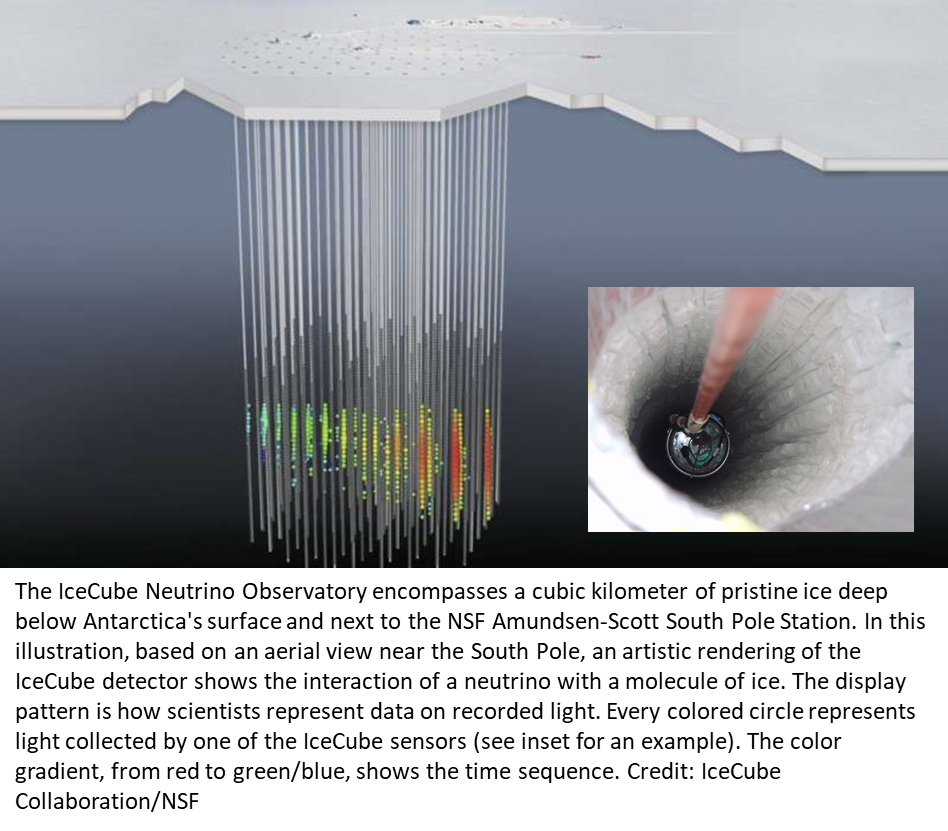
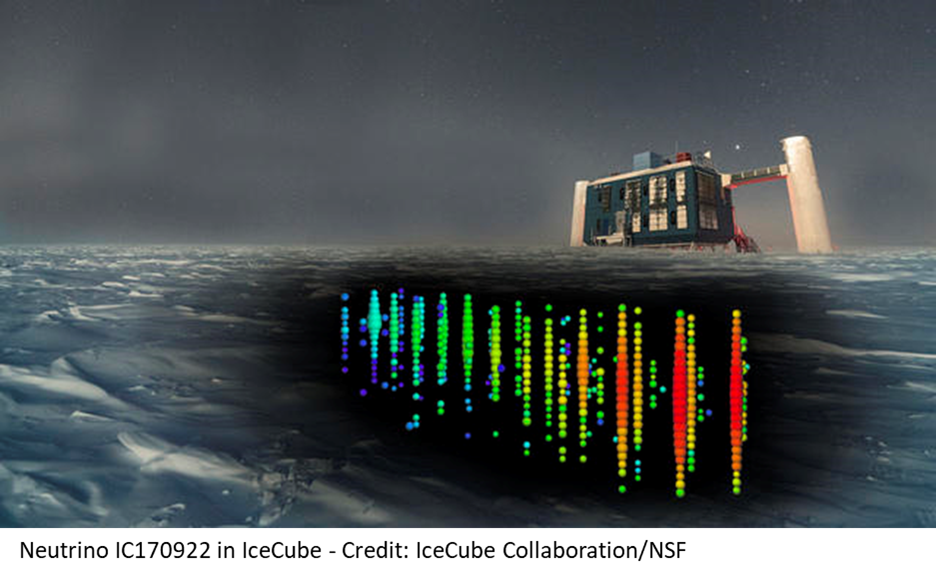
Interestingly, the potential sources of the cosmic rays are still somewhat of a mystery. Indeed, because cosmic rays are charged particles, their paths cannot be traced directly back to their sources due to the powerful magnetic fields that fill space and warp their trajectories. But the powerful cosmic accelerators that produce them will also produce neutrinos. Neutrinos are uncharged particles, unaffected by even the most powerful magnetic field. Because they rarely interact with matter and have almost no mass, neutrinos travel nearly undisturbed from their accelerators, giving scientists an almost direct pointer to their source. On 12 July, an international team of scientists led by the IceCube Neutrino Observatory (located in Antarctica - see image above) announced that they had just traced such a high-energy neutrino back to its point of origin 3.7 billion light-years away (note our Sun is just about 8 light-minutes away...). The neutrino hit the IceCube detectors, which are buried under 1.5 to 2.5 km of ice, on 22 September. Following the alert sent out by the IceCube team, a whole suite of satellites and other instruments were immediately directed to the possible location. The source of the neutrino was found to be a blazar, i.e. a giant elliptical galaxy with a massive, rapidly spinning black hole at its core. The press release by IceCube (https://icecube.wisc.edu/news/view/586 ) reveals all the details on how the discovery was made. So, now at least one source of cosmic rays has been identified!
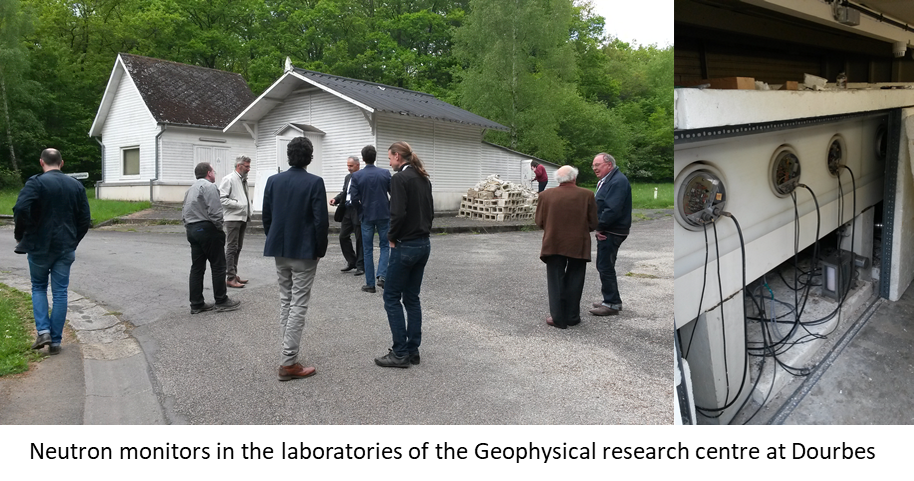
When entering the heliosphere, cosmic rays encounter a turbulent solar wind with an embedded heliospheric magnetic field. The higher the solar activity, the more intense and complex this magnetic field, and the more difficult it is for a particle to make it all the way to the Earth. When some finally arrive, they collide with particles in the Earth's atmosphere, creating a shower of secondary particles such as neutrons (an entirely different particle than a neutrino). These neutrons are detected by neutron monitors such as in Dourbes (http://ionosphere.meteo.be/instruments/neutron.php ) or various other sites around the world (Moscow, Oulu,...).
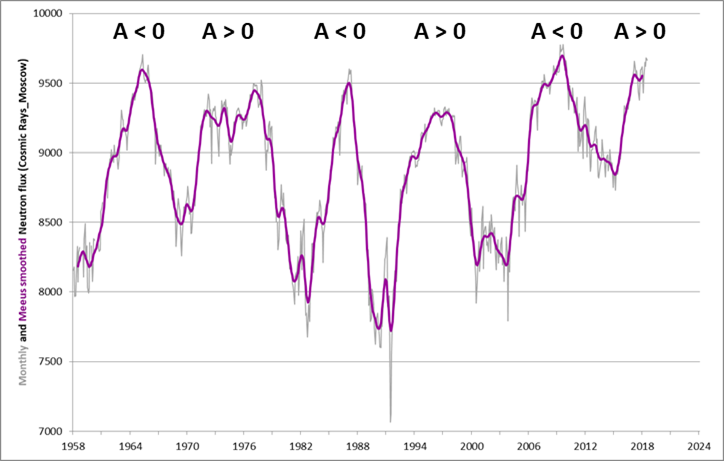
The graph underneath shows the monthly and monthly smoothed neutron count by the neutron monitor from Moscow since 1958. One can readily see the 11 year solar cycle modulation, with particle counts being the highest during low solar activity (solar cycle minimum) and vice versa. There's also a 22 year cycle, constituting of a "pointy" (A smaller than 0) and a "flat" (A greater than 0) maximum in the neutron counts. This is because the cosmic rays are charged particles, and thus they react differently to the different magnetic configuration in the heliosphere created after each polar field reversal on the Sun. "A" represents the polarity of the solar magnetic field, which is taken as positive (A greater than 0) when the dominant polar field is outward in the northern and inward in the southern hemisphere, and it is taken as negative (A smaller than 0) if the opposite is the case. One can also see that the current neutron counts are already similar to those recorded during the unusual deep and long solar cycle minimum in 2008-2009. Some of the dips in the monthly values are due to high solar activity: many coronal mass ejections act as magnetic shields against the cosmic rays, effectively reducing the final neutron count. The small dip at the most recent maximum corresponds to the high solar activity in September 2017. Studies of cosmic rays are very important, as these massive high-energetic particles pose a formidable radiation hazard to astronauts on a future mission to e.g. Mars or the Moon.
Further reading
- The IceCube press release is at https://icecube.wisc.edu/news/view/586 , with more info on the IceCube neutrino observatory is at https://icecube.wisc.edu/
- ESA's INTEGRAL joins multi-messenger campaign to study high-energy neutrino source http://sci.esa.int/integral/60492-integral-joins-multi-messenger-campaign-to-study-high-energy-neutrino-source/ , 12 July 2018
- More than century-old riddle resolved: a blazar is a source of high-energy neutrinos, https://phys.org/news/2018-07-century-old-riddle-resolveda-blazar-source.html , Phys.Org, 12 July 2018
- Solar Modulation of Cosmic Rays, http://adsabs.harvard.edu/abs/2013LRSP...10....3P , LRSP, Marius S. Potgieter (2013)
- STCE Workshop on Cosmic Rays, https://events.oma.be/indico/event/10/ , Dourbes, 17 May 2016
Review of solar activity
The Sun remained spotless throughout the week, with the GOES X-ray background flux at or below the A2 level. There were only a few A-class flares at the end of the week, produced by a new, spotless region near the east limb. There were no strong filament eruptions nor earth-directed coronal mass ejections (CMEs). The greater than 10 MeV proton flux was at nominal levels throughout the week.
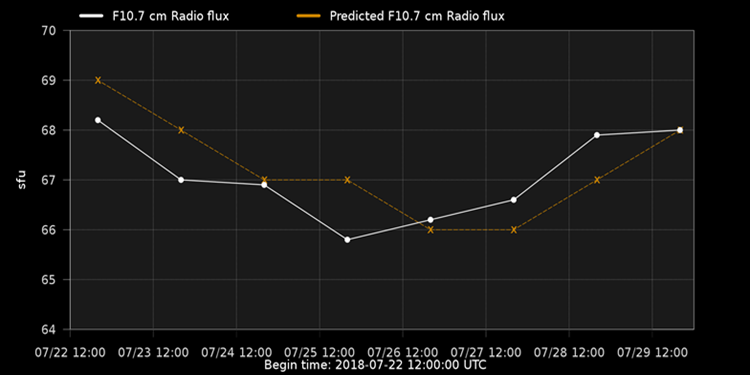
The figure underneath shows the observed (Penticton) and SIDC predicted 10.7cm solar radio flux from 22 till 29 July. The values are typical for a solar cycle minimum. See the STCE newsitem at http://www.stce.be/news/374/welcome.html for more info on the radio flux.
PROBA2 Observations (23 Jul 2018 - 29 Jul 2018)
Solar Activity
Solar flare activity was very low during the week.
In order to view the activity of this week in more detail, we suggest to go to the following website from which all the daily (normal and difference) movies can be accessed: http://proba2.oma.be/ssa
This page also lists the recorded flaring events.
A weekly overview movie can be found here (SWAP week 435).
http://proba2.oma.be/swap/data/mpg/movies/weekly_movies/weekly_movie_2018_07_23.mp4
Details about some of this week’s events, can be found further below.
If any of the linked movies are unavailable they can be found in the P2SC movie repository here
http://proba2.oma.be/swap/data/mpg/movies/
Sunday Jul 29
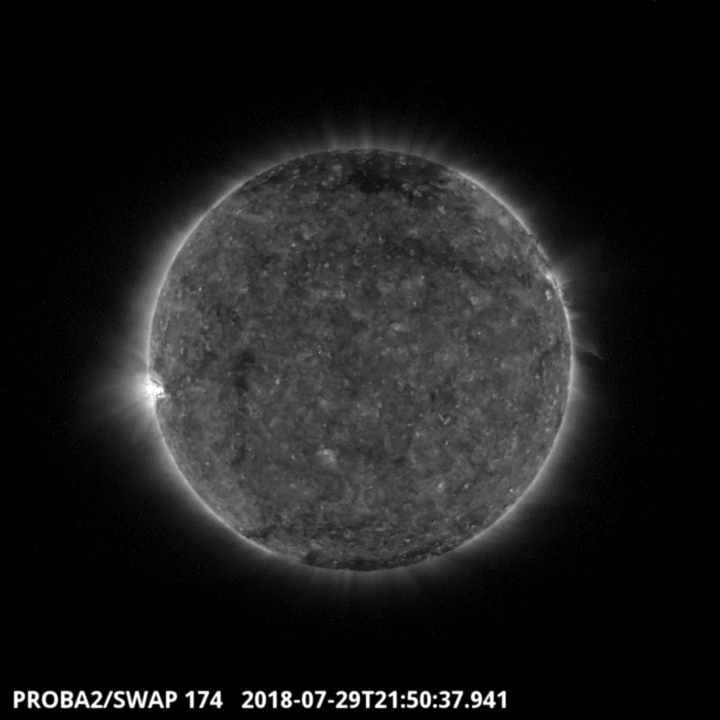
The largest flare of the week was a B1.0 class flare. The flare is visible in the SWAP image above (East limb of the Sun) at 21:50 UT on 2018-Jul-29.Find a movie of the events here (SWAP movie)
http://proba2.oma.be/swap/data/mpg/movies/20180729_swap_movie.mp4
The International Sunspot Number
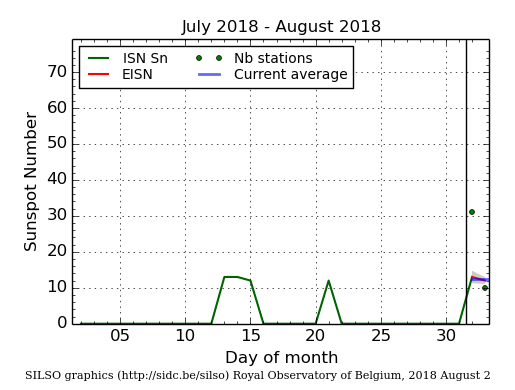
The daily Estimated International Sunspot Number (EISN, red curve with shaded error) derived by a simplified method from real-time data from the worldwide SILSO network. It extends the official Sunspot Number from the full processing of the preceding month (green line). The plot shows the last 30 days (about one solar rotation). The horizontal blue line shows the current monthly average, while the green dots give the number of stations included in the calculation of the EISN for each day.
Review of geomagnetic activity
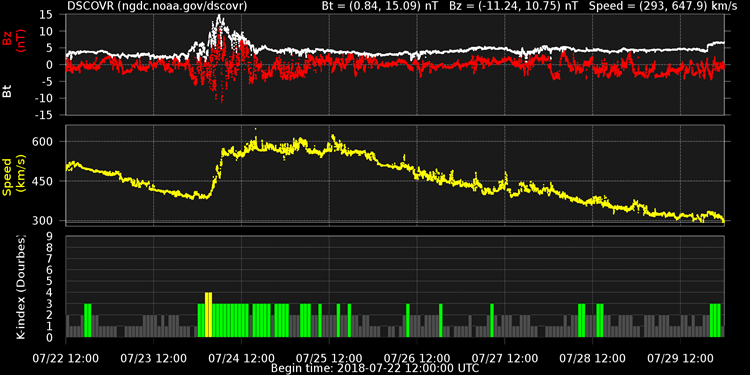
A predicted high speed stream associated with a negative polarity equatorial coronal hole arrived near Earth around 02:50 UT on 24 July. Solar wind speed as registered by DSCOVR rose from about 395 to a maximum near 620 km/s. The Interplanetary Magnetic Field (IMF) changed its orientation from away from the Sun to towards the Sun and its magnitude rose to 15 nT. The IMF magnitude returned to nominal levels near 5 nT in the second half of 24 July. There were several short periods with Bz below -5 nT on 24 July, but geomagnetic activity never surpassed active conditions (K Dourbes = 4). On 26 July, solar wind speed started a gradual descent towards speeds near 315 km/s by the end of the week.
Geomagnetic Observations at Dourbes (23 Jul 2018 - 29 Jul 2018)
The SIDC Space Weather Briefing
The Space Weather Briefing presented by the forecaster on duty from 23 July till 29 July. It reflects in images and graphs what is written in the Solar and Geomagnetic Activity reports. A .wmv version can be found at http://stce.be/movies/SIDCbriefing_20180723_0729.wmv A pdf version is available at http://stce.be/movies/SIDCbriefing_20180723_0729.pdf

Review of ionospheric activity (23 Jul 2018 - 29 Jul 2018)
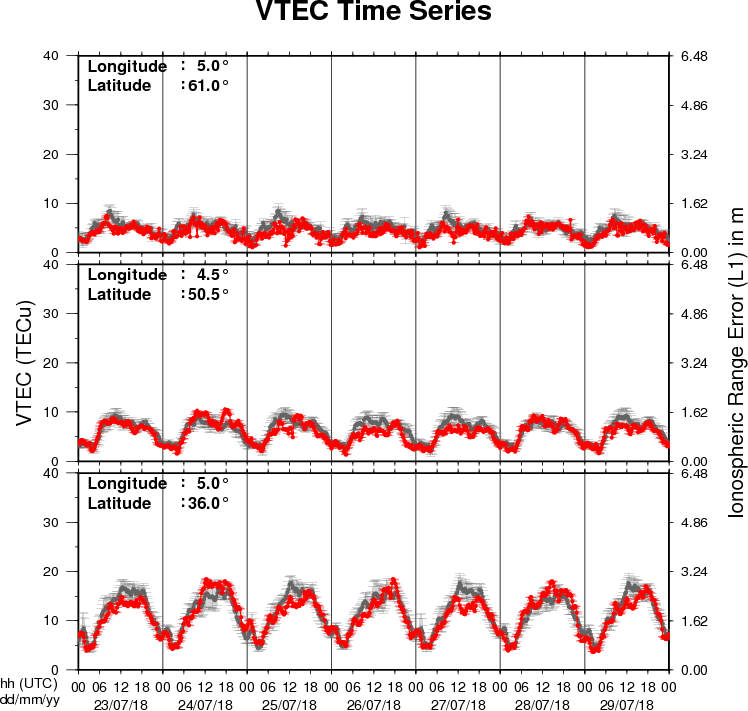
The figure shows the time evolution of the Vertical Total Electron Content (VTEC) (in red) during the last week at three locations:
a) in the northern part of Europe(N61°, 5°E)
b) above Brussels(N50.5°, 4.5°E)
c) in the southern part of Europe(N36°, 5°E)
This figure also shows (in grey) the normal ionospheric behaviour expected based on the median VTEC from the 15 previous days.
The VTEC is expressed in TECu (with TECu=10^16 electrons per square meter) and is directly related to the signal propagation delay due to the ionosphere (in figure: delay on GPS L1 frequency).
The Sun's radiation ionizes the Earth's upper atmosphere, the ionosphere, located from about 60km to 1000km above the Earth's surface.The ionization process in the ionosphere produces ions and free electrons. These electrons perturb the propagation of the GNSS (Global Navigation Satellite System) signals by inducing a so-called ionospheric delay.
See http://stce.be/newsletter/GNSS_final.pdf for some more explanations ; for detailed information, see http://gnss.be/ionosphere_tutorial.php