- Table of Content
- 1.Strong geomagn...
- 2.NOAA 2720 belo...
- 3.Review of sola...
- 4.PROBA2 Observa...
- 5.The Internatio...
- 6.Review of geom...
- 7.Geomagnetic Ob...
- 8.The SIDC space...
- 9.Review of iono...
2. NOAA 2720 belongs to the old solar cycle 24
3. Review of solar activity
4. PROBA2 Observations (20 Aug 2018 - 26 Aug 2018)
5. The International Sunspot Number
6. Review of geomagnetic activity
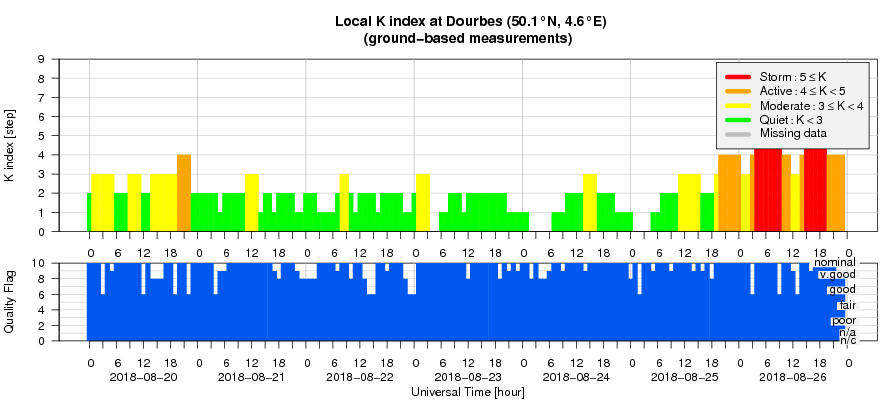
7. Geomagnetic Observations at Dourbes (20 Aug 2018 - 26 Aug 2018)
8. The SIDC space weather Briefing
9. Review of ionospheric activity (20 Aug 2018 - 26 Aug 2018)
Strong geomagnetic storm
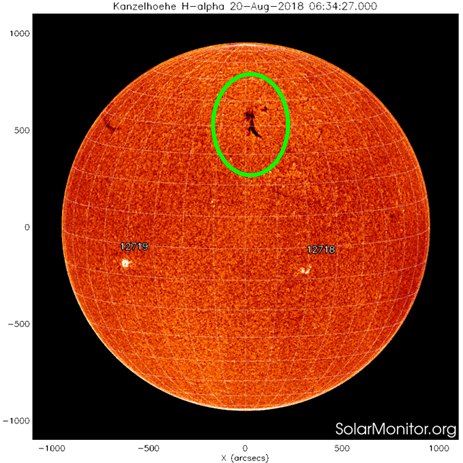
A strong geomagnetic storm was observed on 26 August. The source seems to have been a modest filament eruption on 20 August (see annotated H-alpha image from Kanzelhöhe) with the associated coronal mass ejection (CME) barely visible in SOHO's coronagraphs. In fact, the feature was so weak that CACTus (http://www.sidc.oma.be/cactus/ ), a tool to automatically detect CMEs in these coronagraphic images, did not even capture the CME. With the help of STEREO-A imagery, it was determined that this CME had an earth-directed component, but its effects were expected to be quite limited.
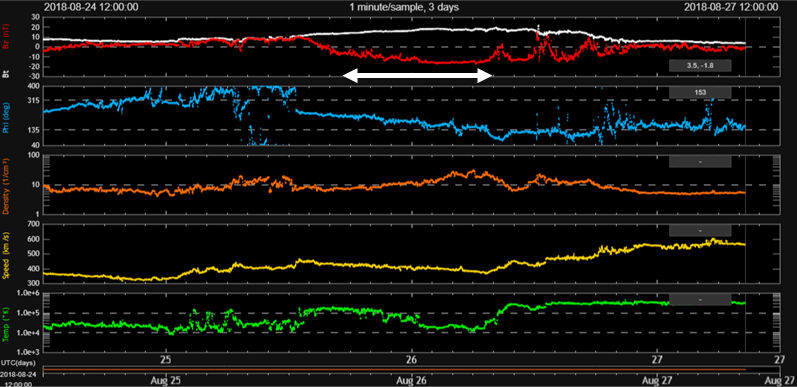
The prediction that the CME would impact Earth proved to be correct, however the strength of this slow moving interplanetary CME was quite a surprise. Indeed, upon its arrival, the magnetic field turned strongly southward with Bz (red curve in annotated DSCOVR's solar wind chart underneath) remaining negative for almost a day, being steady near -17 nT for almost half a day. A strong geomagnetic storm was recorded (Kp = 7) with K Dourbes reaching moderate levels (K Dourbes = 6). The Dst (or storm-time Disturbance; see this newsitem at http://www.stce.be/news/301/welcome.html for more info) index, measured by 4 stations near the magnetic equator, reached -169 nT during the morning hours of 26 August.
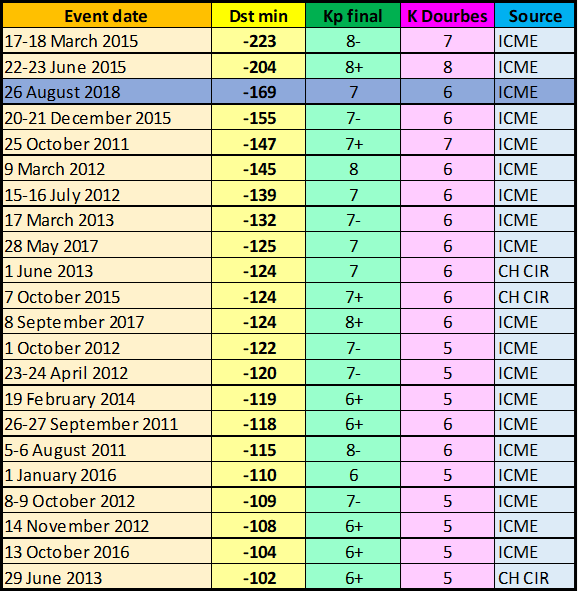
The table underneath provides all events with Dst reaching -100 nT or lower for the current solar cycle (SC24). It gives the date of the storm, the Dst (provisional after 2015), the final Kp (both from Kyoto WDC at http://wdc.kugi.kyoto-u.ac.jp/ ; See also http://www.stce.be/news/243/welcome.html ), and the preliminary K index as recorded in Dourbes (http://ionosphere.meteo.be/geomagnetism/ground_K_dourbes/ ). The last column gives the source of the disturbance: either an interplanetary CME (ICME), or the co-rotating interaction region preceding the high speed stream from a coronal hole (CH CIR; see this news item at http://www.stce.be/news/269/welcome.html for more info on CIRs). It is well-known that ICMEs can produce much stronger geomagnetic storms than CH wind streams and CH CIRs.
As can be seen, and based on the preliminary values of the Dst index, the major geomagnetic storm from 26 August is the third strongest of the ongoing solar cycle. With -169 nT, only the famous events of 17-18 March 2015 and 22-23 June 2015 were stronger (resp. -223 nT and -204 nT). On the 4th place we have the 20-21 December 2015 event (-155 nT). These are the only 4 geomagnetic storms of SC24 having reached a Dst of -150 nT or stronger. All four had ICMEs as their source, as expected.
NOAA 2720 belongs to the old solar cycle 24
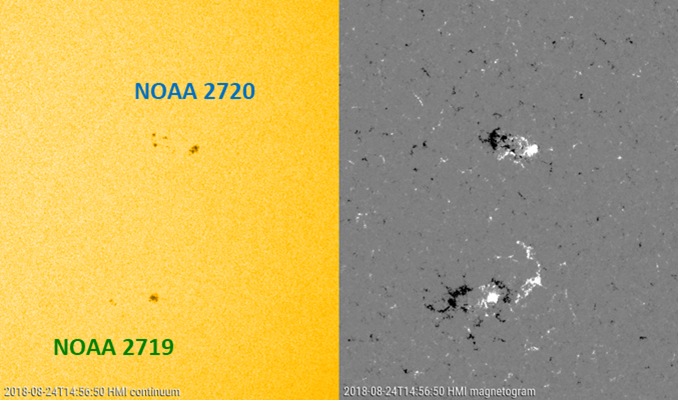
NOAA 2720 started to develop on 23 August and became the largest sunspot group of the week. It had a reversed polarity, as can be seen in the SDO images underneath (https://sdo.gsfc.nasa.gov/data/aiahmi/ ; left: white light; right: magnetogram). In the magnetogram, white means field lines coming out of the Sun, and black means field lines returning to the Sun. Normally, a sunspot group on the northern hemisphere (NOAA 2720; top) should have a polarity opposite to that of the southern hemisphere (NOAA 2719; bottom), but it can clearly be seen that in both sunspot groups the leading spot has a positive magnetic polarity ("white").
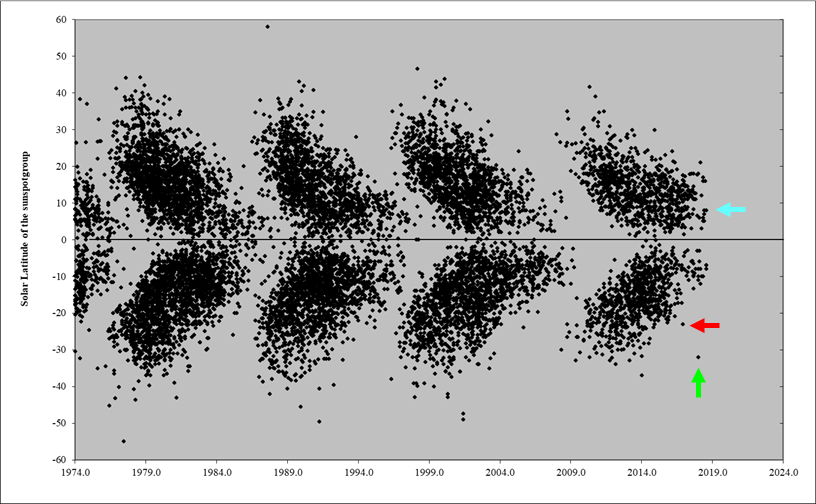
Because of this reversed polarity, some websites claimed NOAA 2720 was possibly one of the first groups of the new solar cycle (SC25). This is simply not true, in view of the very low latitude of this sunspot region (N08). A new SC25 group should have reversed SC24 magnetic polarity and high latitude (20 degrees or higher). The "Butterfly diagram" underneath shows the position (latitude) of each sunspot group over time. Only two numbered sunspot groups can currently claim to belong to the new SC25 (indicated by red and green arrows). There are also a few other groups that belonged to the new cycle, but they were so small and short-lived they did not get a NOAA number and do not show up in this diagram. See this STCE newsitem at http://www.stce.be/news/422/welcome.html for more info on these regions and their particulars. The diagram also clearly shows that NOAA 2720 (indicated by the blue arrow) does not belong to the new cycle.
During each solar cycle, about 3% of all active regions have a reversed polarity (and do not belong to the previous or next solar cycle). This percentage varies somewhat from one solar cycle to the next. With 2000 to 3000 sunspot groups per solar cycle, this means nonetheless that every solar cycle has a few dozens of this kind of bad boys.
Review of solar activity
X-ray flux remained below B level with the exception of August 24 and 25 when a series of low B flares occurred. These were associated with the emergence of new region NOAA 2720. Some renewed magnetic flux emerged in existing region NOAA 2719. This revival did not lead to flaring activity.
A faint Coronal Mass Ejection (CME) front was detected in SoHO/LASCO C2 images around 21:12UT August 20. The CME was mainly directed towards the West but with an extension over the South. Although faint, it could be classified as partial halo CME. The CME was related to the filament eruption on August 20, around 19:00UT. The filament was at that time located near the central meridian between 35 and 50 degrees North. The angular extent together with the location of the associated filament eruption indicated that the CME should be expected to have an Earth-bound component. With an uncertain speed between 300 and 500 km/s, its arrival was anticipated between noon of August 24 and noon of August 25.
Proton flux levels were at background values throughout the week.
PROBA2 Observations (20 Aug 2018 - 26 Aug 2018)
Solar Activity
Solar flare activity was very low during the week.
In order to view the activity of this week in more detail, we suggest to go to the following website from which all the daily (normal and difference) movies can be accessed: http://proba2.oma.be/ssa
This page also lists the recorded flaring events.
A weekly overview movie can be found here (SWAP week 439).
http://proba2.oma.be/swap/data/mpg/movies/weekly_movies/weekly_movie_2018_08_20.mp4
Details about some of this week’s events, can be found further below.
If any of the linked movies are unavailable they can be found in the P2SC movie repository here
http://proba2.oma.be/swap/data/mpg/movies/
Monday Aug 20
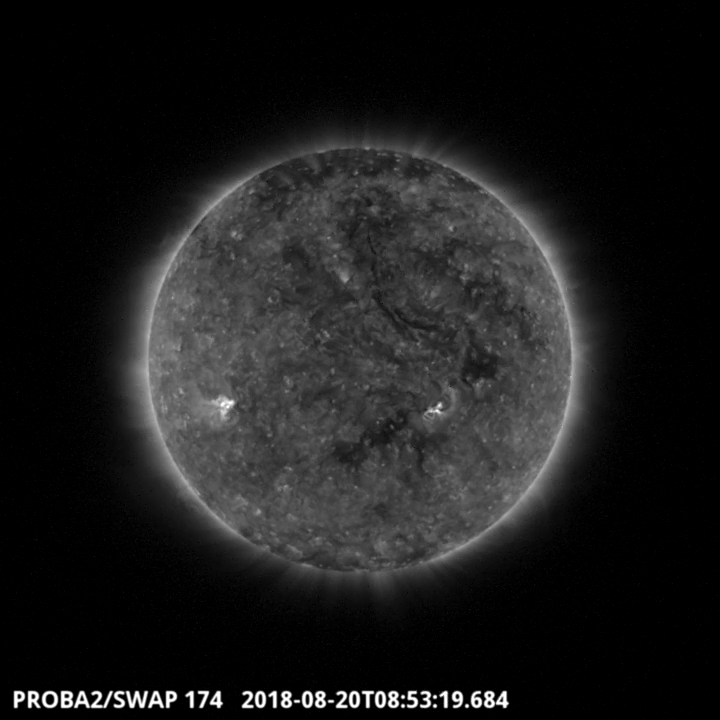
A filament located around the central meridian between 35 and 50 degrees North is shown in the SWAP image above. This filament erupted around 19:00 UT and produced a partial halo CME detected in SoHO/LASCO around 21:12 UT.
Find a movie of the event here (SWAP movie)
http://proba2.oma.be/swap/data/mpg/movies/20180820_swap_movie.mp4
Saturday Aug 25
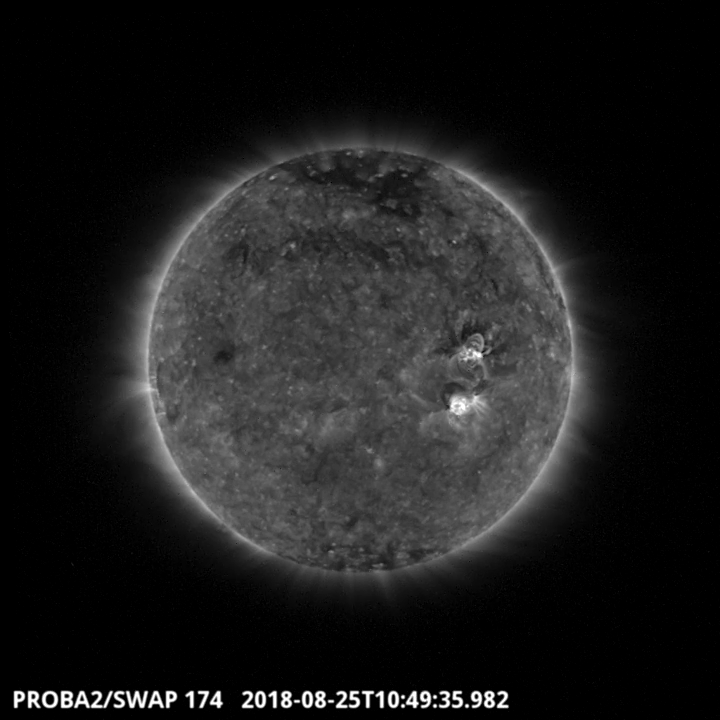
The largest flare of the week was a B4.1 class flare associated with the NOAA region 2720. The flare is visible in the West part of the SWAP image above at 10:49 UT on 2018-Aug-25. On that day, nine other B class flares were produced from the same region.
Find a movie of the event here (SWAP movie)
http://proba2.oma.be/swap/data/mpg/movies/20180825_swap_movie.mp4
The International Sunspot Number
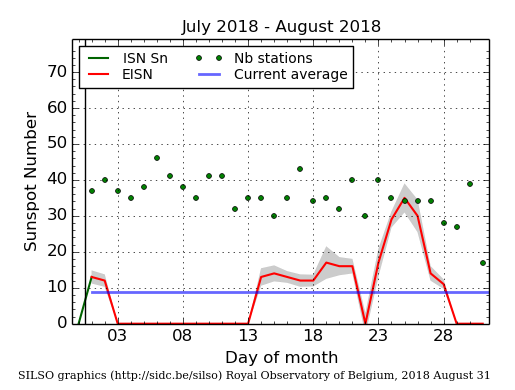
The daily Estimated International Sunspot Number (EISN, red curve with shaded error) derived by a simplified method from real-time data from the worldwide SILSO network. It extends the official Sunspot Number from the full processing of the preceding month (green line). The plot shows the last 30 days (about one solar rotation). The horizontal blue line shows the current monthly average, while the green dots give the number of stations included in the calculation of the EISN for each day.
Review of geomagnetic activity
At the start of the week, the influence of a coronal hole high speed stream from a transequatorial negative polarity coronal
hole was visible in the solar wind parameters measured in L1. Solar wind speed reached a maximum of 670 km/s around midnight August
20/21 before starting a gradual decline.
Solar wind then became enhanced again due to the arrival of the August 20 CME. Solar wind speed remained near background levels but the magnetic field showed clearly the passage of a weak magnetic cloud (8nT) just before noon August 24, followed just after noon August 25 by a more significant magnetic cloud (19nT). Especially the latter more significant cloud had a pronounced and prolonged Southward orientation (for almost 36 hours) with Bz going down to -17nT.
The high speed stream induced a brief period of active geomagnetic conditions before midnight August 20/21.
The passage of the significant magnetic cloud associated to the August 20 CME caused a moderate to major magnetic storm (K Dourbes reached 6 and NOAA Kp reached 7) on august 26. Dst went down to -169nT, in terms of which this storm classifies as the 3rd strongest storm of the current Solar cycle.
Geomagnetic Observations at Dourbes (20 Aug 2018 - 26 Aug 2018)
The SIDC space weather Briefing
The Space Weather Briefing presented by the forecaster on duty from August 19 to 26. It reflects in images and graphs what is written in the Solar and Geomagnetic Activity report.
The pdf-version: http://www.stce.be/briefings/20180827_SWbriefing.pdf
An automatically running powerpoint: http://www.stce.be/briefings/20180827_SWbriefing.ppsm
Review of ionospheric activity (20 Aug 2018 - 26 Aug 2018)
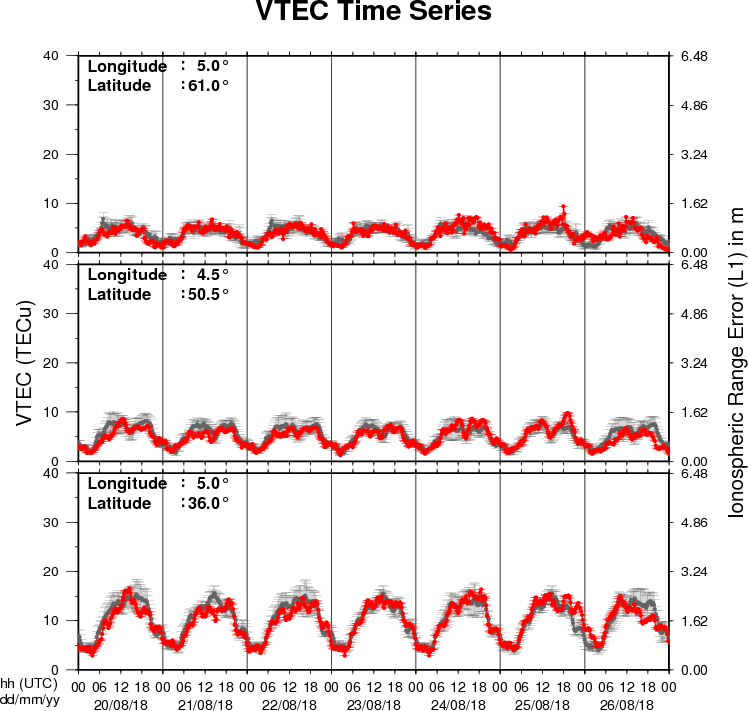
The figure shows the time evolution of the Vertical Total Electron Content (VTEC) (in red) during the last week at three locations:
a) in the northern part of Europe(N61°, 5°E)
b) above Brussels(N50.5°, 4.5°E)
c) in the southern part of Europe(N36°, 5°E)
This figure also shows (in grey) the normal ionospheric behaviour expected based on the median VTEC from the 15 previous days.
The VTEC is expressed in TECu (with TECu=10^16 electrons per square meter) and is directly related to the signal propagation delay due to the ionosphere (in figure: delay on GPS L1 frequency).
The Sun's radiation ionizes the Earth's upper atmosphere, the ionosphere, located from about 60km to 1000km above the Earth's surface.The ionization process in the ionosphere produces ions and free electrons. These electrons perturb the propagation of the GNSS (Global Navigation Satellite System) signals by inducing a so-called ionospheric delay.
See http://stce.be/newsletter/GNSS_final.pdf for some more explanations ; for detailed information, see http://gnss.be/ionosphere_tutorial.php