- Table of Content
- 1.CESRA 2018 Sum...
- 2.PROBA2 Observa...
- 3.Review of sola...
- 4.Review of geom...
- 5.The SIDC space...
- 6.The Internatio...
- 7.Geomagnetic Ob...
- 8.Review of iono...
2. PROBA2 Observations (27 Aug 2018 - 2 Sep 2018)
3. Review of solar activity
4. Review of geomagnetic activity
5. The SIDC space weather Briefing
6. The International Sunspot Number
7. Geomagnetic Observations at Dourbes (27 Aug 2018 - 2 Sep 2018)
8. Review of ionospheric activity (27 Aug 2018 - 2 Sep 2018)
CESRA 2018 Summer School
CESRA summer school starts Monday, September 10. The CESRA people welcome 17 students for one week of radio science fun: https://events.oma.be/indico/event/53/
PROBA2 Observations (27 Aug 2018 - 2 Sep 2018)
Solar Activity
Solar flare activity remained very low during the week.
In order to view the activity of this week in more detail, we suggest to go to the following website from which all the daily (normal and difference) movies can be accessed: http://proba2.oma.be/ssa
This page also lists the recorded flaring events.
A weekly overview movie can be found here (SWAP week 440): http://proba2.oma.be/swap/data/mpg/movies/weekly_movies/weekly_movie_2018_08_27.mp4
Details about some of this week's events can be found further below.
If any of the linked movies are unavailable they can be found in the P2SC movie repository here: http://proba2.oma.be/swap/data/mpg/movies/
Tuesday Aug 28
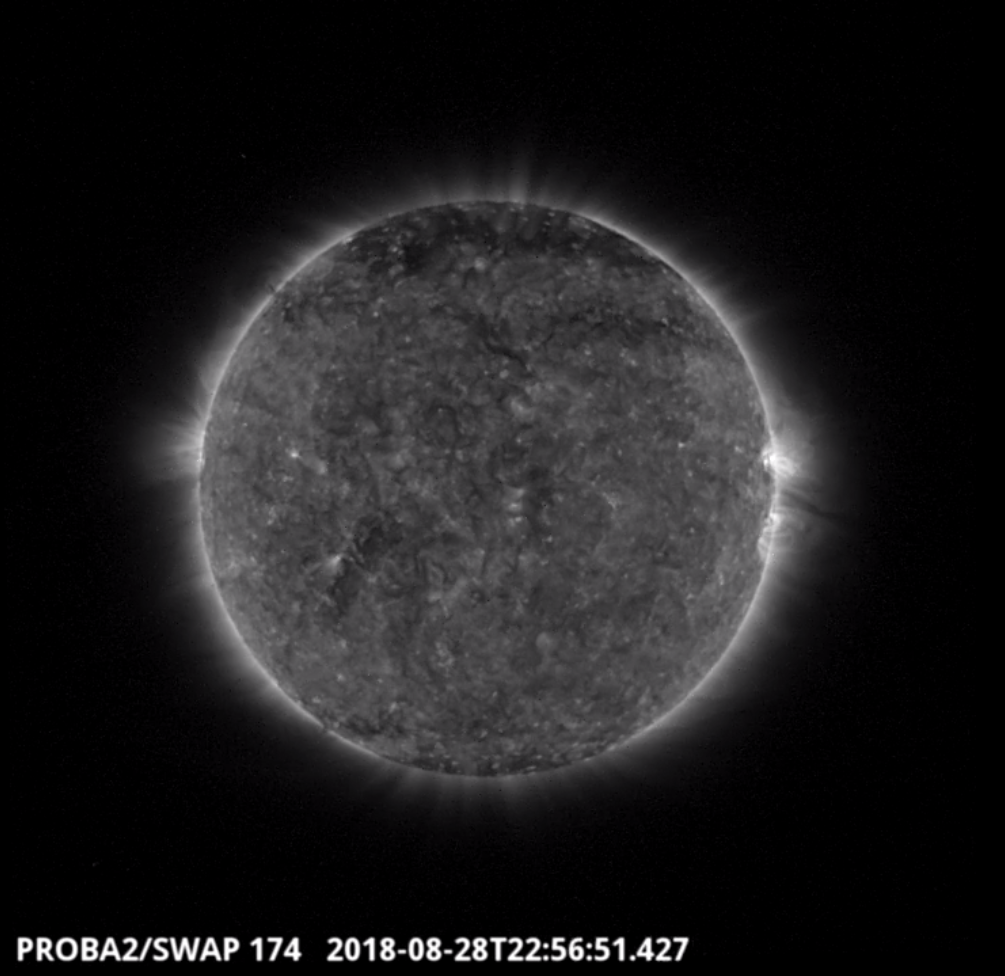
Two loop systems extending from NOAA AR2719 and AR2720 can be seen on the western limb of the Sun, as shown in the SWAP image above at 22:56 UT on 2018-Aug-28.
Find a movie of the day here (SWAP movie): http://proba2.oma.be/swap/movies/20180828_swap_movie.mp4
Review of solar activity
X-ray flux remained below the B-class level. In regions 2719 and 2720 some renewed flux emerged. But both regions remained inactive in terms of flaring.
No Earth directed CME was observed. However a small back-sided eruption was detected off the East limb on 28-Aug-2018. It was not expected to affect the Earth. The patchy coronal hole, located in the central part of the solar disk at the beginning of the week, did not produce any significant affects at the Earth.
Proton flux levels remained at background values throughout the week.
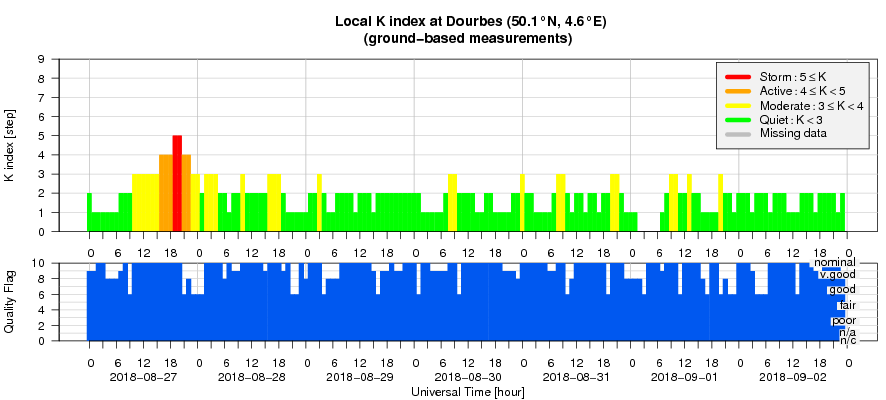
Review of geomagnetic activity
At the start of the week, the Earth was under the influence of a high speed stream (HSS) from an extension of a northern polar coronal hole. Solar wind speeds reached a maximum of 620 km/s around 20:00UT on 27-Aug-2018 before starting a gradual decline. The total magnetic field strength has fluctuated around 5 nT. The Bz component has fluctuated between -5 and +5 nT.
Geomagnetic conditions ranged between Kp index 1-6 (NOAA) and local K index 0-5 (Dourbes) over the past week. The geomagnetic conditions reached storm levels on a planetary level on Monday (27-Aug-2018), due to a jump in the solar wind speed combined with a Southward orientation of the magnetic field, most likely caused by the HSS from the northern polar coronal hole.
The SIDC space weather Briefing
The Space Weather Briefing presented by the forecaster on duty from 26 Aug to 2 Sep. It reflects in images and graphs what is written in the Solar and Geomagnetic Activity report.
PDF-version: http://www.stce.be/briefings/SIDCbriefing_20180903.pdf
automatically running presentation: http://www.stce.be/briefings/SIDCbriefing_20180903.ppsm
The International Sunspot Number
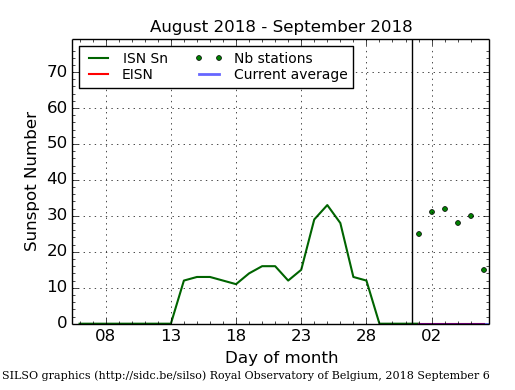
The daily Estimated International Sunspot Number (EISN, red curve with shaded error) derived by a simplified method from real-time data from the worldwide SILSO network. It extends the official Sunspot Number from the full processing of the preceding month (green line). The plot shows the last 30 days (about one solar rotation). The horizontal blue line shows the current monthly average (which is zero in this graph - so you don't see the blue line), while the green dots give the number of stations included in the calculation of the EISN for each day.
Geomagnetic Observations at Dourbes (27 Aug 2018 - 2 Sep 2018)
Review of ionospheric activity (27 Aug 2018 - 2 Sep 2018)
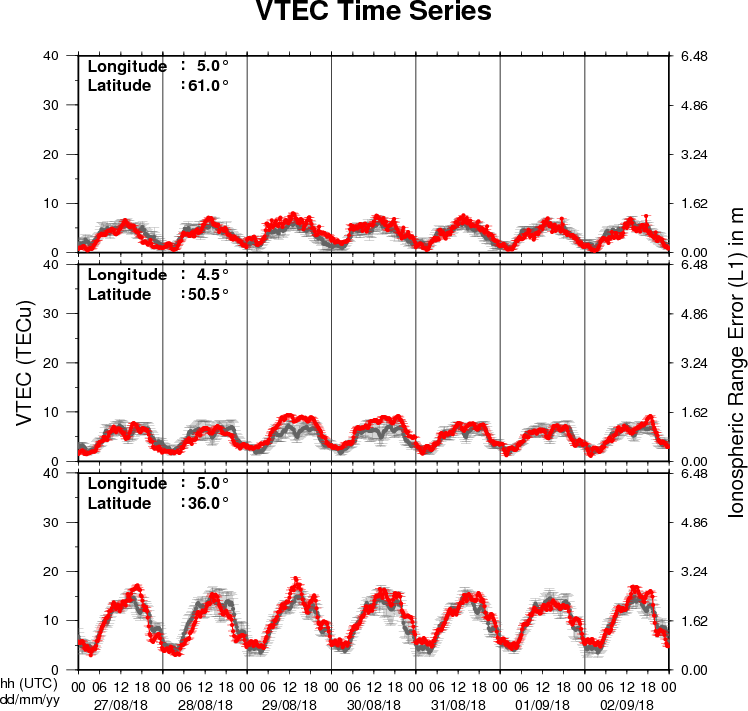
The figure shows the time evolution of the Vertical Total Electron Content (VTEC) (in red) during the last week at three locations:
a) in the northern part of Europe(N61°, 5°E)
b) above Brussels(N50.5°, 4.5°E)
c) in the southern part of Europe(N36°, 5°E)
This figure also shows (in grey) the normal ionospheric behaviour expected based on the median VTEC from the 15 previous days.
The VTEC is expressed in TECu (with TECu=10^16 electrons per square meter) and is directly related to the signal propagation delay due to the ionosphere (in figure: delay on GPS L1 frequency).
The Sun's radiation ionizes the Earth's upper atmosphere, the ionosphere, located from about 60km to 1000km above the Earth's surface.The ionization process in the ionosphere produces ions and free electrons. These electrons perturb the propagation of the GNSS (Global Navigation Satellite System) signals by inducing a so-called ionospheric delay.
See http://stce.be/newsletter/GNSS_final.pdf for some more explanations ; for detailed information, see http://gnss.be/ionosphere_tutorial.php